
|
|||||
|
 | |
| |
| |
| |
| |
| |
|
Gene: GPD2 |
Gene summary for GPD2 |
| Gene information | Species | Human | Gene symbol | GPD2 | Gene ID | 2820 |
| Gene name | glycerol-3-phosphate dehydrogenase 2 | |
| Gene Alias | GDH2 | |
| Cytomap | 2q24.1 | |
| Gene Type | protein-coding | GO ID | GO:0005975 | UniProtAcc | P43304 |
Top |
Malignant transformation analysis |
| Identification of the aberrant gene expression in precancerous and cancerous lesions by comparing the gene expression of stem-like cells in diseased tissues with normal stem cells |
| Entrez ID | Symbol | Replicates | Species | Organ | Tissue | Adj P-value | Log2FC | Malignancy |
| 2820 | GPD2 | CCI_1 | Human | Cervix | CC | 4.26e-14 | 1.11e+00 | 0.528 |
| 2820 | GPD2 | CCI_2 | Human | Cervix | CC | 3.58e-13 | 1.04e+00 | 0.5249 |
| 2820 | GPD2 | CCI_3 | Human | Cervix | CC | 6.68e-17 | 9.20e-01 | 0.516 |
| 2820 | GPD2 | T3 | Human | Cervix | CC | 5.86e-04 | 2.16e-01 | 0.1389 |
| 2820 | GPD2 | HTA11_3410_2000001011 | Human | Colorectum | AD | 2.22e-09 | -5.37e-01 | 0.0155 |
| 2820 | GPD2 | HTA11_866_3004761011 | Human | Colorectum | AD | 1.92e-04 | -4.59e-01 | 0.096 |
| 2820 | GPD2 | HTA11_10711_2000001011 | Human | Colorectum | AD | 6.62e-04 | -5.14e-01 | 0.0338 |
| 2820 | GPD2 | HTA11_7696_3000711011 | Human | Colorectum | AD | 1.52e-06 | -4.57e-01 | 0.0674 |
| 2820 | GPD2 | HTA11_99999970781_79442 | Human | Colorectum | MSS | 8.70e-05 | -4.13e-01 | 0.294 |
| 2820 | GPD2 | HTA11_99999971662_82457 | Human | Colorectum | MSS | 4.27e-02 | -4.05e-01 | 0.3859 |
| 2820 | GPD2 | HTA11_99999974143_84620 | Human | Colorectum | MSS | 2.10e-14 | -5.24e-01 | 0.3005 |
| 2820 | GPD2 | A001-C-207 | Human | Colorectum | FAP | 4.83e-03 | -3.44e-01 | 0.1278 |
| 2820 | GPD2 | A015-C-203 | Human | Colorectum | FAP | 1.69e-23 | -4.99e-01 | -0.1294 |
| 2820 | GPD2 | A015-C-204 | Human | Colorectum | FAP | 9.47e-09 | -4.83e-01 | -0.0228 |
| 2820 | GPD2 | A002-C-201 | Human | Colorectum | FAP | 3.24e-12 | -4.19e-01 | 0.0324 |
| 2820 | GPD2 | A001-C-119 | Human | Colorectum | FAP | 3.73e-07 | -4.74e-01 | -0.1557 |
| 2820 | GPD2 | A001-C-108 | Human | Colorectum | FAP | 1.90e-14 | -4.24e-01 | -0.0272 |
| 2820 | GPD2 | A002-C-205 | Human | Colorectum | FAP | 1.21e-19 | -4.91e-01 | -0.1236 |
| 2820 | GPD2 | A001-C-104 | Human | Colorectum | FAP | 2.95e-05 | -3.77e-01 | 0.0184 |
| 2820 | GPD2 | A015-C-005 | Human | Colorectum | FAP | 4.46e-06 | -3.73e-01 | -0.0336 |
| Page: 1 2 3 4 5 6 7 |
| Tissue | Expression Dynamics | Abbreviation |
| Cervix |  | CC: Cervix cancer |
| HSIL_HPV: HPV-infected high-grade squamous intraepithelial lesions | ||
| N_HPV: HPV-infected normal cervix | ||
| Colorectum (GSE201348) |  | FAP: Familial adenomatous polyposis |
| CRC: Colorectal cancer | ||
| Colorectum (HTA11) |  | AD: Adenomas |
| SER: Sessile serrated lesions | ||
| MSI-H: Microsatellite-high colorectal cancer | ||
| MSS: Microsatellite stable colorectal cancer | ||
| Esophagus |  | ESCC: Esophageal squamous cell carcinoma |
| HGIN: High-grade intraepithelial neoplasias | ||
| LGIN: Low-grade intraepithelial neoplasias | ||
| GC | 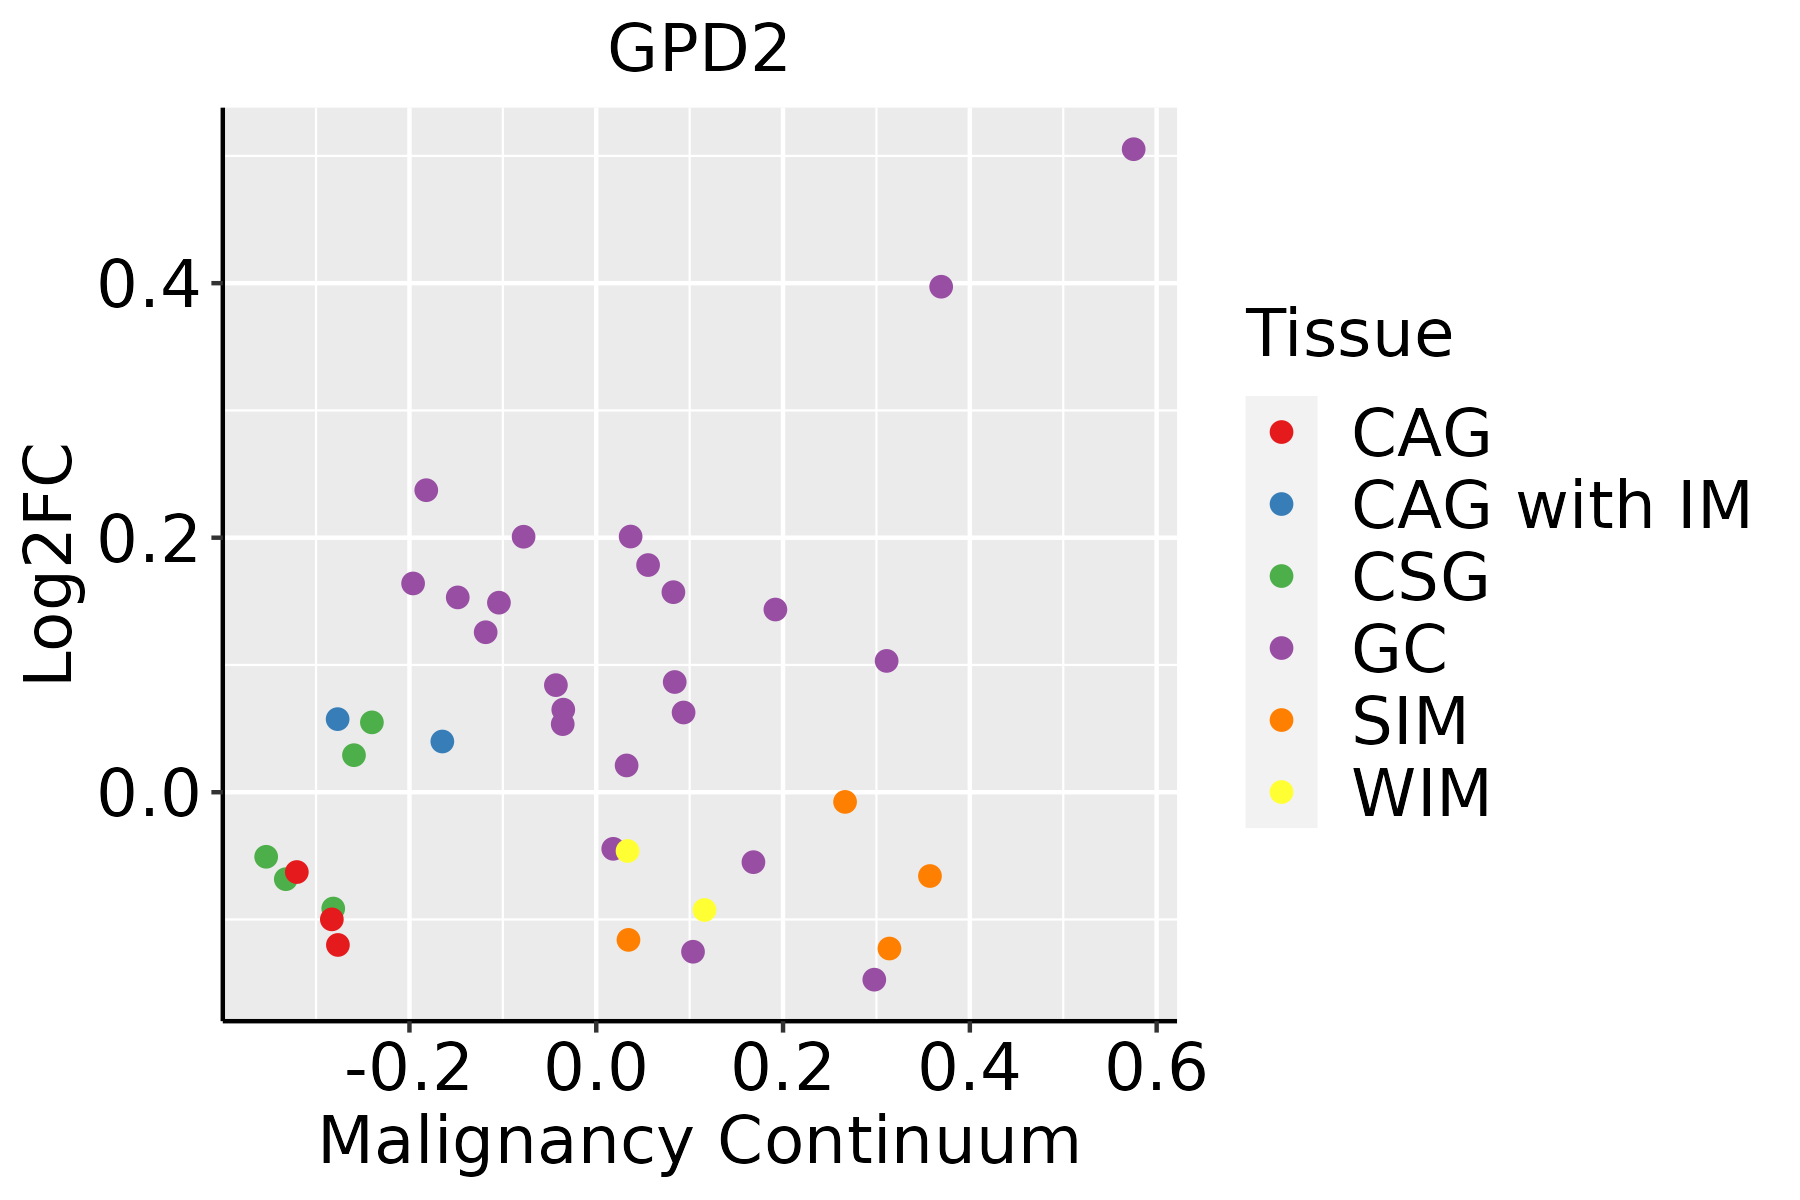 | CAG: Chronic atrophic gastritis |
| CAG with IM: Chronic atrophic gastritis with intestinal metaplasia | ||
| CSG: Chronic superficial gastritis | ||
| GC: Gastric cancer | ||
| SIM: Severe intestinal metaplasia | ||
| WIM: Wild intestinal metaplasia | ||
| Lung |  | AAH: Atypical adenomatous hyperplasia |
| AIS: Adenocarcinoma in situ | ||
| IAC: Invasive lung adenocarcinoma | ||
| MIA: Minimally invasive adenocarcinoma | ||
| Oral Cavity | 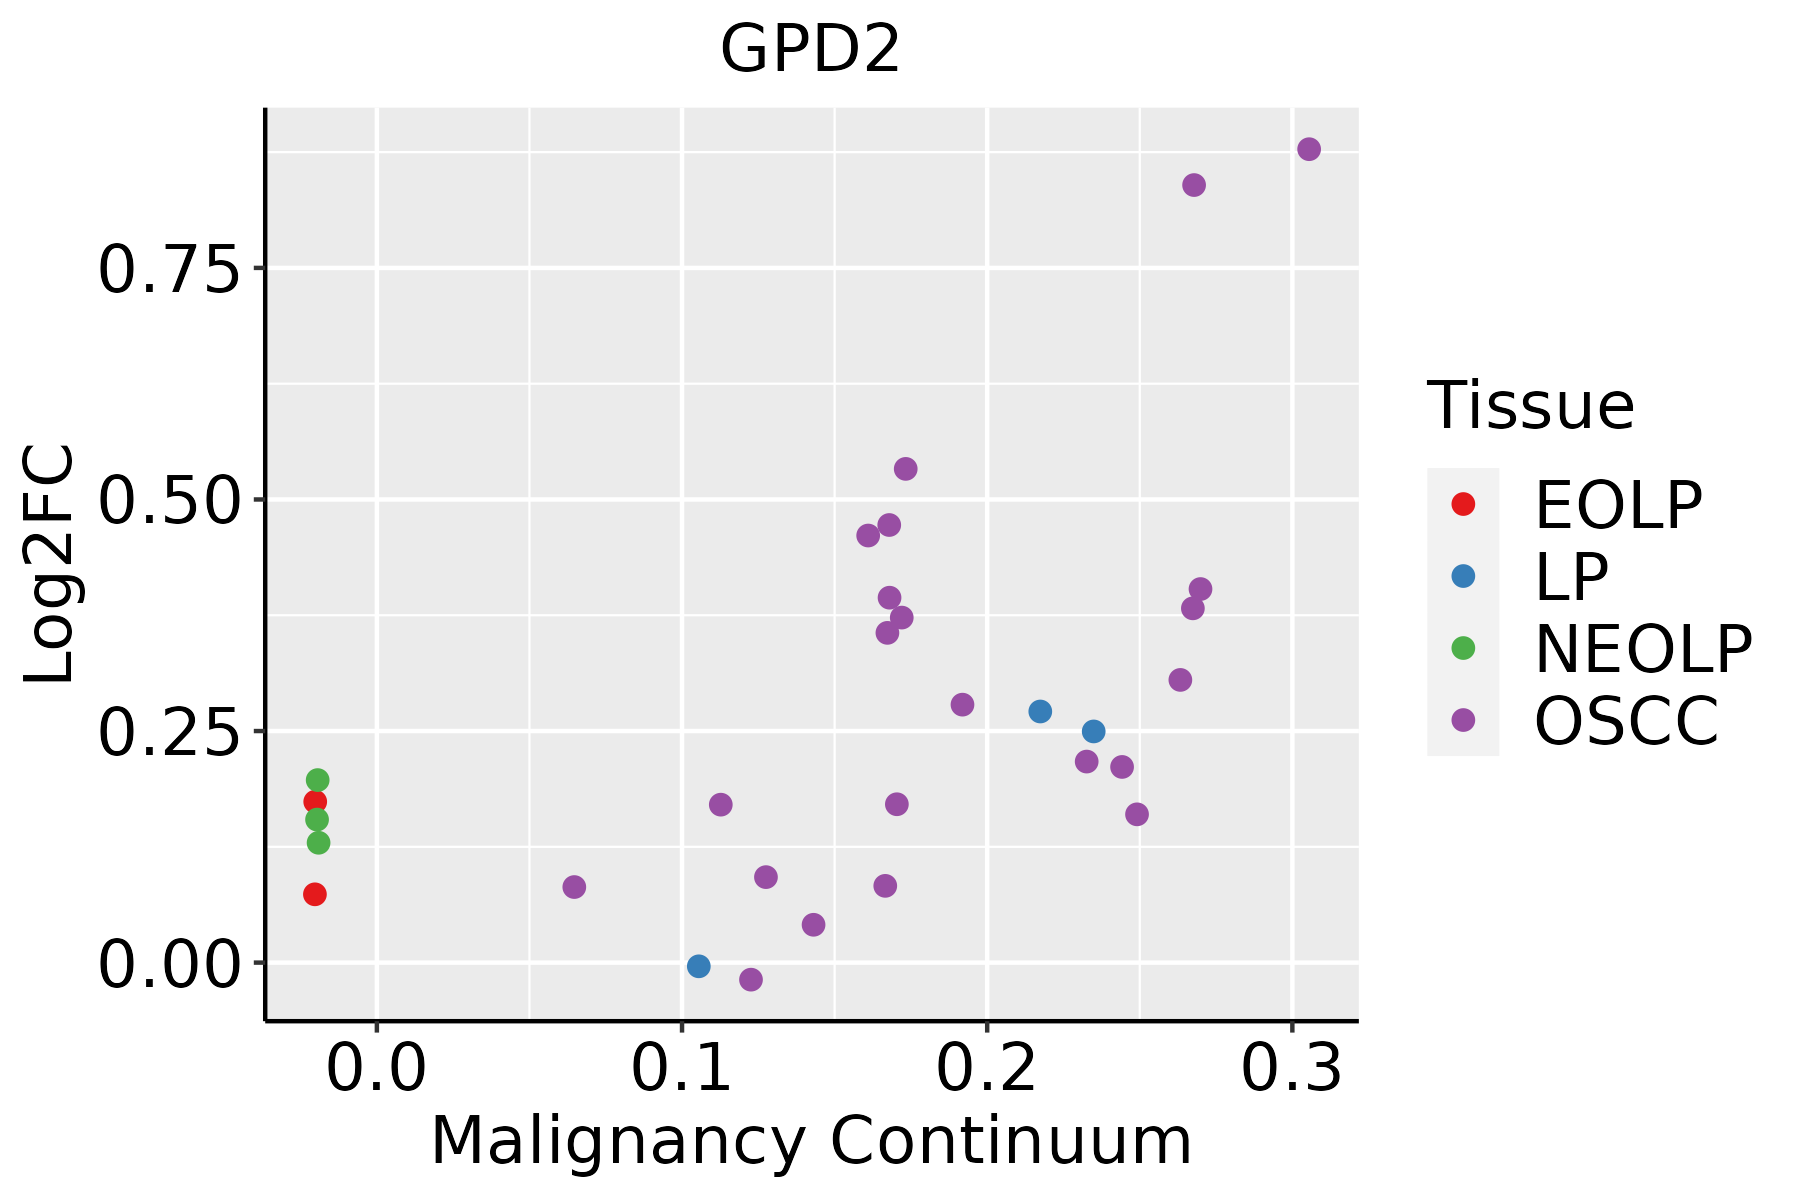 | EOLP: Erosive Oral lichen planus |
| LP: leukoplakia | ||
| NEOLP: Non-erosive oral lichen planus | ||
| OSCC: Oral squamous cell carcinoma | ||
| Prostate | 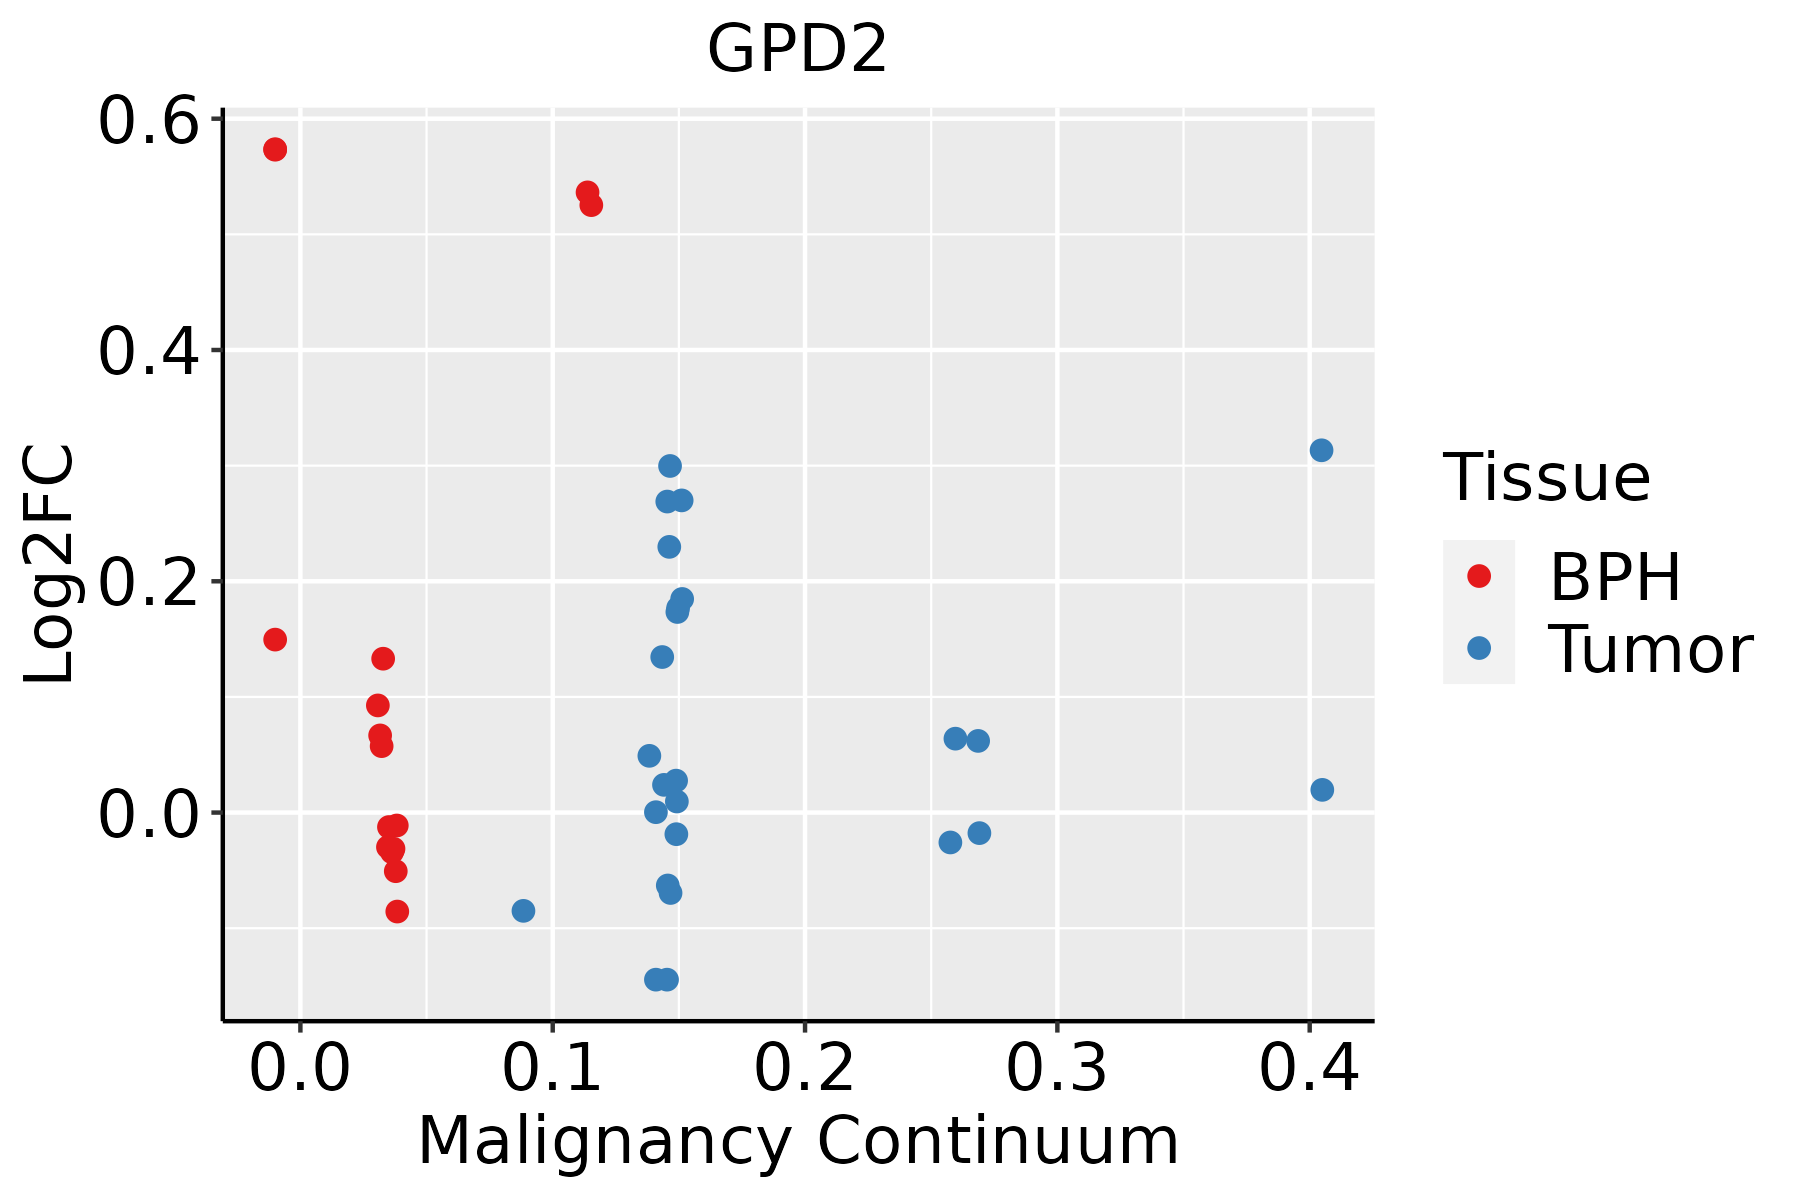 | BPH: Benign Prostatic Hyperplasia |
| ∗log2FC in expression of this searched gene in stem-like cells from each diseased tissue sample relative to stem-like cells in normal samples in each tissue plotted against the malignancy continuum. Samples are colored based on if they are from different disease stage. |
Top |
Malignant transformation related pathway analysis |
| Find out the enriched GO biological processes and KEGG pathways involved in transition from healthy to precancer to cancer |
| Tissue | Disease Stage | Enriched GO biological Processes |
| Colorectum | AD |  |
| Colorectum | SER |  |
| Colorectum | MSS |  |
| Colorectum | MSI-H |  |
| Colorectum | FAP |  |
| ∗Top 15 enriched GO BP terms are showed in the bar plot of each disease state in each tissue. Each row represents a significant GO biological process which is colored according to the -log10(p.adjust). |
| Page: 1 2 3 4 5 6 7 8 9 |
| GO ID | Tissue | Disease Stage | Description | Gene Ratio | Bg Ratio | pvalue | p.adjust | Count |
| GO:00229049 | Cervix | CC | respiratory electron transport chain | 42/2311 | 114/18723 | 1.67e-11 | 4.77e-09 | 42 |
| GO:00453339 | Cervix | CC | cellular respiration | 66/2311 | 230/18723 | 2.07e-11 | 5.39e-09 | 66 |
| GO:00229009 | Cervix | CC | electron transport chain | 53/2311 | 175/18723 | 2.23e-10 | 3.43e-08 | 53 |
| GO:00060919 | Cervix | CC | generation of precursor metabolites and energy | 105/2311 | 490/18723 | 7.40e-09 | 6.61e-07 | 105 |
| GO:00159809 | Cervix | CC | energy derivation by oxidation of organic compounds | 74/2311 | 318/18723 | 3.83e-08 | 2.53e-06 | 74 |
| GO:00067346 | Cervix | CC | NADH metabolic process | 9/2311 | 29/18723 | 6.49e-03 | 3.61e-02 | 9 |
| GO:0006091 | Colorectum | AD | generation of precursor metabolites and energy | 209/3918 | 490/18723 | 3.17e-28 | 6.61e-25 | 209 |
| GO:0045333 | Colorectum | AD | cellular respiration | 119/3918 | 230/18723 | 3.21e-25 | 4.02e-22 | 119 |
| GO:0015980 | Colorectum | AD | energy derivation by oxidation of organic compounds | 143/3918 | 318/18723 | 2.78e-22 | 2.49e-19 | 143 |
| GO:0022900 | Colorectum | AD | electron transport chain | 89/3918 | 175/18723 | 1.42e-18 | 8.91e-16 | 89 |
| GO:0022904 | Colorectum | AD | respiratory electron transport chain | 63/3918 | 114/18723 | 8.23e-16 | 2.45e-13 | 63 |
| GO:0072594 | Colorectum | AD | establishment of protein localization to organelle | 148/3918 | 422/18723 | 7.95e-12 | 1.04e-09 | 148 |
| GO:0006913 | Colorectum | AD | nucleocytoplasmic transport | 102/3918 | 301/18723 | 1.00e-07 | 4.85e-06 | 102 |
| GO:0051169 | Colorectum | AD | nuclear transport | 102/3918 | 301/18723 | 1.00e-07 | 4.85e-06 | 102 |
| GO:0044282 | Colorectum | AD | small molecule catabolic process | 118/3918 | 376/18723 | 1.05e-06 | 3.55e-05 | 118 |
| GO:0034504 | Colorectum | AD | protein localization to nucleus | 94/3918 | 290/18723 | 2.83e-06 | 8.09e-05 | 94 |
| GO:0016052 | Colorectum | AD | carbohydrate catabolic process | 56/3918 | 154/18723 | 7.01e-06 | 1.73e-04 | 56 |
| GO:0006066 | Colorectum | AD | alcohol metabolic process | 106/3918 | 353/18723 | 3.02e-05 | 5.57e-04 | 106 |
| GO:0006734 | Colorectum | AD | NADH metabolic process | 16/3918 | 29/18723 | 5.32e-05 | 9.01e-04 | 16 |
| GO:0044262 | Colorectum | AD | cellular carbohydrate metabolic process | 87/3918 | 283/18723 | 6.00e-05 | 1.01e-03 | 87 |
| Page: 1 2 3 4 5 6 7 |
| Pathway ID | Tissue | Disease Stage | Description | Gene Ratio | Bg Ratio | pvalue | p.adjust | qvalue | Count |
| Page: 1 |
Top |
Cell-cell communication analysis |
| Identification of potential cell-cell interactions between two cell types and their ligand-receptor pairs for different disease states |
| Ligand | Receptor | LRpair | Pathway | Tissue | Disease Stage |
| Page: 1 |
Top |
Single-cell gene regulatory network inference analysis |
| Find out the significant the regulons (TFs) and the target genes of each regulon across cell types for different disease states |
| TF | Cell Type | Tissue | Disease Stage | Target Gene | RSS | Regulon Activity |
| ∗The dot plots of a searched regulon are shown for all cell subpopulations in each disease state of each tissue based on the regulon specific score inferred using pySCENIC and by calculating the average expression. |
| Page: 1 |
Top |
Somatic mutation of malignant transformation related genes |
| Annotation of somatic variants for genes involved in malignant transformation |
| Hugo Symbol | Variant Class | Variant Classification | dbSNP RS | HGVSc | HGVSp | HGVSp Short | SWISSPROT | BIOTYPE | SIFT | PolyPhen | Tumor Sample Barcode | Tissue | Histology | Sex | Age | Stage | Therapy Types | Drugs | Outcome |
| GPD2 | SNV | Missense_Mutation | rs199507721 | c.302N>G | p.Asp101Gly | p.D101G | P43304 | protein_coding | deleterious(0.02) | benign(0.001) | TCGA-AC-A3YI-01 | Breast | breast invasive carcinoma | Female | >=65 | III/IV | Chemotherapy | cytoxan | CR |
| GPD2 | SNV | Missense_Mutation | novel | c.1817N>G | p.Lys606Arg | p.K606R | P43304 | protein_coding | tolerated(0.48) | benign(0) | TCGA-AN-A046-01 | Breast | breast invasive carcinoma | Female | >=65 | I/II | Unknown | Unknown | SD |
| GPD2 | SNV | Missense_Mutation | rs754957604 | c.934N>G | p.Ser312Gly | p.S312G | P43304 | protein_coding | deleterious(0) | possibly_damaging(0.873) | TCGA-E2-A158-01 | Breast | breast invasive carcinoma | Female | <65 | I/II | Chemotherapy | arimidex | SD |
| GPD2 | SNV | Missense_Mutation | rs367650555 | c.802N>A | p.Ala268Thr | p.A268T | P43304 | protein_coding | deleterious(0.01) | possibly_damaging(0.9) | TCGA-VS-A94Z-01 | Cervix | cervical & endocervical cancer | Female | <65 | I/II | Chemotherapy | cisplatin | CR |
| GPD2 | SNV | Missense_Mutation | novel | c.976N>C | p.Glu326Gln | p.E326Q | P43304 | protein_coding | tolerated(0.31) | benign(0.026) | TCGA-VS-A950-01 | Cervix | cervical & endocervical cancer | Female | <65 | III/IV | Unknown | Unknown | SD |
| GPD2 | SNV | Missense_Mutation | novel | c.422T>A | p.Leu141His | p.L141H | P43304 | protein_coding | deleterious(0) | probably_damaging(0.986) | TCGA-VS-A9UL-01 | Cervix | cervical & endocervical cancer | Female | >=65 | III/IV | Unknown | Unknown | PD |
| GPD2 | SNV | Missense_Mutation | c.1608N>T | p.Glu536Asp | p.E536D | P43304 | protein_coding | deleterious(0) | possibly_damaging(0.84) | TCGA-AA-3672-01 | Colorectum | colon adenocarcinoma | Female | >=65 | III/IV | Unknown | Unknown | SD | |
| GPD2 | SNV | Missense_Mutation | rs746974136 | c.832N>A | p.Glu278Lys | p.E278K | P43304 | protein_coding | deleterious(0.03) | benign(0.021) | TCGA-AA-3673-01 | Colorectum | colon adenocarcinoma | Female | <65 | I/II | Unknown | Unknown | SD |
| GPD2 | SNV | Missense_Mutation | c.887C>A | p.Ser296Tyr | p.S296Y | P43304 | protein_coding | deleterious(0.03) | benign(0.337) | TCGA-AA-3710-01 | Colorectum | colon adenocarcinoma | Female | >=65 | I/II | Unknown | Unknown | SD | |
| GPD2 | SNV | Missense_Mutation | c.304G>T | p.Asp102Tyr | p.D102Y | P43304 | protein_coding | deleterious(0) | probably_damaging(0.986) | TCGA-AA-3977-01 | Colorectum | colon adenocarcinoma | Male | >=65 | I/II | Unknown | Unknown | SD |
| Page: 1 2 3 4 5 6 7 8 |
Top |
Related drugs of malignant transformation related genes |
| Identification of chemicals and drugs interact with genes involved in malignant transfromation |
| (DGIdb 4.0) |
| Entrez ID | Symbol | Category | Interaction Types | Drug Claim Name | Drug Name | PMIDs |
| 2820 | GPD2 | DRUGGABLE GENOME | inhibitor | CHEMBL1703 | METFORMIN HYDROCHLORIDE | |
| 2820 | GPD2 | DRUGGABLE GENOME | HYDROGEN PEROXIDE | 15209538 |
| Page: 1 |

Copyright 2023-Present -The University of Texas Health Science Center at Houston |