
|
|||||
|
 | |
| |
| |
| |
| |
| |
|
Gene: GPCPD1 |
Gene summary for GPCPD1 |
| Gene information | Species | Human | Gene symbol | GPCPD1 | Gene ID | 56261 |
| Gene name | glycerophosphocholine phosphodiesterase 1 | |
| Gene Alias | EDI3 | |
| Cytomap | 20p12.3 | |
| Gene Type | protein-coding | GO ID | GO:0006629 | UniProtAcc | Q9NPB8 |
Top |
Malignant transformation analysis |
| Identification of the aberrant gene expression in precancerous and cancerous lesions by comparing the gene expression of stem-like cells in diseased tissues with normal stem cells |
| Entrez ID | Symbol | Replicates | Species | Organ | Tissue | Adj P-value | Log2FC | Malignancy |
| 56261 | GPCPD1 | CA_HPV_1 | Human | Cervix | CC | 3.87e-02 | 1.52e-01 | 0.0264 |
| 56261 | GPCPD1 | CCI_1 | Human | Cervix | CC | 6.30e-10 | 1.39e+00 | 0.528 |
| 56261 | GPCPD1 | CCI_3 | Human | Cervix | CC | 2.34e-03 | 5.57e-01 | 0.516 |
| 56261 | GPCPD1 | HTA11_99999970781_79442 | Human | Colorectum | MSS | 6.11e-29 | 1.23e+00 | 0.294 |
| 56261 | GPCPD1 | HTA11_99999965104_69814 | Human | Colorectum | MSS | 1.99e-12 | 1.01e+00 | 0.281 |
| 56261 | GPCPD1 | HTA11_99999971662_82457 | Human | Colorectum | MSS | 3.00e-02 | 5.50e-01 | 0.3859 |
| 56261 | GPCPD1 | F007 | Human | Colorectum | FAP | 1.92e-05 | 5.85e-01 | 0.1176 |
| 56261 | GPCPD1 | A002-C-010 | Human | Colorectum | FAP | 1.23e-08 | 4.72e-01 | 0.242 |
| 56261 | GPCPD1 | A001-C-207 | Human | Colorectum | FAP | 5.50e-07 | 5.46e-01 | 0.1278 |
| 56261 | GPCPD1 | A015-C-203 | Human | Colorectum | FAP | 7.39e-25 | 4.75e-01 | -0.1294 |
| 56261 | GPCPD1 | A015-C-204 | Human | Colorectum | FAP | 2.44e-04 | 2.41e-01 | -0.0228 |
| 56261 | GPCPD1 | A002-C-201 | Human | Colorectum | FAP | 2.45e-07 | 2.55e-01 | 0.0324 |
| 56261 | GPCPD1 | A002-C-203 | Human | Colorectum | FAP | 2.10e-10 | 3.97e-01 | 0.2786 |
| 56261 | GPCPD1 | A001-C-119 | Human | Colorectum | FAP | 3.52e-10 | 5.00e-01 | -0.1557 |
| 56261 | GPCPD1 | A001-C-108 | Human | Colorectum | FAP | 3.92e-17 | 5.79e-01 | -0.0272 |
| 56261 | GPCPD1 | A002-C-021 | Human | Colorectum | FAP | 7.44e-20 | 6.60e-01 | 0.1171 |
| 56261 | GPCPD1 | A002-C-205 | Human | Colorectum | FAP | 1.27e-14 | 1.97e-01 | -0.1236 |
| 56261 | GPCPD1 | A001-C-104 | Human | Colorectum | FAP | 9.16e-19 | 6.43e-01 | 0.0184 |
| 56261 | GPCPD1 | A015-C-005 | Human | Colorectum | FAP | 3.79e-02 | -6.54e-02 | -0.0336 |
| 56261 | GPCPD1 | A015-C-006 | Human | Colorectum | FAP | 2.87e-10 | 1.61e-01 | -0.0994 |
| Page: 1 2 3 4 5 6 7 8 |
| Tissue | Expression Dynamics | Abbreviation |
| Cervix |  | CC: Cervix cancer |
| HSIL_HPV: HPV-infected high-grade squamous intraepithelial lesions | ||
| N_HPV: HPV-infected normal cervix | ||
| Colorectum (GSE201348) |  | FAP: Familial adenomatous polyposis |
| CRC: Colorectal cancer | ||
| Colorectum (HTA11) | 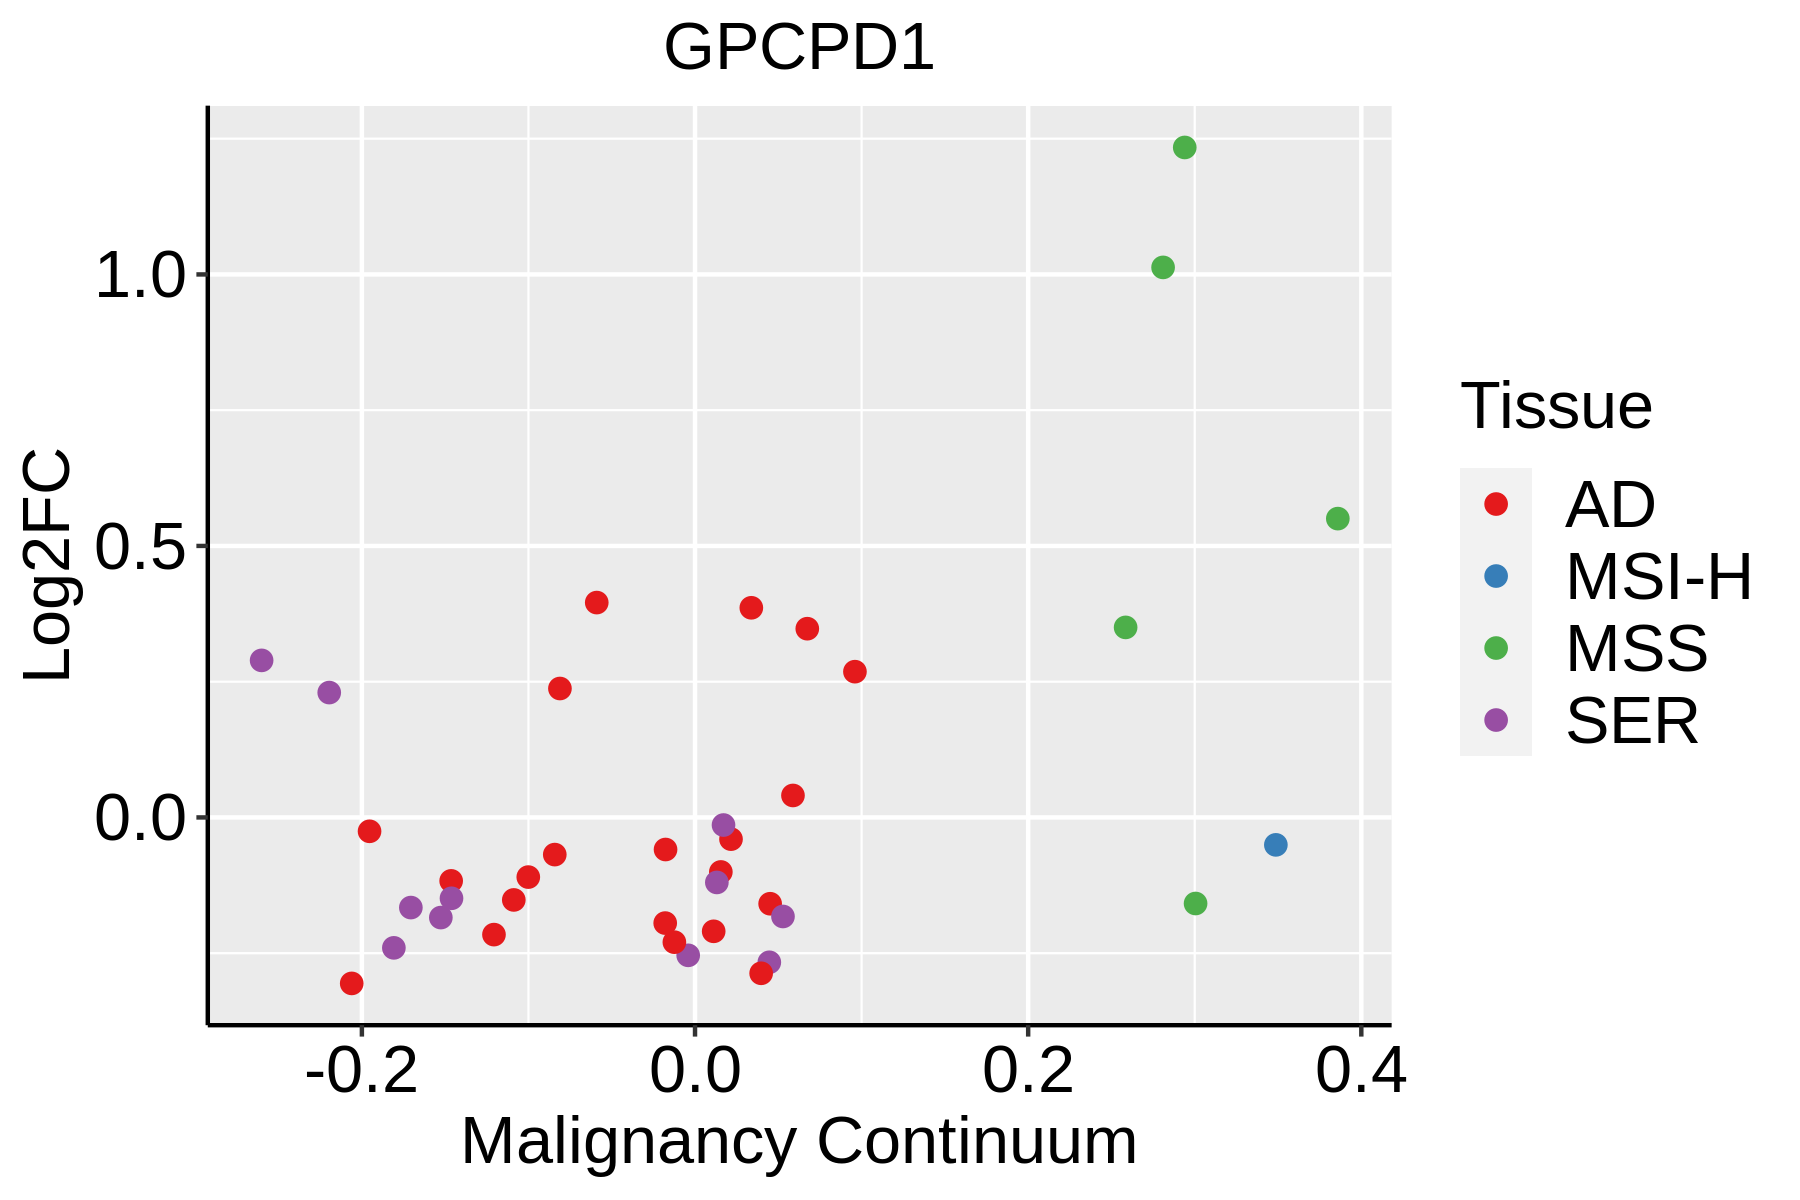 | AD: Adenomas |
| SER: Sessile serrated lesions | ||
| MSI-H: Microsatellite-high colorectal cancer | ||
| MSS: Microsatellite stable colorectal cancer | ||
| Endometrium |  | AEH: Atypical endometrial hyperplasia |
| EEC: Endometrioid Cancer | ||
| Esophagus |  | ESCC: Esophageal squamous cell carcinoma |
| HGIN: High-grade intraepithelial neoplasias | ||
| LGIN: Low-grade intraepithelial neoplasias | ||
| Liver | 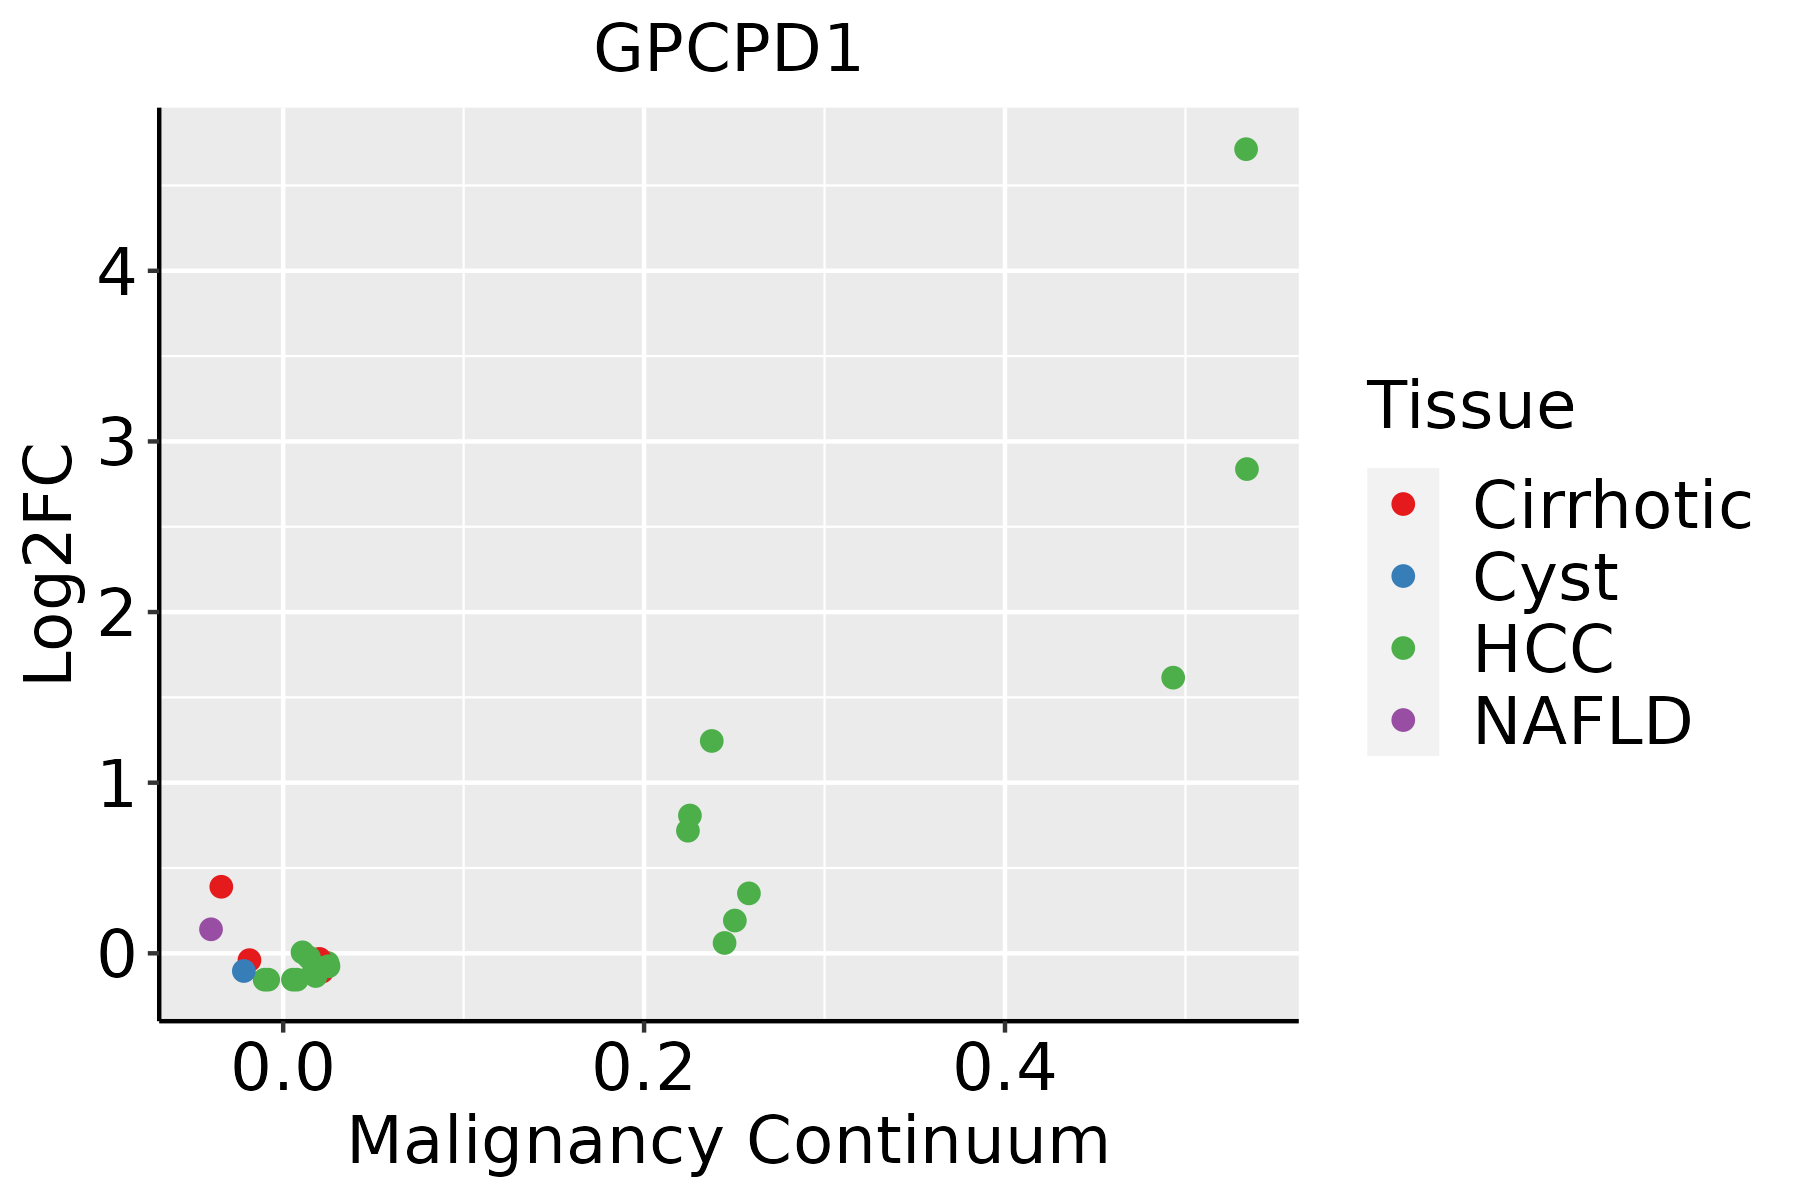 | HCC: Hepatocellular carcinoma |
| NAFLD: Non-alcoholic fatty liver disease | ||
| Lung | 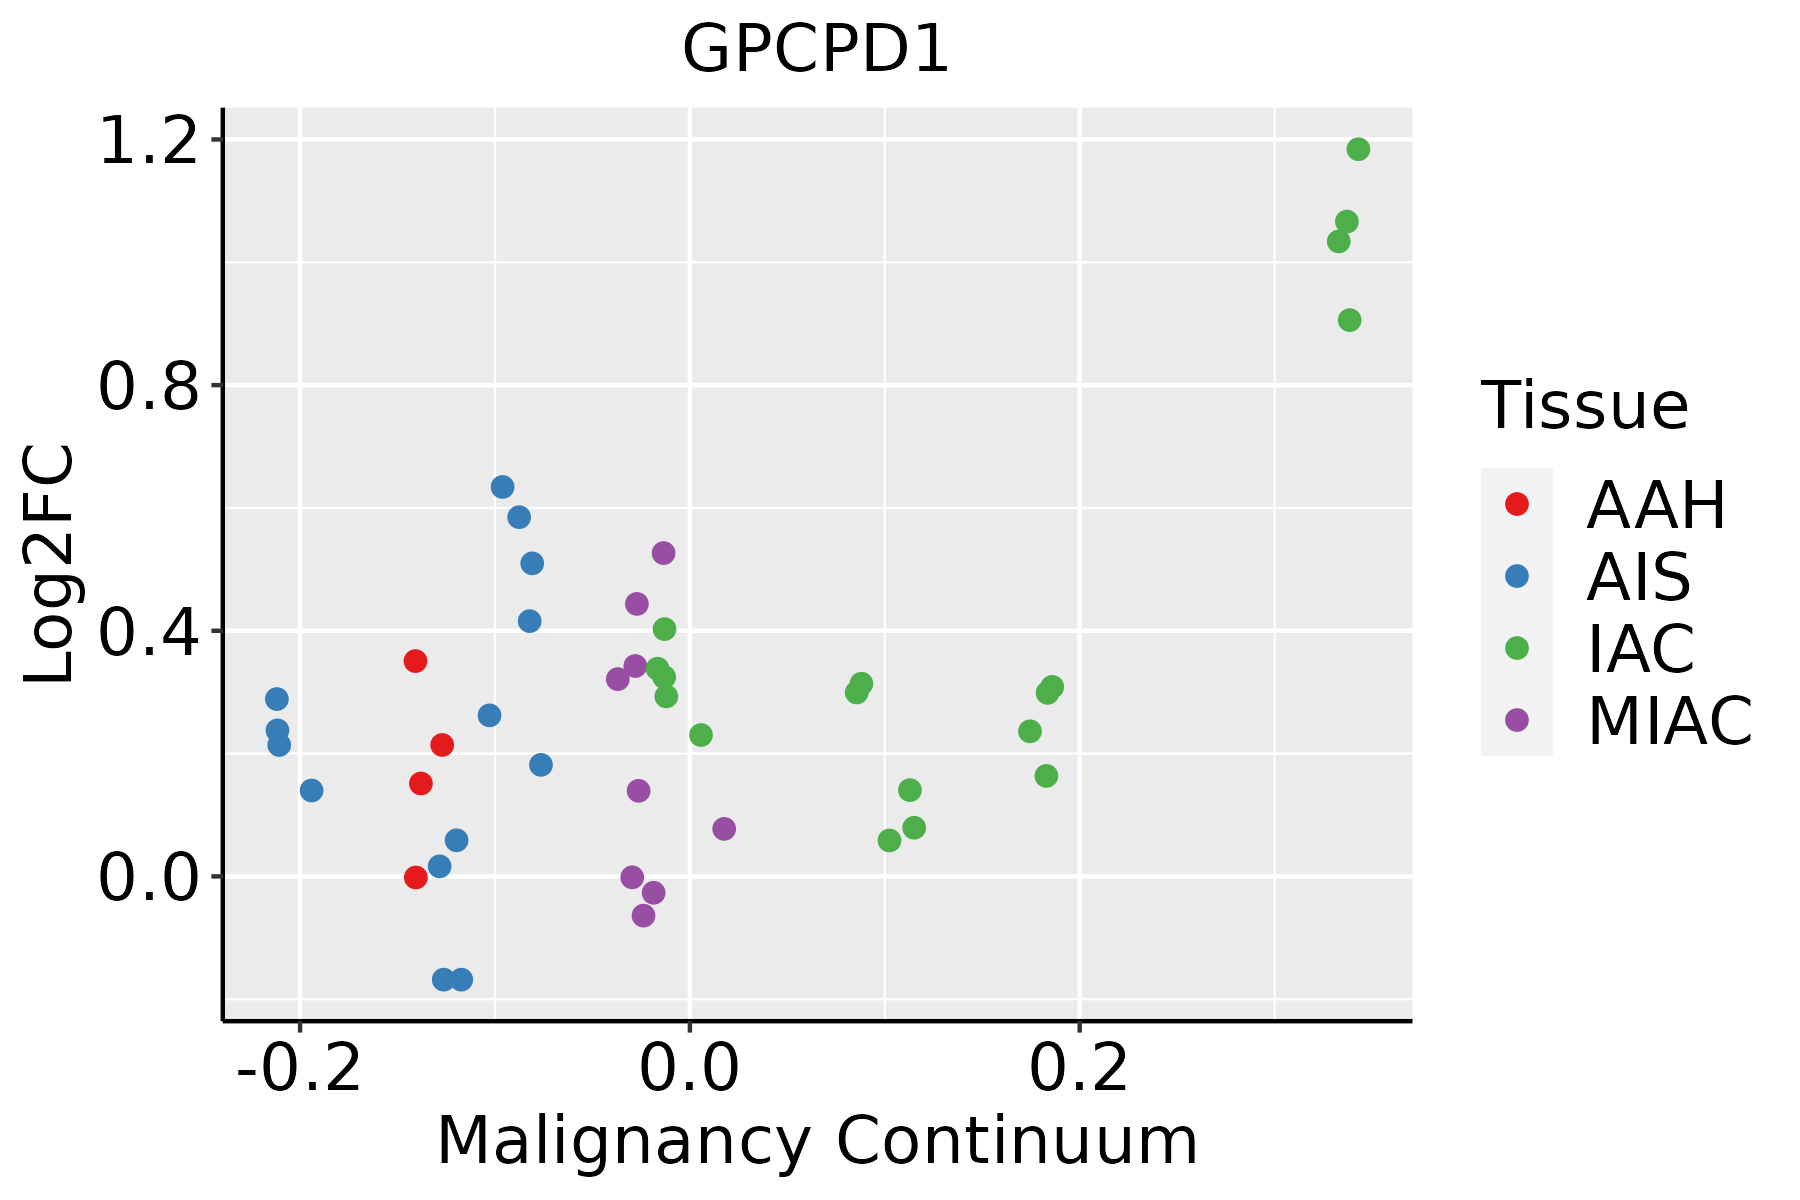 | AAH: Atypical adenomatous hyperplasia |
| AIS: Adenocarcinoma in situ | ||
| IAC: Invasive lung adenocarcinoma | ||
| MIA: Minimally invasive adenocarcinoma | ||
| Oral Cavity | 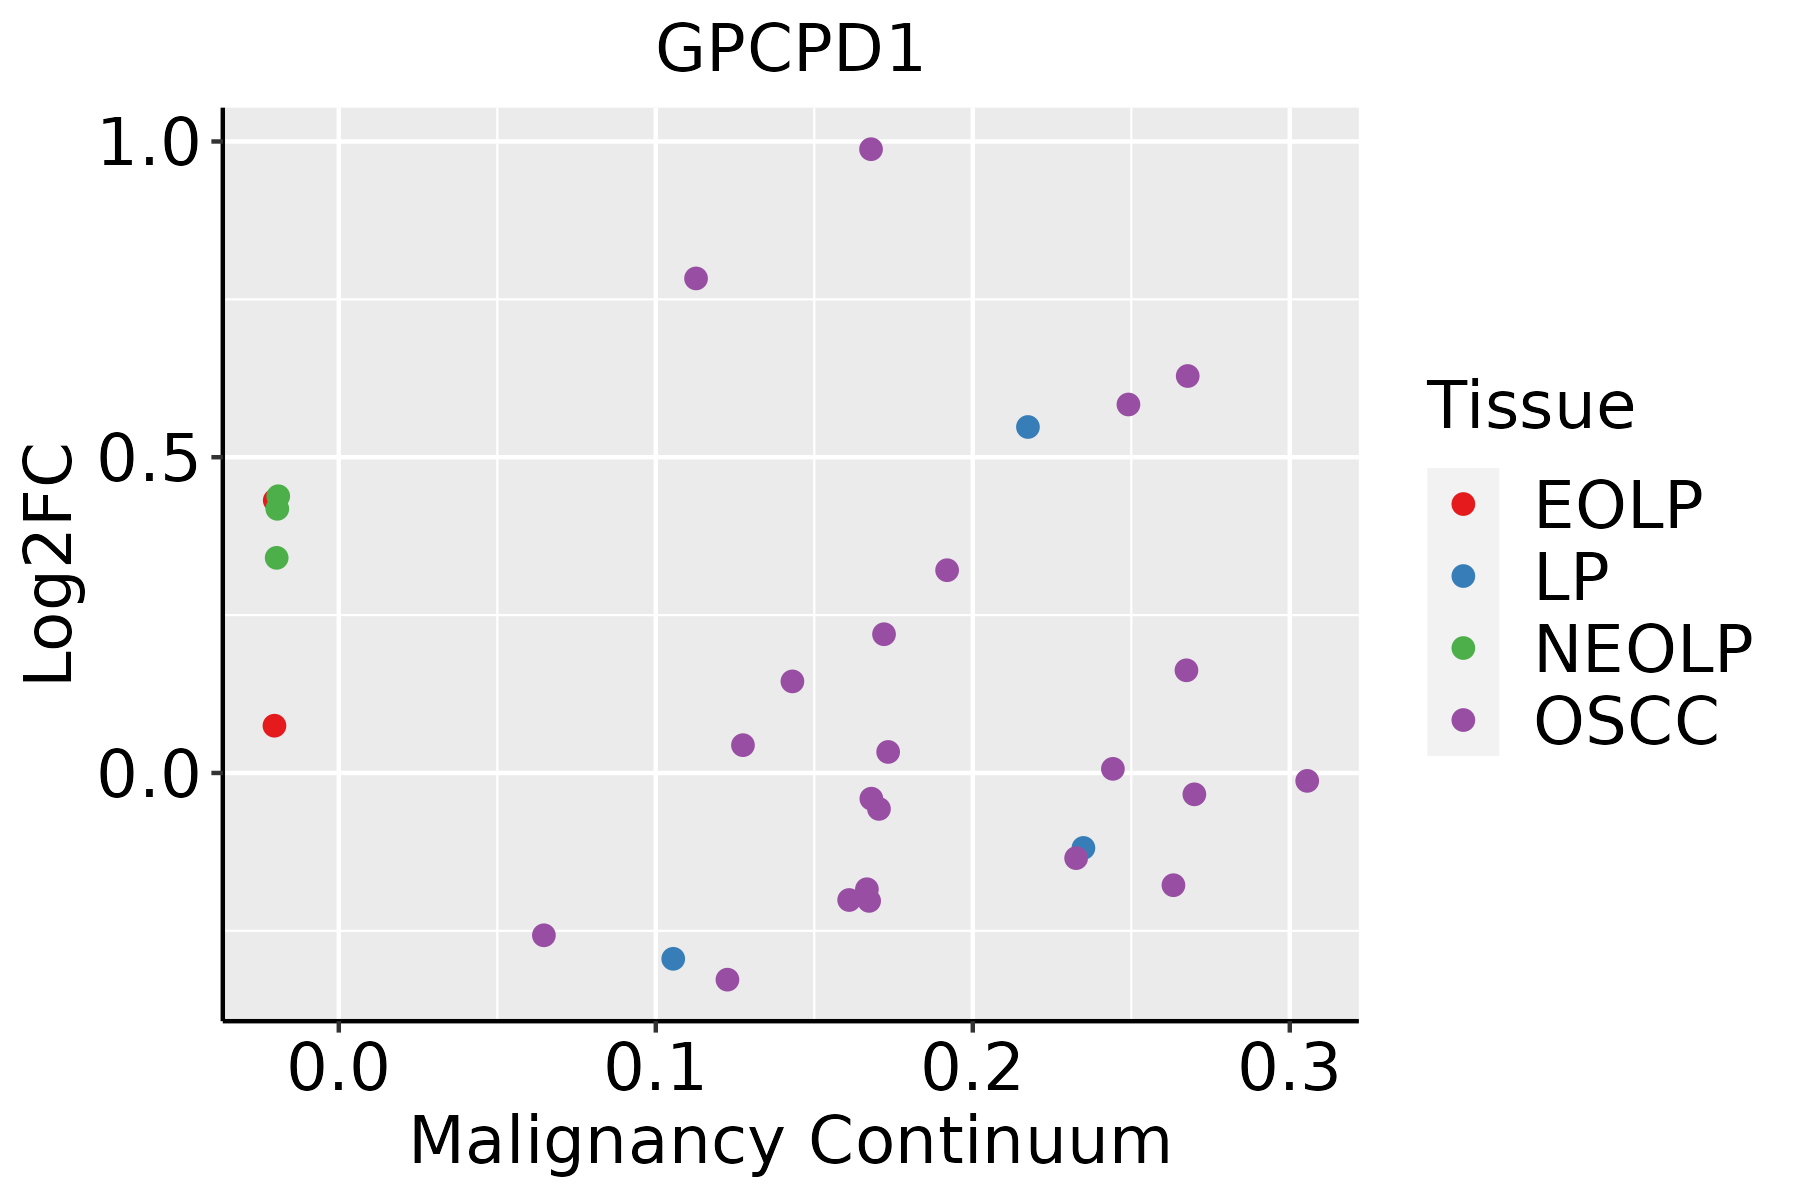 | EOLP: Erosive Oral lichen planus |
| LP: leukoplakia | ||
| NEOLP: Non-erosive oral lichen planus | ||
| OSCC: Oral squamous cell carcinoma | ||
| Prostate | 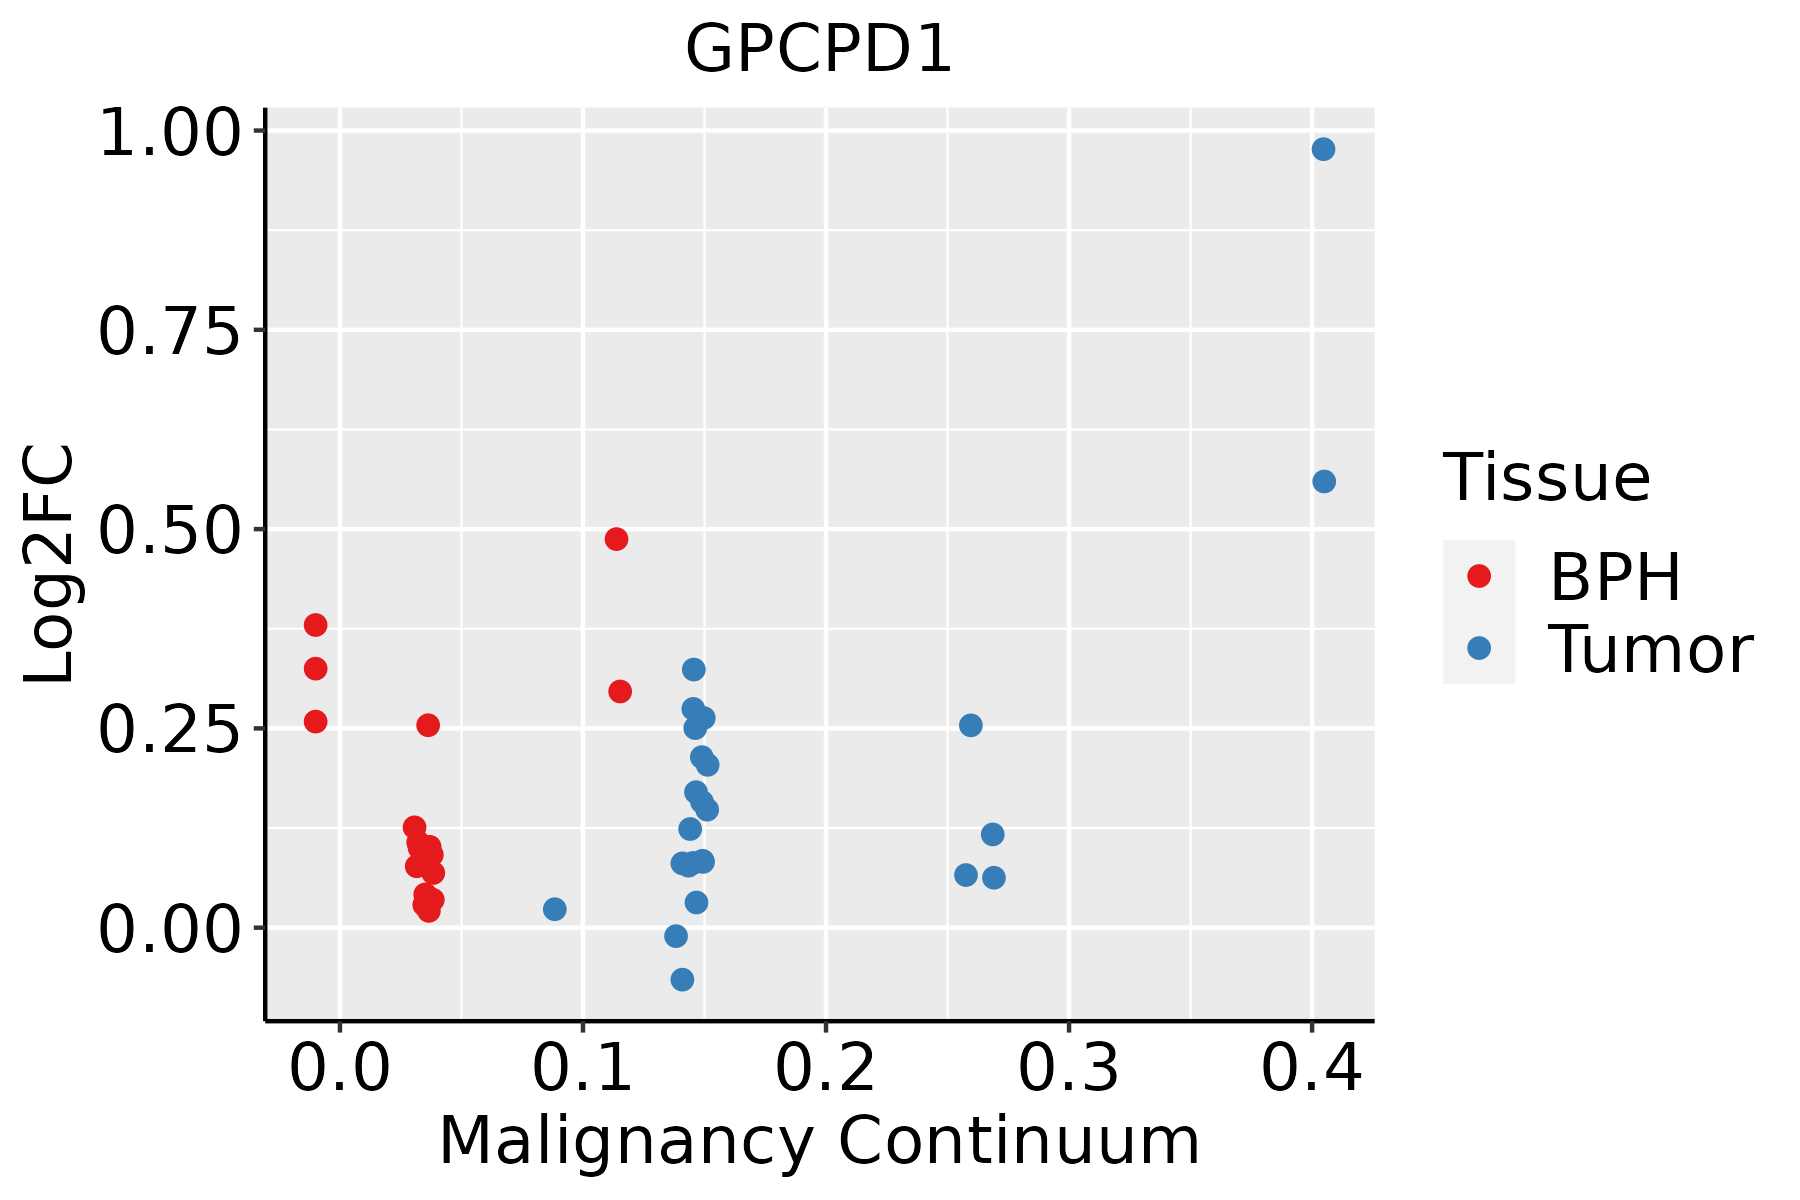 | BPH: Benign Prostatic Hyperplasia |
| Thyroid | 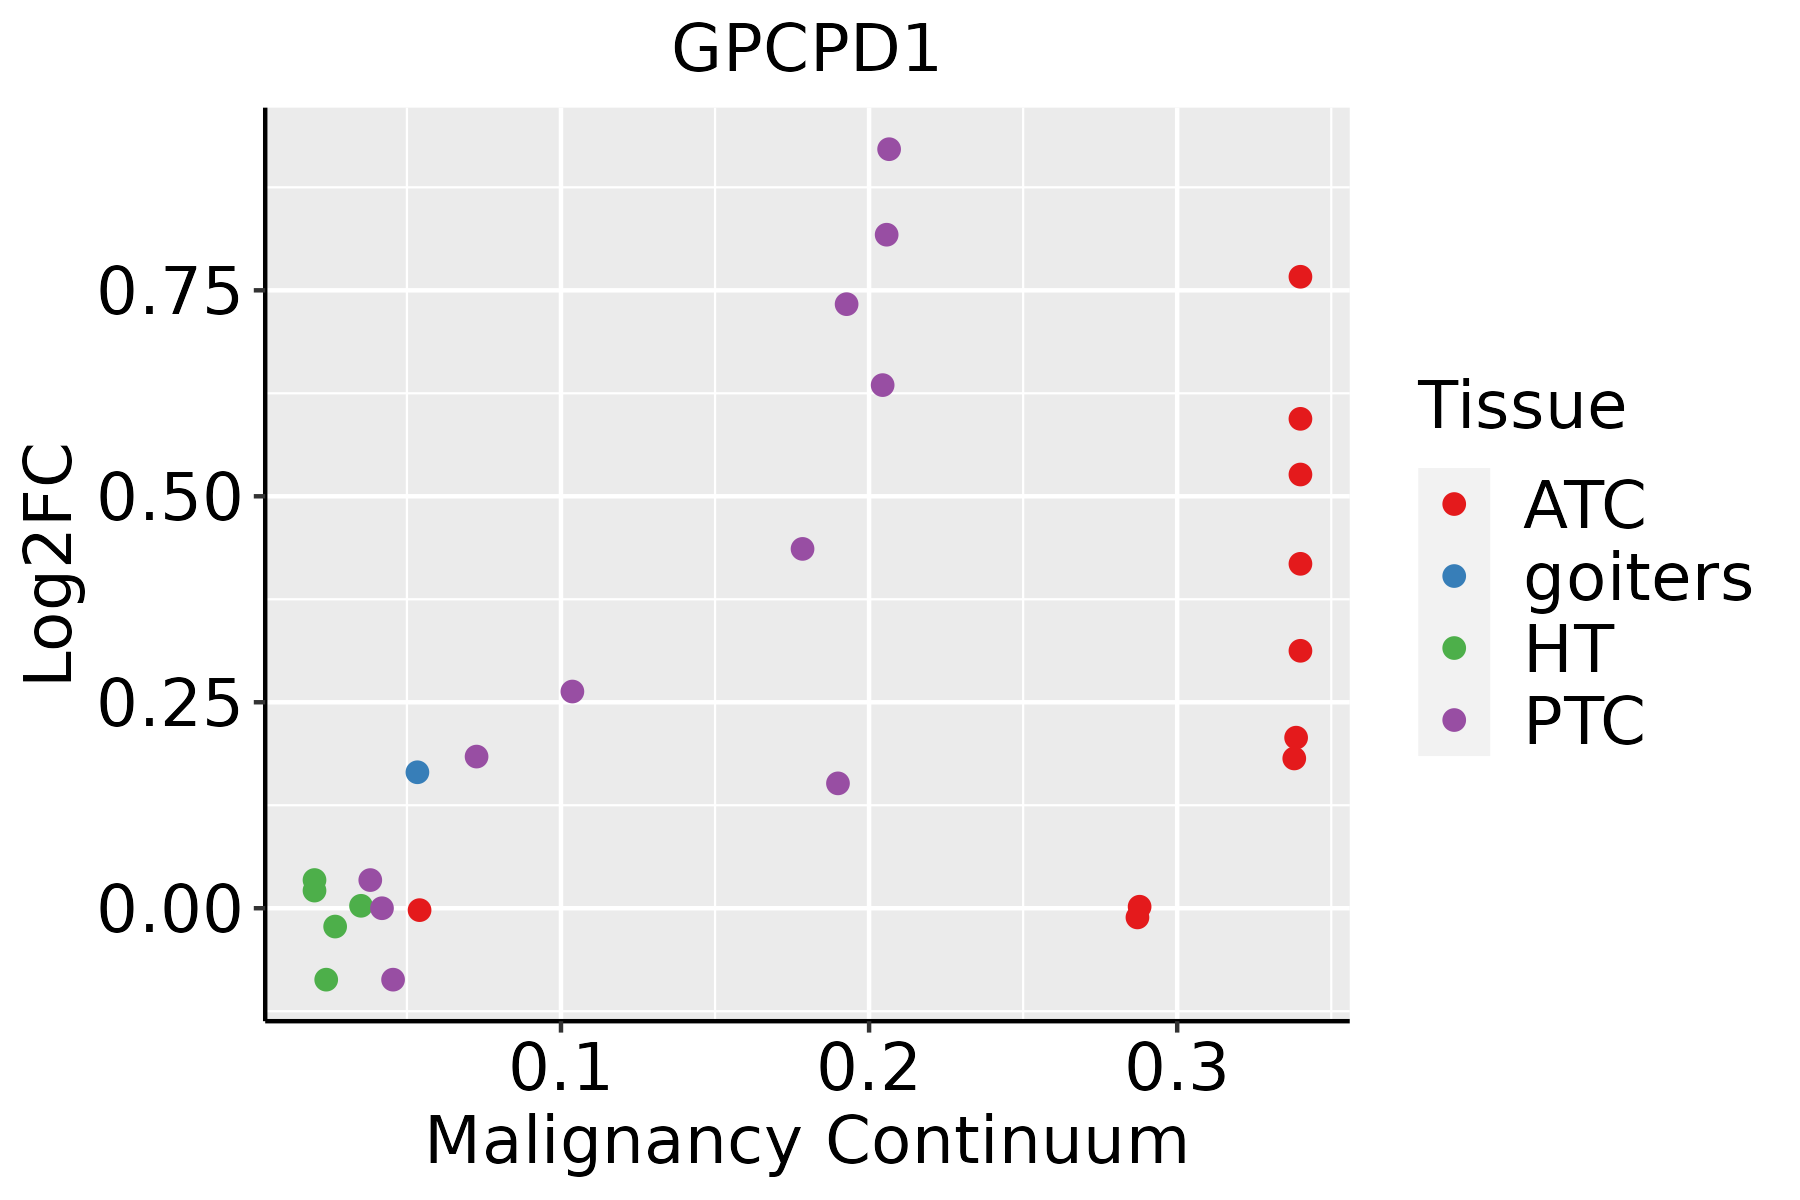 | ATC: Anaplastic thyroid cancer |
| HT: Hashimoto's thyroiditis | ||
| PTC: Papillary thyroid cancer |
| ∗log2FC in expression of this searched gene in stem-like cells from each diseased tissue sample relative to stem-like cells in normal samples in each tissue plotted against the malignancy continuum. Samples are colored based on if they are from different disease stage. |
Top |
Malignant transformation related pathway analysis |
| Find out the enriched GO biological processes and KEGG pathways involved in transition from healthy to precancer to cancer |
| Tissue | Disease Stage | Enriched GO biological Processes |
| Colorectum | AD |  |
| Colorectum | SER |  |
| Colorectum | MSS |  |
| Colorectum | MSI-H |  |
| Colorectum | FAP |  |
| ∗Top 15 enriched GO BP terms are showed in the bar plot of each disease state in each tissue. Each row represents a significant GO biological process which is colored according to the -log10(p.adjust). |
| Page: 1 2 3 4 5 6 7 8 9 |
| GO ID | Tissue | Disease Stage | Description | Gene Ratio | Bg Ratio | pvalue | p.adjust | Count |
| GO:00605375 | Cervix | CC | muscle tissue development | 76/2311 | 403/18723 | 9.76e-05 | 1.27e-03 | 76 |
| GO:00147064 | Cervix | CC | striated muscle tissue development | 72/2311 | 384/18723 | 1.76e-04 | 2.07e-03 | 72 |
| GO:00075173 | Cervix | CC | muscle organ development | 58/2311 | 327/18723 | 2.73e-03 | 1.85e-02 | 58 |
| GO:00075192 | Cervix | CC | skeletal muscle tissue development | 30/2311 | 155/18723 | 7.97e-03 | 4.18e-02 | 30 |
| GO:00160422 | Colorectum | MSS | lipid catabolic process | 77/3467 | 320/18723 | 7.43e-03 | 4.71e-02 | 77 |
| GO:00442422 | Colorectum | FAP | cellular lipid catabolic process | 49/2622 | 214/18723 | 2.87e-04 | 3.77e-03 | 49 |
| GO:00160423 | Colorectum | FAP | lipid catabolic process | 65/2622 | 320/18723 | 1.13e-03 | 1.08e-02 | 65 |
| GO:00066502 | Colorectum | FAP | glycerophospholipid metabolic process | 62/2622 | 306/18723 | 1.54e-03 | 1.38e-02 | 62 |
| GO:00066442 | Colorectum | FAP | phospholipid metabolic process | 74/2622 | 383/18723 | 2.24e-03 | 1.83e-02 | 74 |
| GO:00066503 | Colorectum | CRC | glycerophospholipid metabolic process | 55/2078 | 306/18723 | 2.10e-04 | 3.55e-03 | 55 |
| GO:00066443 | Colorectum | CRC | phospholipid metabolic process | 65/2078 | 383/18723 | 3.21e-04 | 4.95e-03 | 65 |
| GO:00464861 | Colorectum | CRC | glycerolipid metabolic process | 64/2078 | 392/18723 | 1.01e-03 | 1.19e-02 | 64 |
| GO:00160424 | Colorectum | CRC | lipid catabolic process | 53/2078 | 320/18723 | 1.89e-03 | 1.93e-02 | 53 |
| GO:0060537 | Colorectum | CRC | muscle tissue development | 63/2078 | 403/18723 | 3.17e-03 | 2.78e-02 | 63 |
| GO:00442423 | Colorectum | CRC | cellular lipid catabolic process | 37/2078 | 214/18723 | 4.16e-03 | 3.40e-02 | 37 |
| GO:0014706 | Colorectum | CRC | striated muscle tissue development | 59/2078 | 384/18723 | 6.11e-03 | 4.47e-02 | 59 |
| GO:00605376 | Endometrium | AEH | muscle tissue development | 83/2100 | 403/18723 | 2.57e-08 | 1.50e-06 | 83 |
| GO:00147065 | Endometrium | AEH | striated muscle tissue development | 75/2100 | 384/18723 | 1.06e-06 | 3.62e-05 | 75 |
| GO:00075174 | Endometrium | AEH | muscle organ development | 60/2100 | 327/18723 | 8.19e-05 | 1.22e-03 | 60 |
| GO:00605382 | Endometrium | AEH | skeletal muscle organ development | 30/2100 | 166/18723 | 5.64e-03 | 3.46e-02 | 30 |
| Page: 1 2 3 4 |
| Pathway ID | Tissue | Disease Stage | Description | Gene Ratio | Bg Ratio | pvalue | p.adjust | qvalue | Count |
| hsa05231 | Colorectum | MSS | Choline metabolism in cancer | 34/1875 | 98/8465 | 2.90e-03 | 1.39e-02 | 8.50e-03 | 34 |
| hsa052311 | Colorectum | MSS | Choline metabolism in cancer | 34/1875 | 98/8465 | 2.90e-03 | 1.39e-02 | 8.50e-03 | 34 |
| hsa052312 | Colorectum | FAP | Choline metabolism in cancer | 29/1404 | 98/8465 | 9.03e-04 | 5.20e-03 | 3.16e-03 | 29 |
| hsa052313 | Colorectum | FAP | Choline metabolism in cancer | 29/1404 | 98/8465 | 9.03e-04 | 5.20e-03 | 3.16e-03 | 29 |
| hsa052314 | Colorectum | CRC | Choline metabolism in cancer | 24/1091 | 98/8465 | 1.21e-03 | 9.84e-03 | 6.67e-03 | 24 |
| hsa052315 | Colorectum | CRC | Choline metabolism in cancer | 24/1091 | 98/8465 | 1.21e-03 | 9.84e-03 | 6.67e-03 | 24 |
| hsa052319 | Esophagus | ESCC | Choline metabolism in cancer | 61/4205 | 98/8465 | 7.97e-03 | 1.92e-02 | 9.84e-03 | 61 |
| hsa0523114 | Esophagus | ESCC | Choline metabolism in cancer | 61/4205 | 98/8465 | 7.97e-03 | 1.92e-02 | 9.84e-03 | 61 |
| hsa052316 | Liver | HCC | Choline metabolism in cancer | 57/4020 | 98/8465 | 2.14e-02 | 4.90e-02 | 2.72e-02 | 57 |
| hsa0523111 | Liver | HCC | Choline metabolism in cancer | 57/4020 | 98/8465 | 2.14e-02 | 4.90e-02 | 2.72e-02 | 57 |
| hsa052317 | Lung | IAC | Choline metabolism in cancer | 23/1053 | 98/8465 | 1.72e-03 | 9.66e-03 | 6.41e-03 | 23 |
| hsa0523112 | Lung | IAC | Choline metabolism in cancer | 23/1053 | 98/8465 | 1.72e-03 | 9.66e-03 | 6.41e-03 | 23 |
| hsa052318 | Oral cavity | EOLP | Choline metabolism in cancer | 25/1218 | 98/8465 | 2.49e-03 | 8.14e-03 | 4.80e-03 | 25 |
| hsa0523113 | Oral cavity | EOLP | Choline metabolism in cancer | 25/1218 | 98/8465 | 2.49e-03 | 8.14e-03 | 4.80e-03 | 25 |
| hsa0523122 | Oral cavity | NEOLP | Choline metabolism in cancer | 21/1112 | 98/8465 | 1.48e-02 | 4.68e-02 | 2.94e-02 | 21 |
| hsa0523132 | Oral cavity | NEOLP | Choline metabolism in cancer | 21/1112 | 98/8465 | 1.48e-02 | 4.68e-02 | 2.94e-02 | 21 |
| Page: 1 |
Top |
Cell-cell communication analysis |
| Identification of potential cell-cell interactions between two cell types and their ligand-receptor pairs for different disease states |
| Ligand | Receptor | LRpair | Pathway | Tissue | Disease Stage |
| Page: 1 |
Top |
Single-cell gene regulatory network inference analysis |
| Find out the significant the regulons (TFs) and the target genes of each regulon across cell types for different disease states |
| TF | Cell Type | Tissue | Disease Stage | Target Gene | RSS | Regulon Activity |
| ∗The dot plots of a searched regulon are shown for all cell subpopulations in each disease state of each tissue based on the regulon specific score inferred using pySCENIC and by calculating the average expression. |
| Page: 1 |
Top |
Somatic mutation of malignant transformation related genes |
| Annotation of somatic variants for genes involved in malignant transformation |
| Hugo Symbol | Variant Class | Variant Classification | dbSNP RS | HGVSc | HGVSp | HGVSp Short | SWISSPROT | BIOTYPE | SIFT | PolyPhen | Tumor Sample Barcode | Tissue | Histology | Sex | Age | Stage | Therapy Types | Drugs | Outcome |
| GPCPD1 | SNV | Missense_Mutation | c.994A>G | p.Thr332Ala | p.T332A | Q9NPB8 | protein_coding | tolerated(0.39) | benign(0.001) | TCGA-E2-A14W-01 | Breast | breast invasive carcinoma | Male | >=65 | I/II | Chemotherapy | cytoxan | SD | |
| GPCPD1 | insertion | Frame_Shift_Ins | novel | c.915_916insGTAAATAATA | p.Lys306ValfsTer35 | p.K306Vfs*35 | Q9NPB8 | protein_coding | TCGA-AC-A3QQ-01 | Breast | breast invasive carcinoma | Female | <65 | I/II | Unknown | Unknown | SD | ||
| GPCPD1 | SNV | Missense_Mutation | novel | c.280N>G | p.Leu94Val | p.L94V | Q9NPB8 | protein_coding | tolerated(0.22) | benign(0.136) | TCGA-VS-A9UB-01 | Cervix | cervical & endocervical cancer | Female | <65 | I/II | Chemotherapy | cisplatin | CR |
| GPCPD1 | SNV | Missense_Mutation | novel | c.1717C>G | p.Gln573Glu | p.Q573E | Q9NPB8 | protein_coding | tolerated(0.9) | benign(0) | TCGA-VS-A9UH-01 | Cervix | cervical & endocervical cancer | Female | <65 | I/II | Chemotherapy | cisplatin | CR |
| GPCPD1 | insertion | Frame_Shift_Ins | novel | c.462_463insA | p.Ser155IlefsTer2 | p.S155Ifs*2 | Q9NPB8 | protein_coding | TCGA-ZJ-AAXB-01 | Cervix | cervical & endocervical cancer | Female | <65 | I/II | Unknown | Unknown | SD | ||
| GPCPD1 | SNV | Missense_Mutation | c.767N>A | p.Cys256Tyr | p.C256Y | Q9NPB8 | protein_coding | tolerated(0.66) | possibly_damaging(0.804) | TCGA-AA-3672-01 | Colorectum | colon adenocarcinoma | Female | >=65 | III/IV | Unknown | Unknown | SD | |
| GPCPD1 | SNV | Missense_Mutation | c.447G>T | p.Lys149Asn | p.K149N | Q9NPB8 | protein_coding | tolerated(0.07) | probably_damaging(0.994) | TCGA-AA-3984-01 | Colorectum | colon adenocarcinoma | Female | <65 | I/II | Unknown | Unknown | SD | |
| GPCPD1 | SNV | Missense_Mutation | c.259G>T | p.Val87Phe | p.V87F | Q9NPB8 | protein_coding | deleterious(0) | possibly_damaging(0.814) | TCGA-AA-A010-01 | Colorectum | colon adenocarcinoma | Female | <65 | I/II | Chemotherapy | folinic | CR | |
| GPCPD1 | SNV | Missense_Mutation | rs748581132 | c.662N>T | p.Thr221Met | p.T221M | Q9NPB8 | protein_coding | tolerated(0.07) | probably_damaging(0.974) | TCGA-AA-A01R-01 | Colorectum | colon adenocarcinoma | Male | <65 | III/IV | Chemotherapy | 5-fluorouracil | PD |
| GPCPD1 | SNV | Missense_Mutation | c.1955N>T | p.Ser652Phe | p.S652F | Q9NPB8 | protein_coding | deleterious(0.03) | benign(0.055) | TCGA-CA-6718-01 | Colorectum | colon adenocarcinoma | Male | <65 | I/II | Unknown | Unknown | PD |
| Page: 1 2 3 4 5 |
Top |
Related drugs of malignant transformation related genes |
| Identification of chemicals and drugs interact with genes involved in malignant transfromation |
| (DGIdb 4.0) |
| Entrez ID | Symbol | Category | Interaction Types | Drug Claim Name | Drug Name | PMIDs |
| Page: 1 |

Copyright 2023-Present -The University of Texas Health Science Center at Houston |