
|
|||||
|
 | |
| |
| |
| |
| |
| |
|
Gene: GPC6 |
Gene summary for GPC6 |
| Gene information | Species | Human | Gene symbol | GPC6 | Gene ID | 10082 |
| Gene name | glypican 6 | |
| Gene Alias | OMIMD1 | |
| Cytomap | 13q31.3-q32.1 | |
| Gene Type | protein-coding | GO ID | GO:0001736 | UniProtAcc | Q9Y625 |
Top |
Malignant transformation analysis |
| Identification of the aberrant gene expression in precancerous and cancerous lesions by comparing the gene expression of stem-like cells in diseased tissues with normal stem cells |
| Entrez ID | Symbol | Replicates | Species | Organ | Tissue | Adj P-value | Log2FC | Malignancy |
| 10082 | GPC6 | AEH-subject2 | Human | Endometrium | AEH | 1.87e-05 | 2.94e-02 | -0.2525 |
| 10082 | GPC6 | EEC-subject1 | Human | Endometrium | EEC | 4.64e-21 | 6.59e-01 | -0.2682 |
| 10082 | GPC6 | EEC-subject3 | Human | Endometrium | EEC | 5.16e-21 | 6.62e-01 | -0.2525 |
| 10082 | GPC6 | EEC-subject4 | Human | Endometrium | EEC | 2.21e-05 | -7.47e-02 | -0.2571 |
| 10082 | GPC6 | EEC-subject5 | Human | Endometrium | EEC | 3.99e-02 | 1.99e-02 | -0.249 |
| 10082 | GPC6 | GSM6177620_NYU_UCEC1_lib1_lib1 | Human | Endometrium | EEC | 1.85e-05 | -2.60e-02 | -0.1869 |
| 10082 | GPC6 | GSM6177620_NYU_UCEC1_lib2_lib2 | Human | Endometrium | EEC | 1.80e-05 | -8.85e-02 | -0.1875 |
| 10082 | GPC6 | GSM6177620_NYU_UCEC1_lib3_lib3 | Human | Endometrium | EEC | 2.28e-03 | -9.98e-02 | -0.1883 |
| 10082 | GPC6 | GSM6177621_NYU_UCEC2_lib1_lib1 | Human | Endometrium | EEC | 1.59e-02 | 5.48e-02 | -0.1934 |
| 10082 | GPC6 | GSM6177622_NYU_UCEC3_lib1_lib1 | Human | Endometrium | EEC | 1.30e-04 | -4.79e-02 | -0.1917 |
| 10082 | GPC6 | GSM6177622_NYU_UCEC3_lib2_lib2 | Human | Endometrium | EEC | 1.07e-09 | -3.51e-02 | -0.1916 |
| 10082 | GPC6 | NAFLD1 | Human | Liver | NAFLD | 4.58e-16 | 1.61e+00 | -0.04 |
| 10082 | GPC6 | S41 | Human | Liver | Cirrhotic | 1.52e-03 | 7.14e-01 | -0.0343 |
| 10082 | GPC6 | HCC1_Meng | Human | Liver | HCC | 2.38e-98 | -1.85e-01 | 0.0246 |
| 10082 | GPC6 | HCC2_Meng | Human | Liver | HCC | 4.58e-11 | -4.35e-01 | 0.0107 |
| 10082 | GPC6 | cirrhotic1 | Human | Liver | Cirrhotic | 3.58e-12 | -3.32e-01 | 0.0202 |
| 10082 | GPC6 | cirrhotic2 | Human | Liver | Cirrhotic | 7.08e-12 | -3.55e-01 | 0.0201 |
| 10082 | GPC6 | cirrhotic3 | Human | Liver | Cirrhotic | 9.63e-07 | -3.47e-01 | 0.0215 |
| 10082 | GPC6 | HCC2 | Human | Liver | HCC | 1.67e-05 | 2.21e+00 | 0.5341 |
| 10082 | GPC6 | Pt13.a | Human | Liver | HCC | 3.49e-10 | -3.41e-01 | 0.021 |
| Page: 1 2 3 |
| Tissue | Expression Dynamics | Abbreviation |
| Endometrium |  | AEH: Atypical endometrial hyperplasia |
| EEC: Endometrioid Cancer | ||
| Liver | 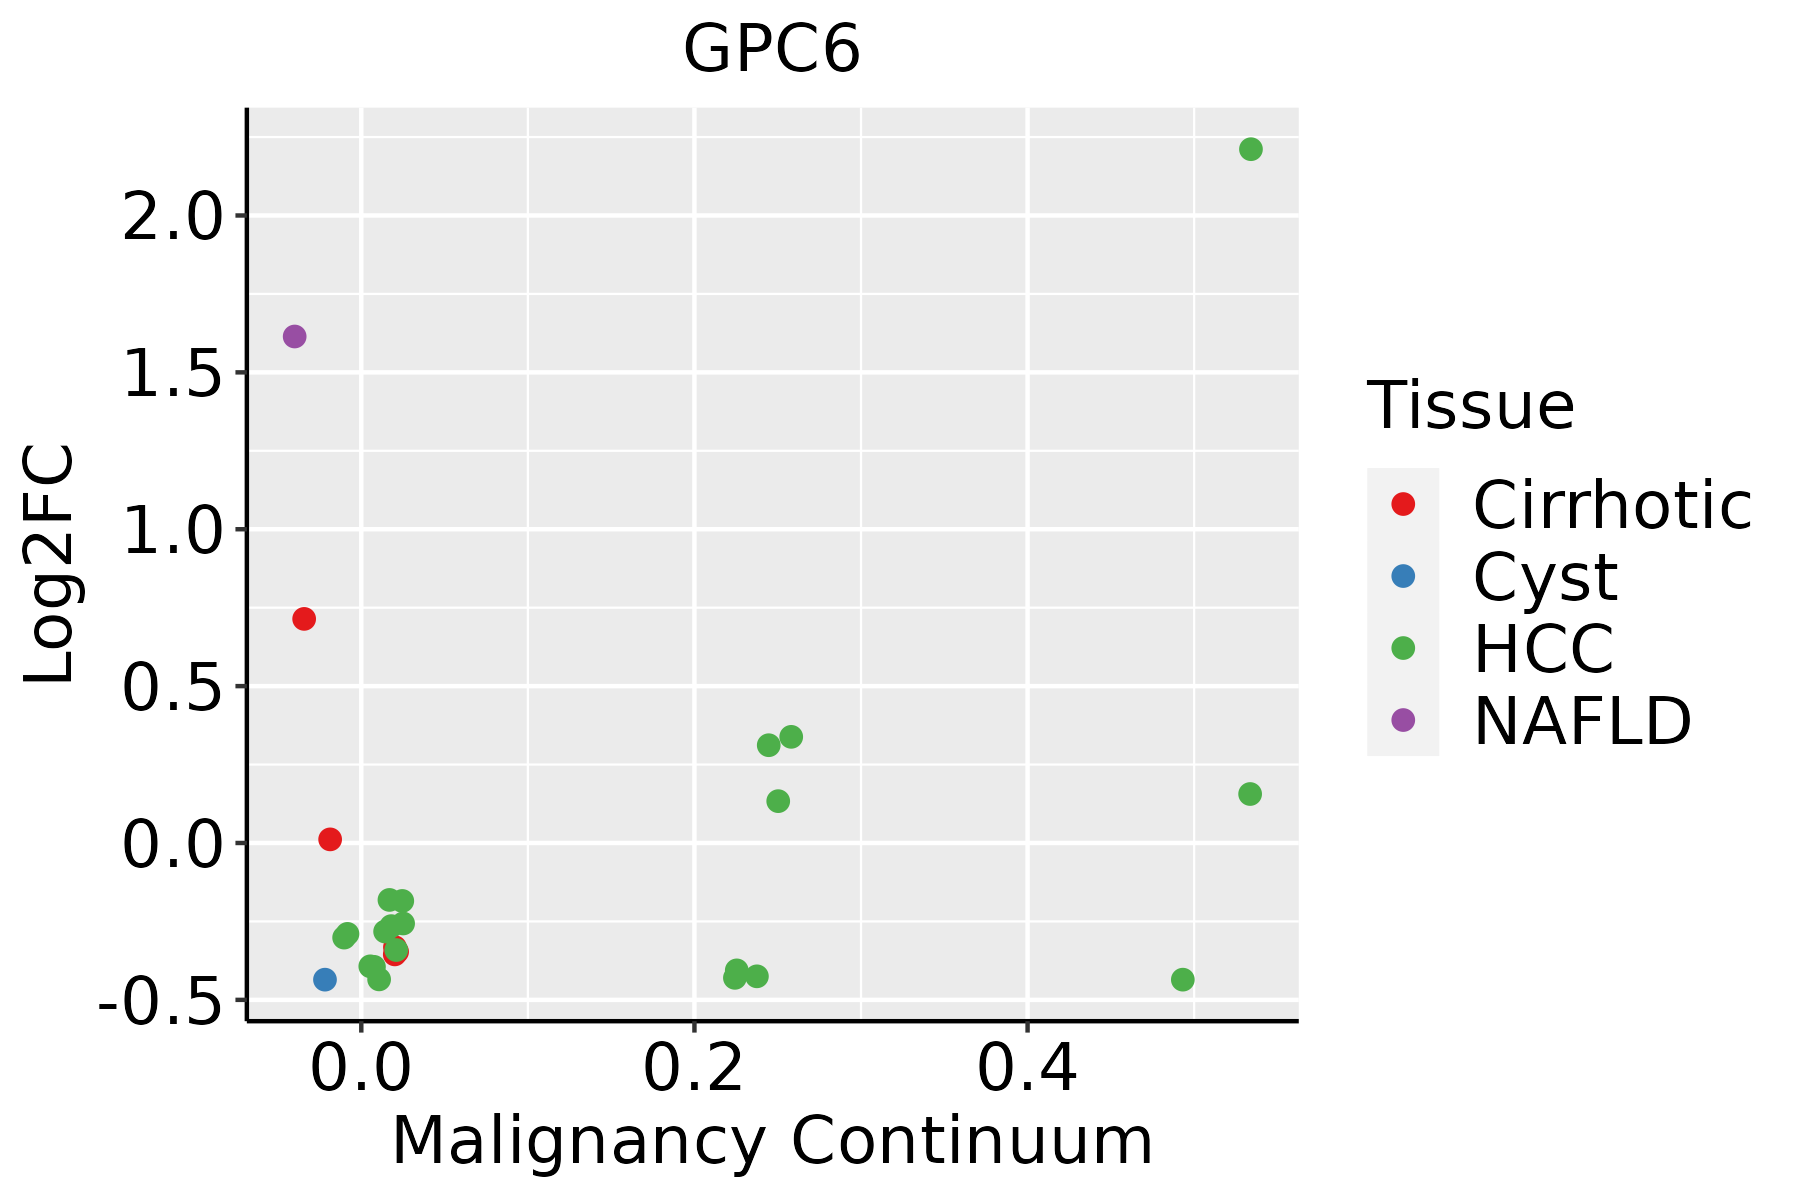 | HCC: Hepatocellular carcinoma |
| NAFLD: Non-alcoholic fatty liver disease | ||
| Lung |  | AAH: Atypical adenomatous hyperplasia |
| AIS: Adenocarcinoma in situ | ||
| IAC: Invasive lung adenocarcinoma | ||
| MIA: Minimally invasive adenocarcinoma | ||
| Skin |  | AK: Actinic keratosis |
| cSCC: Cutaneous squamous cell carcinoma | ||
| SCCIS:squamous cell carcinoma in situ | ||
| Thyroid | 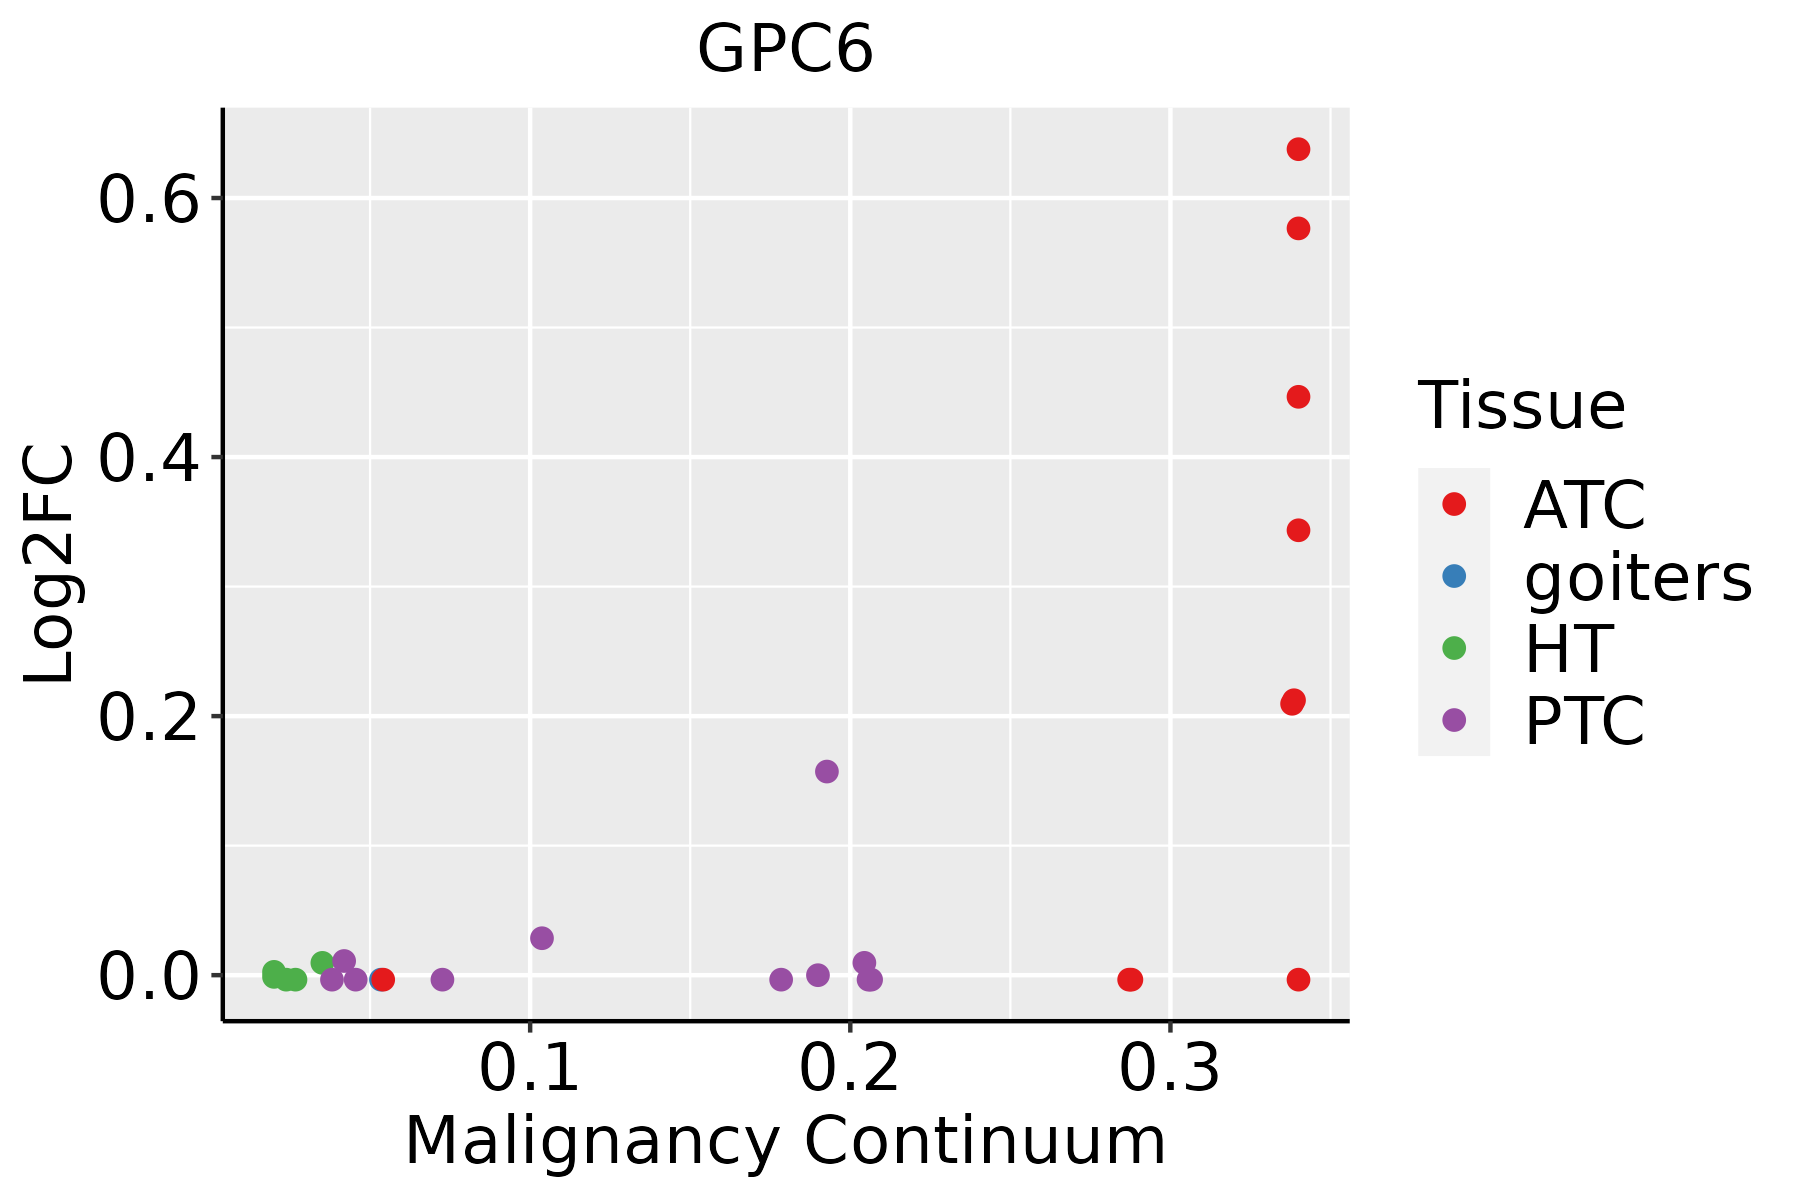 | ATC: Anaplastic thyroid cancer |
| HT: Hashimoto's thyroiditis | ||
| PTC: Papillary thyroid cancer |
| ∗log2FC in expression of this searched gene in stem-like cells from each diseased tissue sample relative to stem-like cells in normal samples in each tissue plotted against the malignancy continuum. Samples are colored based on if they are from different disease stage. |
Top |
Malignant transformation related pathway analysis |
| Find out the enriched GO biological processes and KEGG pathways involved in transition from healthy to precancer to cancer |
| Tissue | Disease Stage | Enriched GO biological Processes |
| Colorectum | AD |  |
| Colorectum | SER |  |
| Colorectum | MSS |  |
| Colorectum | MSI-H |  |
| Colorectum | FAP |  |
| ∗Top 15 enriched GO BP terms are showed in the bar plot of each disease state in each tissue. Each row represents a significant GO biological process which is colored according to the -log10(p.adjust). |
| Page: 1 2 3 4 5 6 7 8 9 |
| GO ID | Tissue | Disease Stage | Description | Gene Ratio | Bg Ratio | pvalue | p.adjust | Count |
| GO:00160558 | Endometrium | AEH | Wnt signaling pathway | 85/2100 | 444/18723 | 4.99e-07 | 1.97e-05 | 85 |
| GO:01987388 | Endometrium | AEH | cell-cell signaling by wnt | 85/2100 | 446/18723 | 6.07e-07 | 2.29e-05 | 85 |
| GO:19907789 | Endometrium | AEH | protein localization to cell periphery | 68/2100 | 333/18723 | 6.38e-07 | 2.38e-05 | 68 |
| GO:00343299 | Endometrium | AEH | cell junction assembly | 78/2100 | 420/18723 | 4.80e-06 | 1.24e-04 | 78 |
| GO:19018887 | Endometrium | AEH | regulation of cell junction assembly | 39/2100 | 204/18723 | 5.94e-04 | 5.86e-03 | 39 |
| GO:19054759 | Endometrium | AEH | regulation of protein localization to membrane | 34/2100 | 175/18723 | 9.62e-04 | 8.75e-03 | 34 |
| GO:00508086 | Endometrium | AEH | synapse organization | 67/2100 | 426/18723 | 2.67e-03 | 1.94e-02 | 67 |
| GO:19043759 | Endometrium | AEH | regulation of protein localization to cell periphery | 25/2100 | 125/18723 | 2.84e-03 | 2.04e-02 | 25 |
| GO:00017385 | Endometrium | AEH | morphogenesis of a polarized epithelium | 20/2100 | 94/18723 | 3.44e-03 | 2.38e-02 | 20 |
| GO:00990725 | Endometrium | AEH | regulation of postsynaptic membrane neurotransmitter receptor levels | 14/2100 | 62/18723 | 7.72e-03 | 4.33e-02 | 14 |
| GO:001605513 | Endometrium | EEC | Wnt signaling pathway | 90/2168 | 444/18723 | 6.65e-08 | 3.50e-06 | 90 |
| GO:019873813 | Endometrium | EEC | cell-cell signaling by wnt | 90/2168 | 446/18723 | 8.25e-08 | 4.23e-06 | 90 |
| GO:199077814 | Endometrium | EEC | protein localization to cell periphery | 69/2168 | 333/18723 | 9.71e-07 | 3.31e-05 | 69 |
| GO:003432914 | Endometrium | EEC | cell junction assembly | 79/2168 | 420/18723 | 8.37e-06 | 1.85e-04 | 79 |
| GO:190547514 | Endometrium | EEC | regulation of protein localization to membrane | 34/2168 | 175/18723 | 1.66e-03 | 1.30e-02 | 34 |
| GO:000173812 | Endometrium | EEC | morphogenesis of a polarized epithelium | 21/2168 | 94/18723 | 2.18e-03 | 1.63e-02 | 21 |
| GO:190188812 | Endometrium | EEC | regulation of cell junction assembly | 37/2168 | 204/18723 | 3.70e-03 | 2.48e-02 | 37 |
| GO:005080812 | Endometrium | EEC | synapse organization | 68/2168 | 426/18723 | 3.73e-03 | 2.49e-02 | 68 |
| GO:190437514 | Endometrium | EEC | regulation of protein localization to cell periphery | 25/2168 | 125/18723 | 4.33e-03 | 2.80e-02 | 25 |
| GO:00600713 | Endometrium | EEC | Wnt signaling pathway, planar cell polarity pathway | 13/2168 | 52/18723 | 5.34e-03 | 3.31e-02 | 13 |
| Page: 1 2 3 4 5 6 7 |
| Pathway ID | Tissue | Disease Stage | Description | Gene Ratio | Bg Ratio | pvalue | p.adjust | qvalue | Count |
| Page: 1 |
Top |
Cell-cell communication analysis |
| Identification of potential cell-cell interactions between two cell types and their ligand-receptor pairs for different disease states |
| Ligand | Receptor | LRpair | Pathway | Tissue | Disease Stage |
| Page: 1 |
Top |
Single-cell gene regulatory network inference analysis |
| Find out the significant the regulons (TFs) and the target genes of each regulon across cell types for different disease states |
| TF | Cell Type | Tissue | Disease Stage | Target Gene | RSS | Regulon Activity |
| ∗The dot plots of a searched regulon are shown for all cell subpopulations in each disease state of each tissue based on the regulon specific score inferred using pySCENIC and by calculating the average expression. |
| Page: 1 |
Top |
Somatic mutation of malignant transformation related genes |
| Annotation of somatic variants for genes involved in malignant transformation |
| Hugo Symbol | Variant Class | Variant Classification | dbSNP RS | HGVSc | HGVSp | HGVSp Short | SWISSPROT | BIOTYPE | SIFT | PolyPhen | Tumor Sample Barcode | Tissue | Histology | Sex | Age | Stage | Therapy Types | Drugs | Outcome |
| GPC6 | SNV | Missense_Mutation | c.146A>T | p.Tyr49Phe | p.Y49F | Q9Y625 | protein_coding | tolerated(0.7) | benign(0.007) | TCGA-A2-A0YT-01 | Breast | breast invasive carcinoma | Female | <65 | III/IV | Hormone Therapy | arimidex | SD | |
| GPC6 | SNV | Missense_Mutation | rs201329039 | c.853N>A | p.Asp285Asn | p.D285N | Q9Y625 | protein_coding | tolerated(0.12) | possibly_damaging(0.779) | TCGA-AN-A046-01 | Breast | breast invasive carcinoma | Female | >=65 | I/II | Unknown | Unknown | SD |
| GPC6 | SNV | Missense_Mutation | novel | c.1586N>A | p.Ser529Tyr | p.S529Y | Q9Y625 | protein_coding | deleterious(0.04) | benign(0.232) | TCGA-AN-A046-01 | Breast | breast invasive carcinoma | Female | >=65 | I/II | Unknown | Unknown | SD |
| GPC6 | SNV | Missense_Mutation | c.286N>G | p.Thr96Ala | p.T96A | Q9Y625 | protein_coding | tolerated(1) | benign(0.006) | TCGA-AN-A0FV-01 | Breast | breast invasive carcinoma | Female | <65 | I/II | Unknown | Unknown | SD | |
| GPC6 | SNV | Missense_Mutation | c.553N>A | p.Asp185Asn | p.D185N | Q9Y625 | protein_coding | deleterious(0.01) | possibly_damaging(0.643) | TCGA-AN-A0FY-01 | Breast | breast invasive carcinoma | Female | <65 | I/II | Unknown | Unknown | SD | |
| GPC6 | SNV | Missense_Mutation | novel | c.1052G>C | p.Arg351Thr | p.R351T | Q9Y625 | protein_coding | deleterious(0.05) | possibly_damaging(0.772) | TCGA-BH-A0B6-01 | Breast | breast invasive carcinoma | Female | <65 | I/II | Unknown | Unknown | SD |
| GPC6 | SNV | Missense_Mutation | c.252N>T | p.Glu84Asp | p.E84D | Q9Y625 | protein_coding | deleterious(0.01) | possibly_damaging(0.596) | TCGA-E2-A1LS-01 | Breast | breast invasive carcinoma | Female | <65 | I/II | Unspecific | Cyclophosphamide | SD | |
| GPC6 | SNV | Missense_Mutation | novel | c.1115N>C | p.Arg372Thr | p.R372T | Q9Y625 | protein_coding | deleterious(0.05) | possibly_damaging(0.456) | TCGA-XX-A89A-01 | Breast | breast invasive carcinoma | Female | >=65 | I/II | Unknown | Unknown | SD |
| GPC6 | SNV | Missense_Mutation | c.1525N>A | p.Glu509Lys | p.E509K | Q9Y625 | protein_coding | tolerated(0.31) | possibly_damaging(0.665) | TCGA-C5-A3HE-01 | Cervix | cervical & endocervical cancer | Female | <65 | I/II | Unknown | Unknown | PD | |
| GPC6 | SNV | Missense_Mutation | c.214N>C | p.Glu72Gln | p.E72Q | Q9Y625 | protein_coding | deleterious(0) | probably_damaging(0.998) | TCGA-C5-A7CH-01 | Cervix | cervical & endocervical cancer | Female | <65 | I/II | Unspecific | SD |
| Page: 1 2 3 4 5 6 7 8 9 10 11 12 |
Top |
Related drugs of malignant transformation related genes |
| Identification of chemicals and drugs interact with genes involved in malignant transfromation |
| (DGIdb 4.0) |
| Entrez ID | Symbol | Category | Interaction Types | Drug Claim Name | Drug Name | PMIDs |
| Page: 1 |

Copyright 2023-Present -The University of Texas Health Science Center at Houston |