
|
|||||
|
 | |
| |
| |
| |
| |
| |
|
Gene: GPC5 |
Gene summary for GPC5 |
| Gene information | Species | Human | Gene symbol | GPC5 | Gene ID | 2262 |
| Gene name | glypican 5 | |
| Gene Alias | GPC5 | |
| Cytomap | 13q31.3 | |
| Gene Type | protein-coding | GO ID | GO:0006928 | UniProtAcc | P78333 |
Top |
Malignant transformation analysis |
| Identification of the aberrant gene expression in precancerous and cancerous lesions by comparing the gene expression of stem-like cells in diseased tissues with normal stem cells |
| Entrez ID | Symbol | Replicates | Species | Organ | Tissue | Adj P-value | Log2FC | Malignancy |
| 2262 | GPC5 | TD9 | Human | Lung | IAC | 2.13e-03 | 6.24e-01 | 0.088 |
| 2262 | GPC5 | RNA-P10T2-P10T2-2 | Human | Lung | AAH | 7.31e-03 | 6.36e-01 | -0.1406 |
| 2262 | GPC5 | RNA-P10T2-P10T2-3 | Human | Lung | AAH | 2.77e-05 | 8.27e-01 | -0.1408 |
| 2262 | GPC5 | RNA-P10T2-P10T2-4 | Human | Lung | AAH | 2.24e-04 | 8.54e-01 | -0.138 |
| 2262 | GPC5 | RNA-P23T2-P23T2-1 | Human | Lung | MIAC | 1.99e-06 | 1.17e+00 | -0.037 |
| 2262 | GPC5 | RNA-P23T2-P23T2-2 | Human | Lung | MIAC | 4.97e-07 | 1.10e+00 | -0.028 |
| 2262 | GPC5 | RNA-P23T2-P23T2-4 | Human | Lung | MIAC | 2.58e-05 | 1.01e+00 | -0.0272 |
| 2262 | GPC5 | RNA-P25T1-P25T1-1 | Human | Lung | AIS | 8.87e-03 | 3.21e-01 | -0.2116 |
| 2262 | GPC5 | RNA-P25T1-P25T1-3 | Human | Lung | AIS | 9.09e-03 | 4.59e-01 | -0.2107 |
| 2262 | GPC5 | RNA-P25T1-P25T1-4 | Human | Lung | AIS | 2.58e-07 | 5.23e-01 | -0.2119 |
| 2262 | GPC5 | RNA-P6T1-P6T1-1 | Human | Lung | MIAC | 9.93e-08 | 1.21e+00 | -0.0238 |
| 2262 | GPC5 | RNA-P6T1-P6T1-2 | Human | Lung | MIAC | 5.44e-06 | 1.21e+00 | -0.0186 |
| 2262 | GPC5 | RNA-P6T1-P6T1-3 | Human | Lung | MIAC | 2.58e-05 | 1.22e+00 | -0.0296 |
| 2262 | GPC5 | RNA-P6T1-P6T1-4 | Human | Lung | MIAC | 9.88e-09 | 1.29e+00 | -0.0263 |
| 2262 | GPC5 | RNA-P7T1-P7T1-1 | Human | Lung | AIS | 1.77e-11 | 1.09e+00 | -0.0961 |
| 2262 | GPC5 | RNA-P7T1-P7T1-2 | Human | Lung | AIS | 3.89e-13 | 1.06e+00 | -0.0876 |
| 2262 | GPC5 | RNA-P7T1-P7T1-3 | Human | Lung | AIS | 1.92e-15 | 1.22e+00 | -0.0822 |
| 2262 | GPC5 | RNA-P7T1-P7T1-4 | Human | Lung | AIS | 2.87e-16 | 1.15e+00 | -0.0809 |
| 2262 | GPC5 | P1_S1_AK | Human | Skin | AK | 1.13e-16 | 5.65e-01 | -0.3399 |
| 2262 | GPC5 | P2_S3_AK | Human | Skin | AK | 1.93e-11 | 3.75e-01 | -0.3287 |
| Page: 1 2 |
| Tissue | Expression Dynamics | Abbreviation |
| Lung | 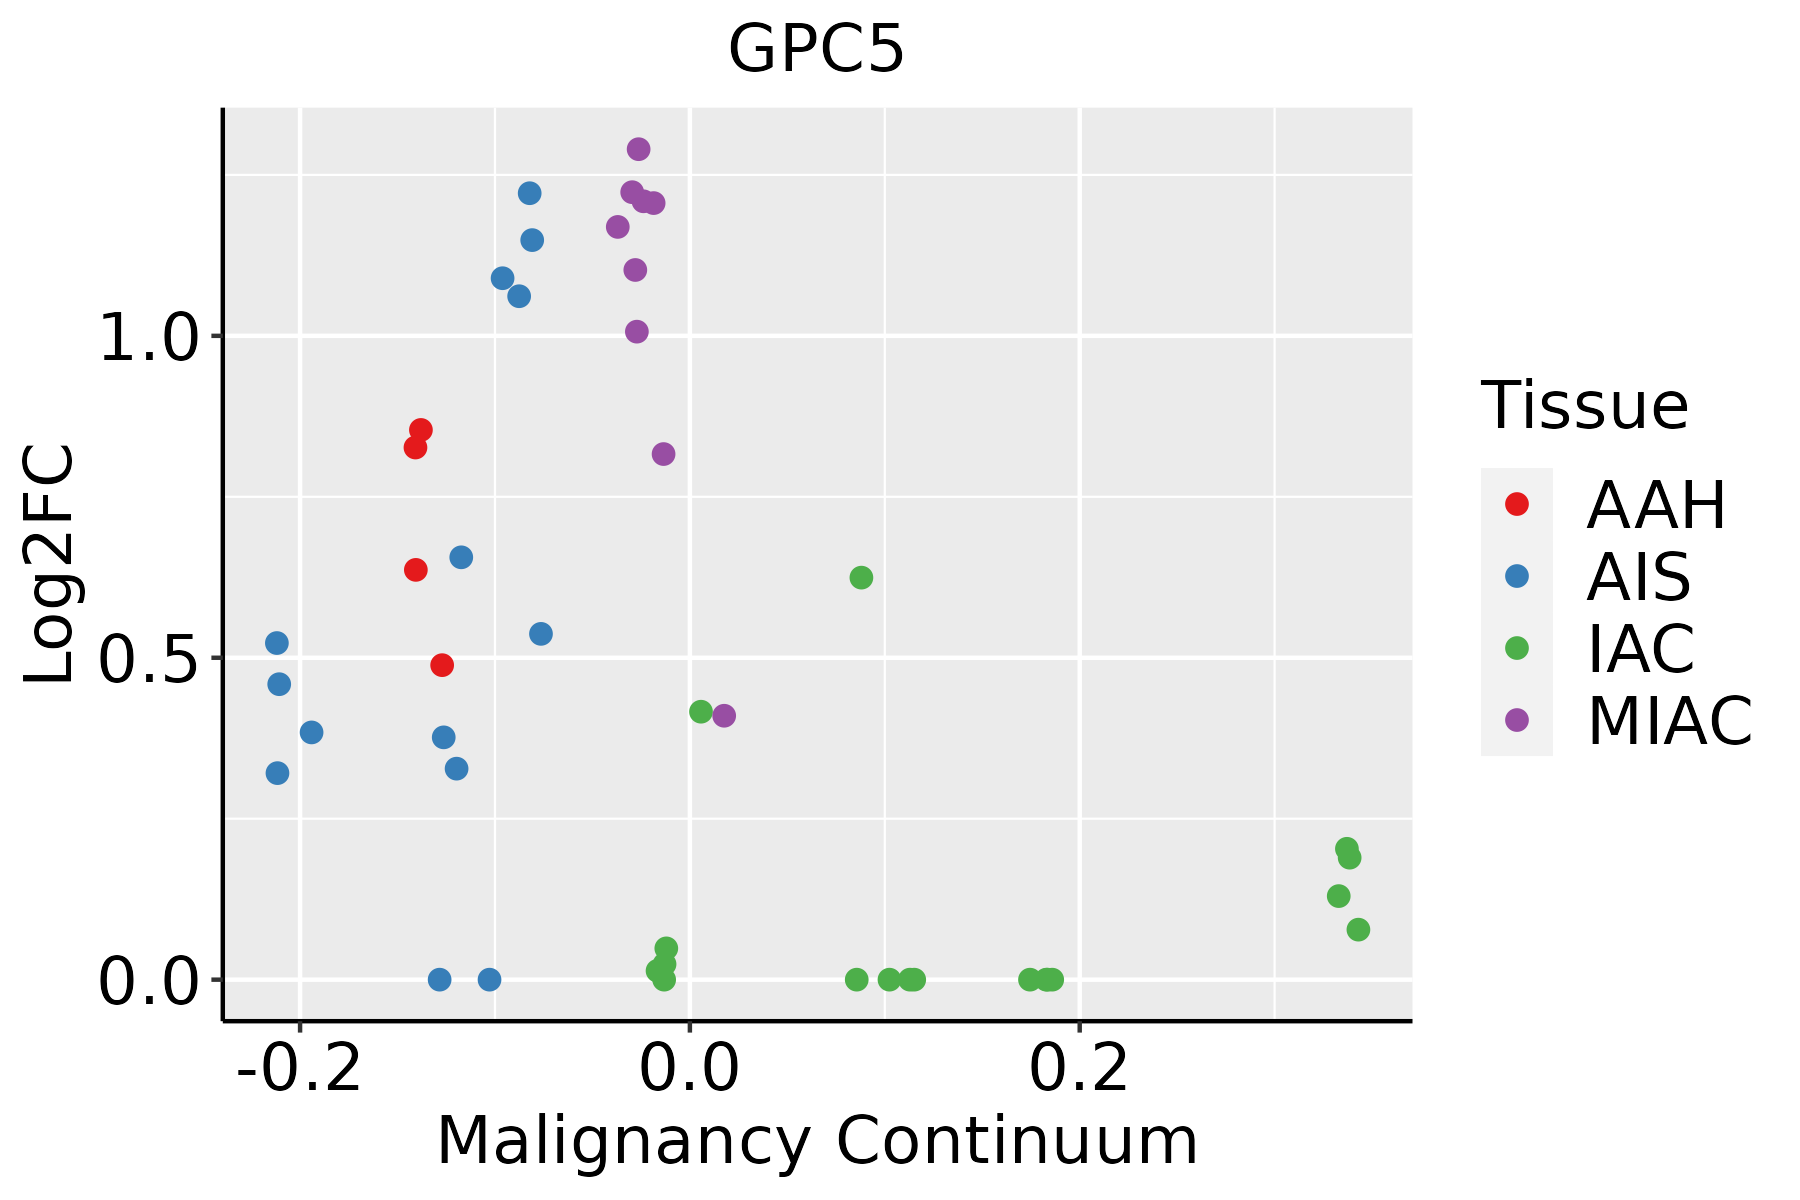 | AAH: Atypical adenomatous hyperplasia |
| AIS: Adenocarcinoma in situ | ||
| IAC: Invasive lung adenocarcinoma | ||
| MIA: Minimally invasive adenocarcinoma | ||
| Skin | 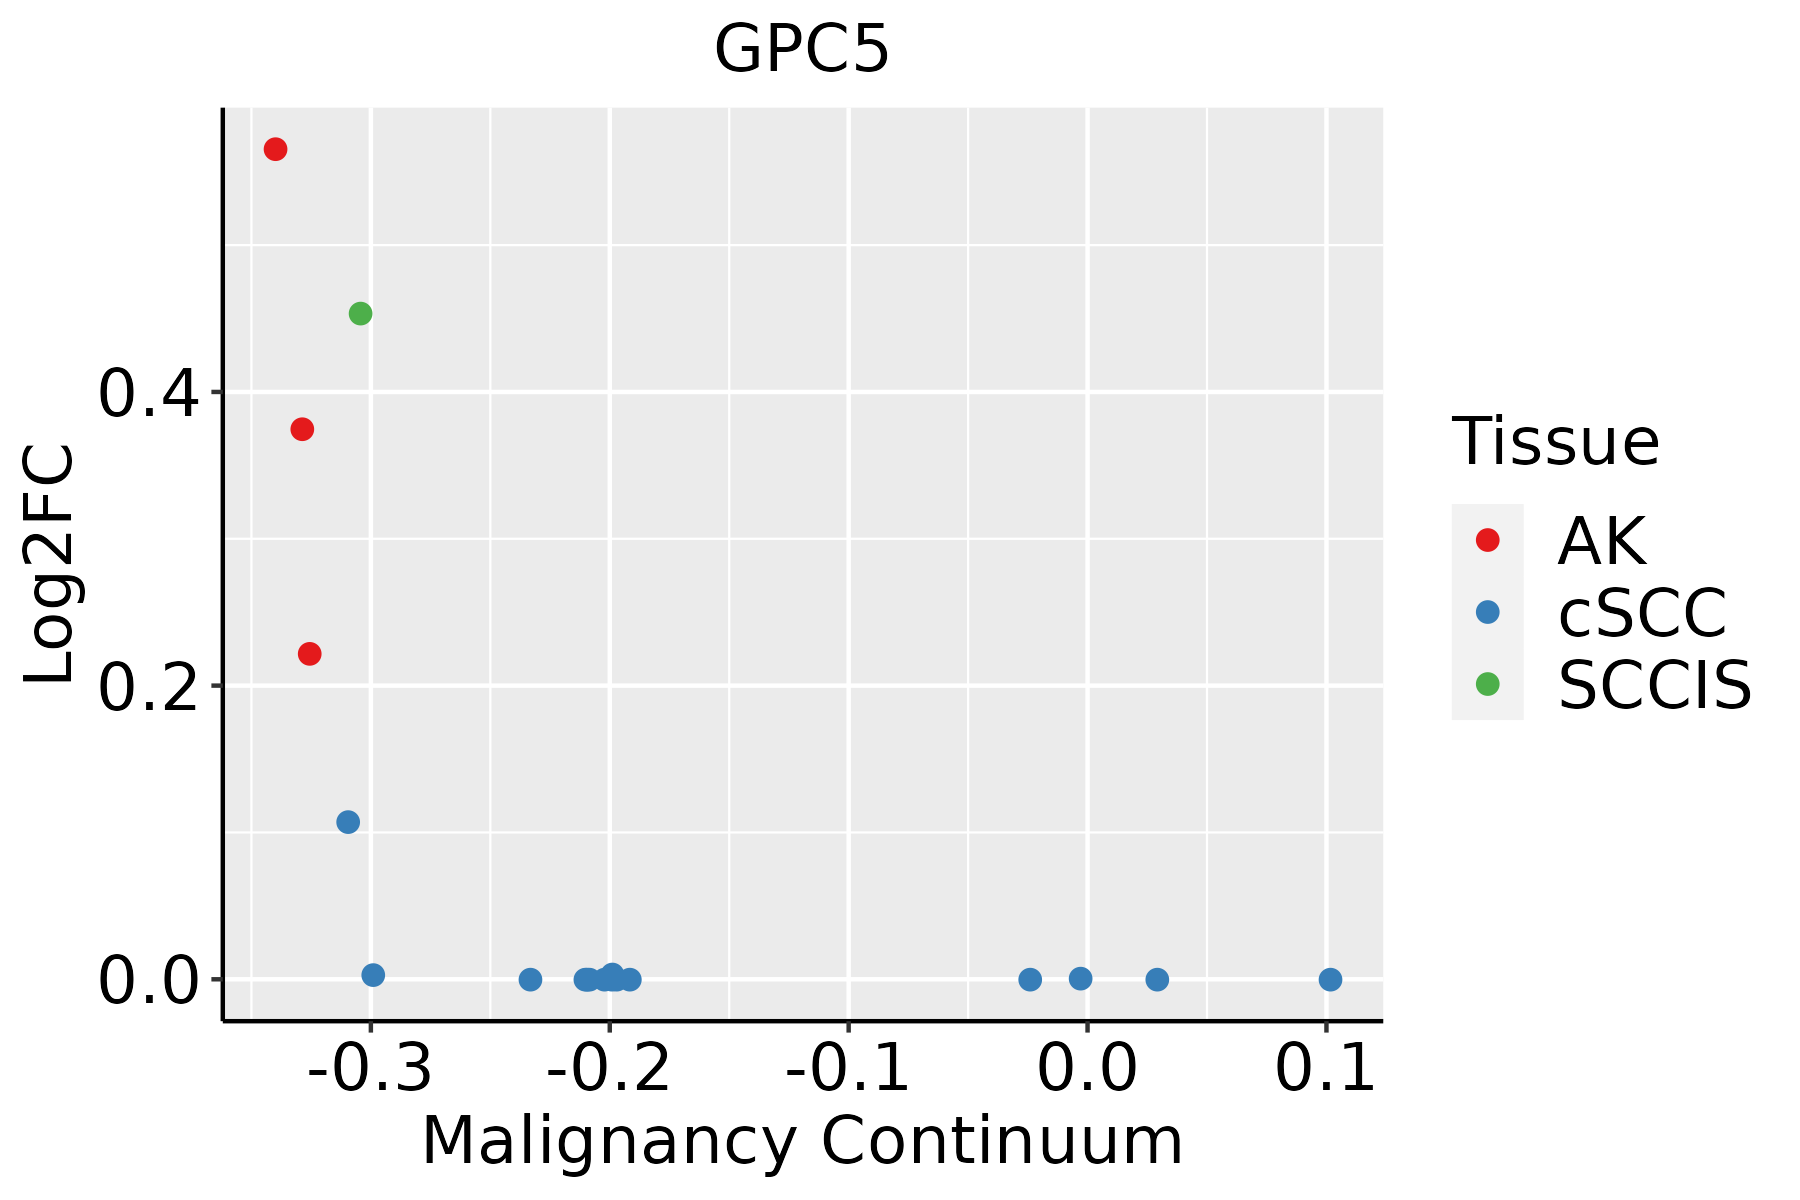 | AK: Actinic keratosis |
| cSCC: Cutaneous squamous cell carcinoma | ||
| SCCIS:squamous cell carcinoma in situ |
| ∗log2FC in expression of this searched gene in stem-like cells from each diseased tissue sample relative to stem-like cells in normal samples in each tissue plotted against the malignancy continuum. Samples are colored based on if they are from different disease stage. |
Top |
Malignant transformation related pathway analysis |
| Find out the enriched GO biological processes and KEGG pathways involved in transition from healthy to precancer to cancer |
| Tissue | Disease Stage | Enriched GO biological Processes |
| Colorectum | AD |  |
| Colorectum | SER |  |
| Colorectum | MSS |  |
| Colorectum | MSI-H |  |
| Colorectum | FAP |  |
| ∗Top 15 enriched GO BP terms are showed in the bar plot of each disease state in each tissue. Each row represents a significant GO biological process which is colored according to the -log10(p.adjust). |
| Page: 1 2 3 4 5 6 7 8 9 |
| GO ID | Tissue | Disease Stage | Description | Gene Ratio | Bg Ratio | pvalue | p.adjust | Count |
| GO:00160556 | Lung | IAC | Wnt signaling pathway | 95/2061 | 444/18723 | 1.13e-10 | 2.80e-08 | 95 |
| GO:01987386 | Lung | IAC | cell-cell signaling by wnt | 95/2061 | 446/18723 | 1.46e-10 | 3.48e-08 | 95 |
| GO:00301116 | Lung | IAC | regulation of Wnt signaling pathway | 74/2061 | 328/18723 | 1.14e-09 | 2.05e-07 | 74 |
| GO:00608286 | Lung | IAC | regulation of canonical Wnt signaling pathway | 54/2061 | 253/18723 | 1.25e-06 | 6.46e-05 | 54 |
| GO:00600706 | Lung | IAC | canonical Wnt signaling pathway | 61/2061 | 303/18723 | 2.09e-06 | 9.45e-05 | 61 |
| GO:00301775 | Lung | IAC | positive regulation of Wnt signaling pathway | 32/2061 | 140/18723 | 4.34e-05 | 1.03e-03 | 32 |
| GO:19054756 | Lung | IAC | regulation of protein localization to membrane | 36/2061 | 175/18723 | 1.54e-04 | 2.81e-03 | 36 |
| GO:00902635 | Lung | IAC | positive regulation of canonical Wnt signaling pathway | 24/2061 | 106/18723 | 4.33e-04 | 6.43e-03 | 24 |
| GO:001605512 | Lung | AIS | Wnt signaling pathway | 91/1849 | 444/18723 | 9.38e-12 | 5.47e-09 | 91 |
| GO:019873812 | Lung | AIS | cell-cell signaling by wnt | 91/1849 | 446/18723 | 1.22e-11 | 6.13e-09 | 91 |
| GO:003011112 | Lung | AIS | regulation of Wnt signaling pathway | 70/1849 | 328/18723 | 3.81e-10 | 8.87e-08 | 70 |
| GO:006082812 | Lung | AIS | regulation of canonical Wnt signaling pathway | 52/1849 | 253/18723 | 2.40e-07 | 2.22e-05 | 52 |
| GO:006007012 | Lung | AIS | canonical Wnt signaling pathway | 59/1849 | 303/18723 | 2.73e-07 | 2.37e-05 | 59 |
| GO:190547512 | Lung | AIS | regulation of protein localization to membrane | 37/1849 | 175/18723 | 6.36e-06 | 2.89e-04 | 37 |
| GO:003017712 | Lung | AIS | positive regulation of Wnt signaling pathway | 29/1849 | 140/18723 | 9.01e-05 | 2.21e-03 | 29 |
| GO:009026312 | Lung | AIS | positive regulation of canonical Wnt signaling pathway | 22/1849 | 106/18723 | 5.91e-04 | 9.03e-03 | 22 |
| GO:001605522 | Lung | AAH | Wnt signaling pathway | 28/613 | 444/18723 | 7.63e-04 | 2.63e-02 | 28 |
| GO:019873822 | Lung | AAH | cell-cell signaling by wnt | 28/613 | 446/18723 | 8.18e-04 | 2.75e-02 | 28 |
| GO:003011122 | Lung | MIAC | regulation of Wnt signaling pathway | 41/967 | 328/18723 | 1.51e-07 | 3.69e-05 | 41 |
| GO:001605531 | Lung | MIAC | Wnt signaling pathway | 50/967 | 444/18723 | 1.88e-07 | 4.02e-05 | 50 |
| Page: 1 2 3 |
| Pathway ID | Tissue | Disease Stage | Description | Gene Ratio | Bg Ratio | pvalue | p.adjust | qvalue | Count |
| Page: 1 |
Top |
Cell-cell communication analysis |
| Identification of potential cell-cell interactions between two cell types and their ligand-receptor pairs for different disease states |
| Ligand | Receptor | LRpair | Pathway | Tissue | Disease Stage |
| Page: 1 |
Top |
Single-cell gene regulatory network inference analysis |
| Find out the significant the regulons (TFs) and the target genes of each regulon across cell types for different disease states |
| TF | Cell Type | Tissue | Disease Stage | Target Gene | RSS | Regulon Activity |
| ∗The dot plots of a searched regulon are shown for all cell subpopulations in each disease state of each tissue based on the regulon specific score inferred using pySCENIC and by calculating the average expression. |
| Page: 1 |
Top |
Somatic mutation of malignant transformation related genes |
| Annotation of somatic variants for genes involved in malignant transformation |
| Hugo Symbol | Variant Class | Variant Classification | dbSNP RS | HGVSc | HGVSp | HGVSp Short | SWISSPROT | BIOTYPE | SIFT | PolyPhen | Tumor Sample Barcode | Tissue | Histology | Sex | Age | Stage | Therapy Types | Drugs | Outcome |
| GPC5 | SNV | Missense_Mutation | novel | c.281N>T | p.Ser94Phe | p.S94F | P78333 | protein_coding | tolerated(0.26) | benign(0.038) | TCGA-5L-AAT1-01 | Breast | breast invasive carcinoma | Female | <65 | III/IV | Hormone Therapy | letrozol | SD |
| GPC5 | SNV | Missense_Mutation | c.852N>A | p.His284Gln | p.H284Q | P78333 | protein_coding | tolerated(0.13) | benign(0.001) | TCGA-A2-A0EQ-01 | Breast | breast invasive carcinoma | Female | <65 | I/II | Chemotherapy | adriamycin | SD | |
| GPC5 | SNV | Missense_Mutation | c.1688N>T | p.Ser563Ile | p.S563I | P78333 | protein_coding | deleterious_low_confidence(0.03) | benign(0.076) | TCGA-A8-A09B-01 | Breast | breast invasive carcinoma | Female | <65 | III/IV | Chemotherapy | 5-fluorouracil | SD | |
| GPC5 | SNV | Missense_Mutation | rs370136945 | c.553G>A | p.Asp185Asn | p.D185N | P78333 | protein_coding | deleterious(0.01) | possibly_damaging(0.776) | TCGA-A8-A09Z-01 | Breast | breast invasive carcinoma | Female | >=65 | I/II | Unknown | Unknown | SD |
| GPC5 | SNV | Missense_Mutation | c.506N>A | p.Ser169Asn | p.S169N | P78333 | protein_coding | tolerated(0.08) | benign(0.06) | TCGA-AN-A0FL-01 | Breast | breast invasive carcinoma | Female | <65 | I/II | Unknown | Unknown | SD | |
| GPC5 | SNV | Missense_Mutation | c.829G>A | p.Val277Ile | p.V277I | P78333 | protein_coding | tolerated(0.09) | benign(0.311) | TCGA-BH-A1F0-01 | Breast | breast invasive carcinoma | Female | >=65 | I/II | Unknown | Unknown | PD | |
| GPC5 | SNV | Missense_Mutation | c.1065N>A | p.Ser355Arg | p.S355R | P78333 | protein_coding | tolerated(0.06) | possibly_damaging(0.821) | TCGA-D8-A142-01 | Breast | breast invasive carcinoma | Female | >=65 | I/II | Chemotherapy | cyclophosphamid | SD | |
| GPC5 | SNV | Missense_Mutation | c.897G>C | p.Leu299Phe | p.L299F | P78333 | protein_coding | deleterious(0) | probably_damaging(0.999) | TCGA-E2-A1L7-01 | Breast | breast invasive carcinoma | Female | <65 | III/IV | Chemotherapy | cyclophosphamide | PD | |
| GPC5 | SNV | Missense_Mutation | novel | c.1164N>G | p.Ile388Met | p.I388M | P78333 | protein_coding | tolerated(0.1) | possibly_damaging(0.688) | TCGA-LD-A74U-01 | Breast | breast invasive carcinoma | Female | >=65 | III/IV | Chemotherapy | taxotere | SD |
| GPC5 | insertion | Nonsense_Mutation | novel | c.978_979insCATTTGGTAATATTCCCCAAAGAGTAATGGGACAGATGG | p.Ala326_Val327insHisLeuValIlePheProLysGluTerTrpAspArgTrp | p.A326_V327insHLVIFPKE*WDRW | P78333 | protein_coding | TCGA-A7-A0CJ-01 | Breast | breast invasive carcinoma | Female | <65 | I/II | Chemotherapy | cytoxan | SD |
| Page: 1 2 3 4 5 6 7 8 9 10 11 12 13 14 15 |
Top |
Related drugs of malignant transformation related genes |
| Identification of chemicals and drugs interact with genes involved in malignant transfromation |
| (DGIdb 4.0) |
| Entrez ID | Symbol | Category | Interaction Types | Drug Claim Name | Drug Name | PMIDs |
| Page: 1 |

Copyright 2023-Present -The University of Texas Health Science Center at Houston |