
|
|||||
|
 | |
| |
| |
| |
| |
| |
|
Gene: GPC3 |
Gene summary for GPC3 |
| Gene information | Species | Human | Gene symbol | GPC3 | Gene ID | 2719 |
| Gene name | glypican 3 | |
| Gene Alias | DGSX | |
| Cytomap | Xq26.2 | |
| Gene Type | protein-coding | GO ID | GO:0001503 | UniProtAcc | P51654 |
Top |
Malignant transformation analysis |
| Identification of the aberrant gene expression in precancerous and cancerous lesions by comparing the gene expression of stem-like cells in diseased tissues with normal stem cells |
| Entrez ID | Symbol | Replicates | Species | Organ | Tissue | Adj P-value | Log2FC | Malignancy |
| 2719 | GPC3 | M5 | Human | Breast | IDC | 1.11e-09 | 5.54e-01 | 0.1598 |
| 2719 | GPC3 | HTA11_78_2000001011 | Human | Colorectum | AD | 4.30e-05 | 2.21e-01 | -0.1088 |
| 2719 | GPC3 | HTA11_347_2000001011 | Human | Colorectum | AD | 1.36e-06 | 1.76e-01 | -0.1954 |
| 2719 | GPC3 | HTA11_83_2000001011 | Human | Colorectum | SER | 1.14e-10 | 5.44e-01 | -0.1526 |
| 2719 | GPC3 | HTA11_1391_2000001011 | Human | Colorectum | AD | 4.38e-06 | 1.99e-01 | -0.059 |
| 2719 | GPC3 | HTA11_6801_2000001011 | Human | Colorectum | SER | 1.28e-05 | 4.22e-01 | 0.0171 |
| 2719 | GPC3 | HTA11_7696_3000711011 | Human | Colorectum | AD | 9.00e-04 | 1.79e-01 | 0.0674 |
| 2719 | GPC3 | HTA11_99999965062_69753 | Human | Colorectum | MSI-H | 1.01e-03 | 4.65e-01 | 0.3487 |
| 2719 | GPC3 | HTA11_99999965104_69814 | Human | Colorectum | MSS | 4.24e-74 | 2.22e+00 | 0.281 |
| 2719 | GPC3 | LZE2T | Human | Esophagus | ESCC | 6.39e-08 | 1.17e+00 | 0.082 |
| 2719 | GPC3 | LZE24T | Human | Esophagus | ESCC | 4.24e-16 | 9.16e-01 | 0.0596 |
| 2719 | GPC3 | P2T-E | Human | Esophagus | ESCC | 4.21e-04 | 1.42e-01 | 0.1177 |
| 2719 | GPC3 | P4T-E | Human | Esophagus | ESCC | 1.09e-10 | 3.73e-01 | 0.1323 |
| 2719 | GPC3 | P8T-E | Human | Esophagus | ESCC | 5.51e-08 | 3.61e-01 | 0.0889 |
| 2719 | GPC3 | P9T-E | Human | Esophagus | ESCC | 3.98e-04 | 6.69e-01 | 0.1131 |
| 2719 | GPC3 | P10T-E | Human | Esophagus | ESCC | 2.95e-131 | 3.69e+00 | 0.116 |
| 2719 | GPC3 | P12T-E | Human | Esophagus | ESCC | 4.07e-117 | 3.63e+00 | 0.1122 |
| 2719 | GPC3 | P15T-E | Human | Esophagus | ESCC | 8.49e-33 | 8.78e-01 | 0.1149 |
| 2719 | GPC3 | P22T-E | Human | Esophagus | ESCC | 6.93e-81 | 1.80e+00 | 0.1236 |
| 2719 | GPC3 | P23T-E | Human | Esophagus | ESCC | 8.18e-18 | 9.17e-01 | 0.108 |
| Page: 1 2 3 |
| Tissue | Expression Dynamics | Abbreviation |
| Breast | 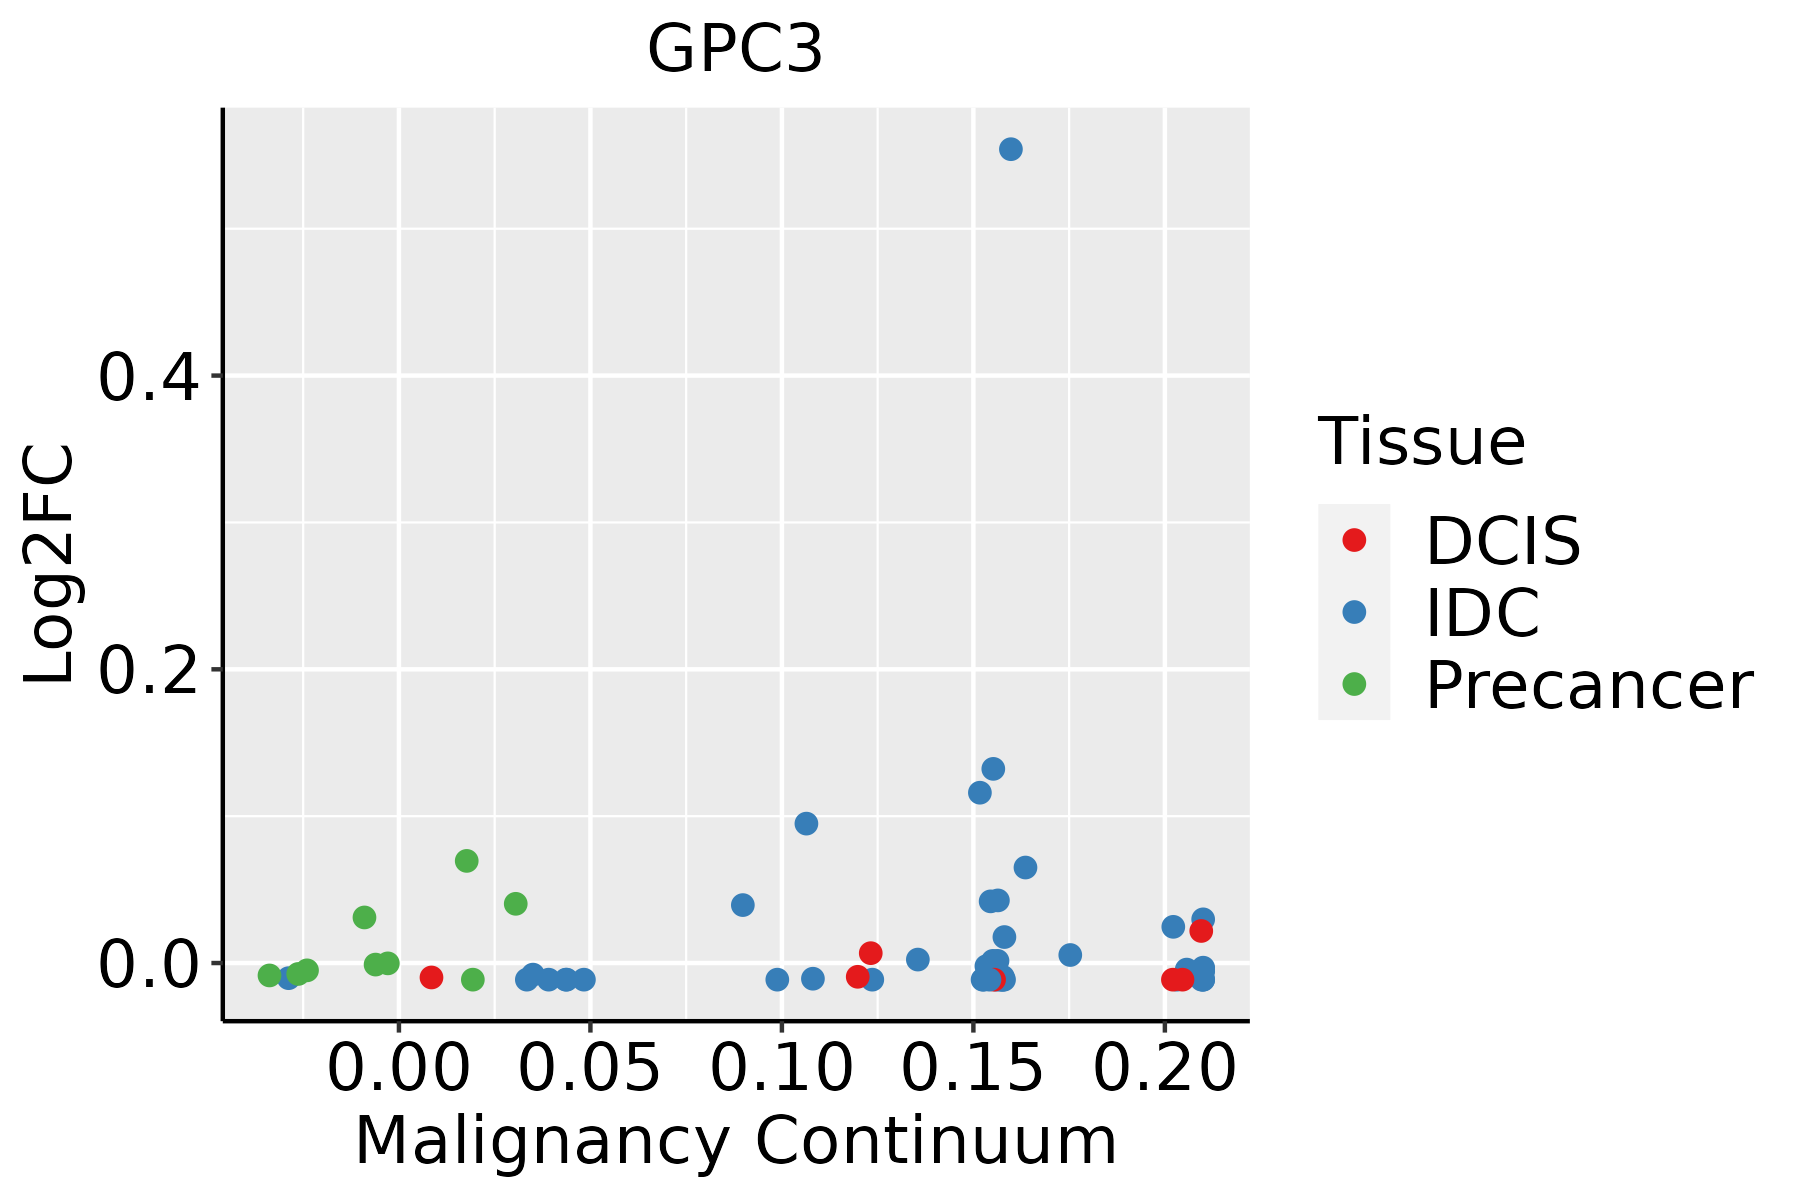 | IDC: Invasive ductal carcinoma |
| DCIS: Ductal carcinoma in situ | ||
| Precancer(BRCA1-mut): Precancerous lesion from BRCA1 mutation carriers | ||
| Colorectum (GSE201348) | 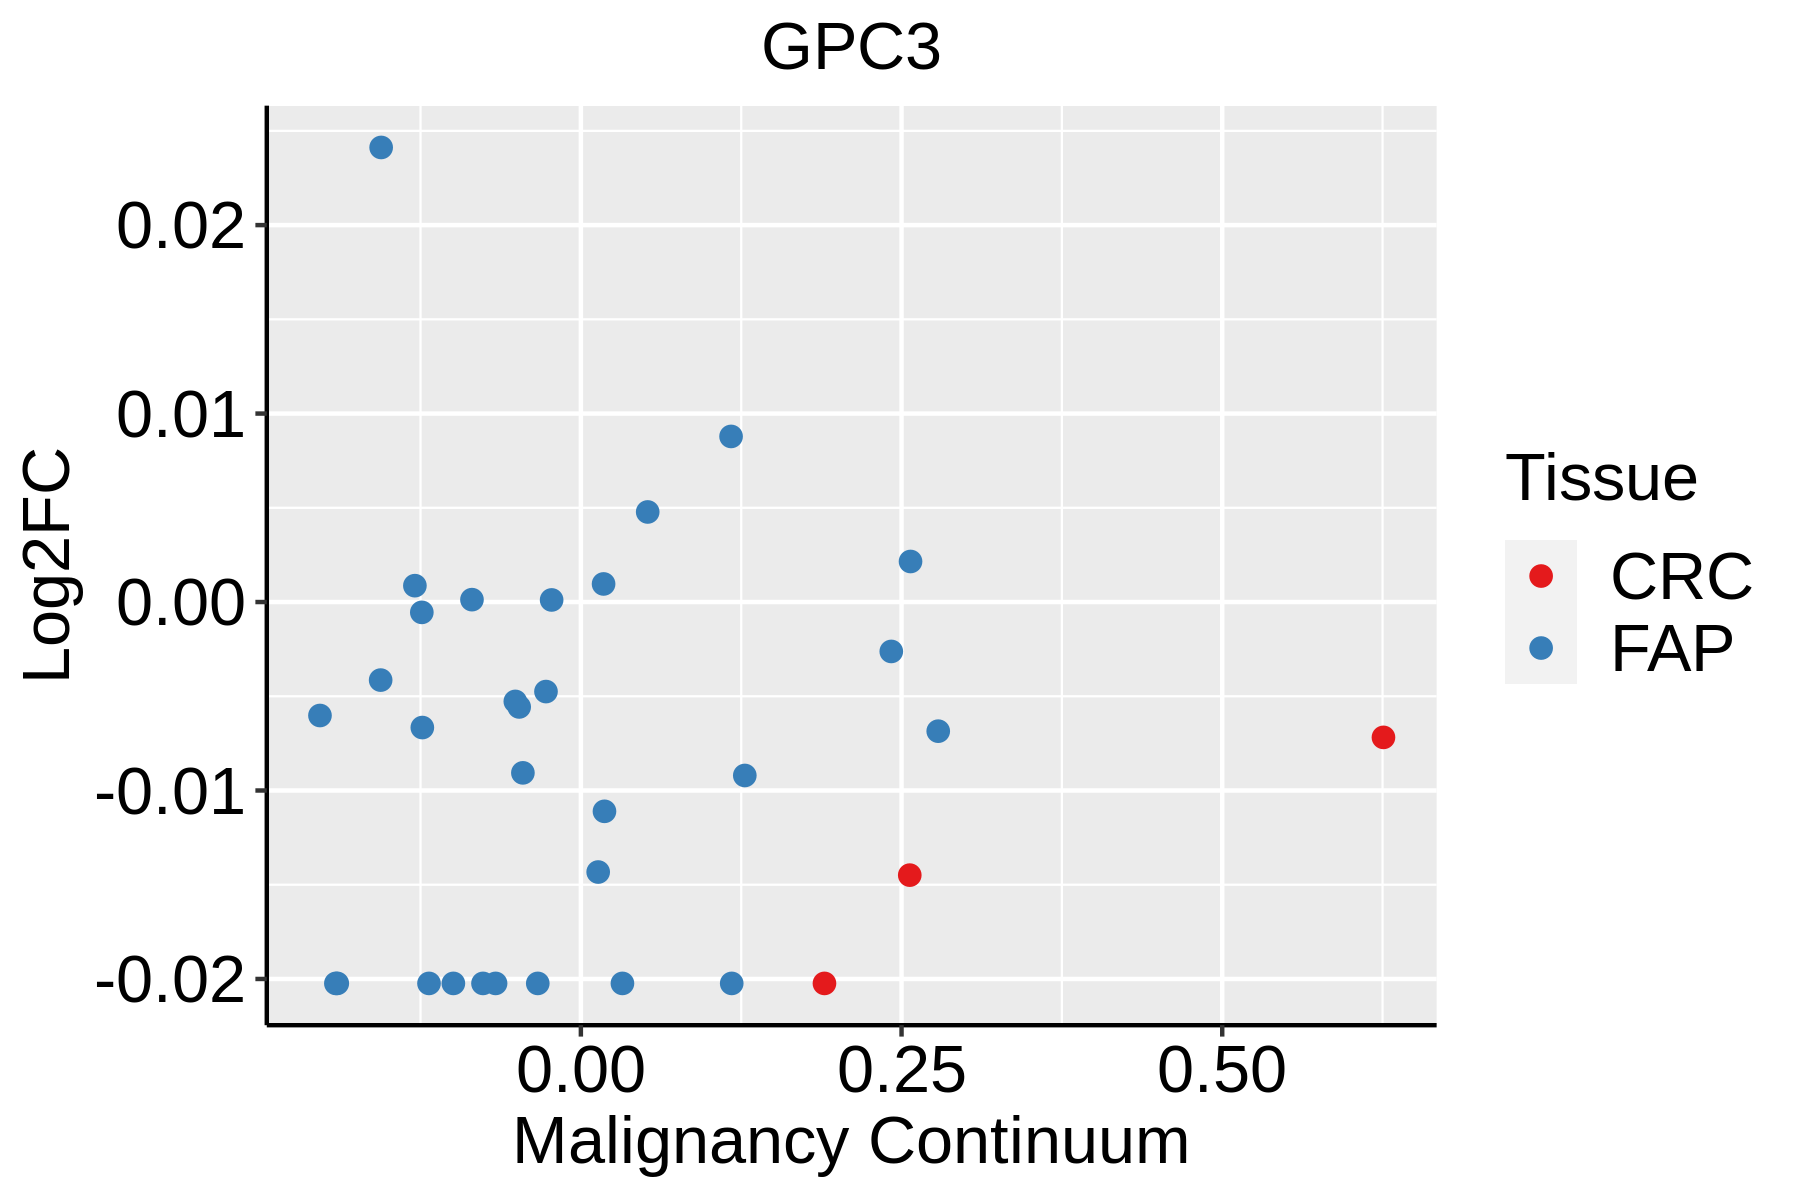 | FAP: Familial adenomatous polyposis |
| CRC: Colorectal cancer | ||
| Colorectum (HTA11) |  | AD: Adenomas |
| SER: Sessile serrated lesions | ||
| MSI-H: Microsatellite-high colorectal cancer | ||
| MSS: Microsatellite stable colorectal cancer | ||
| Esophagus | 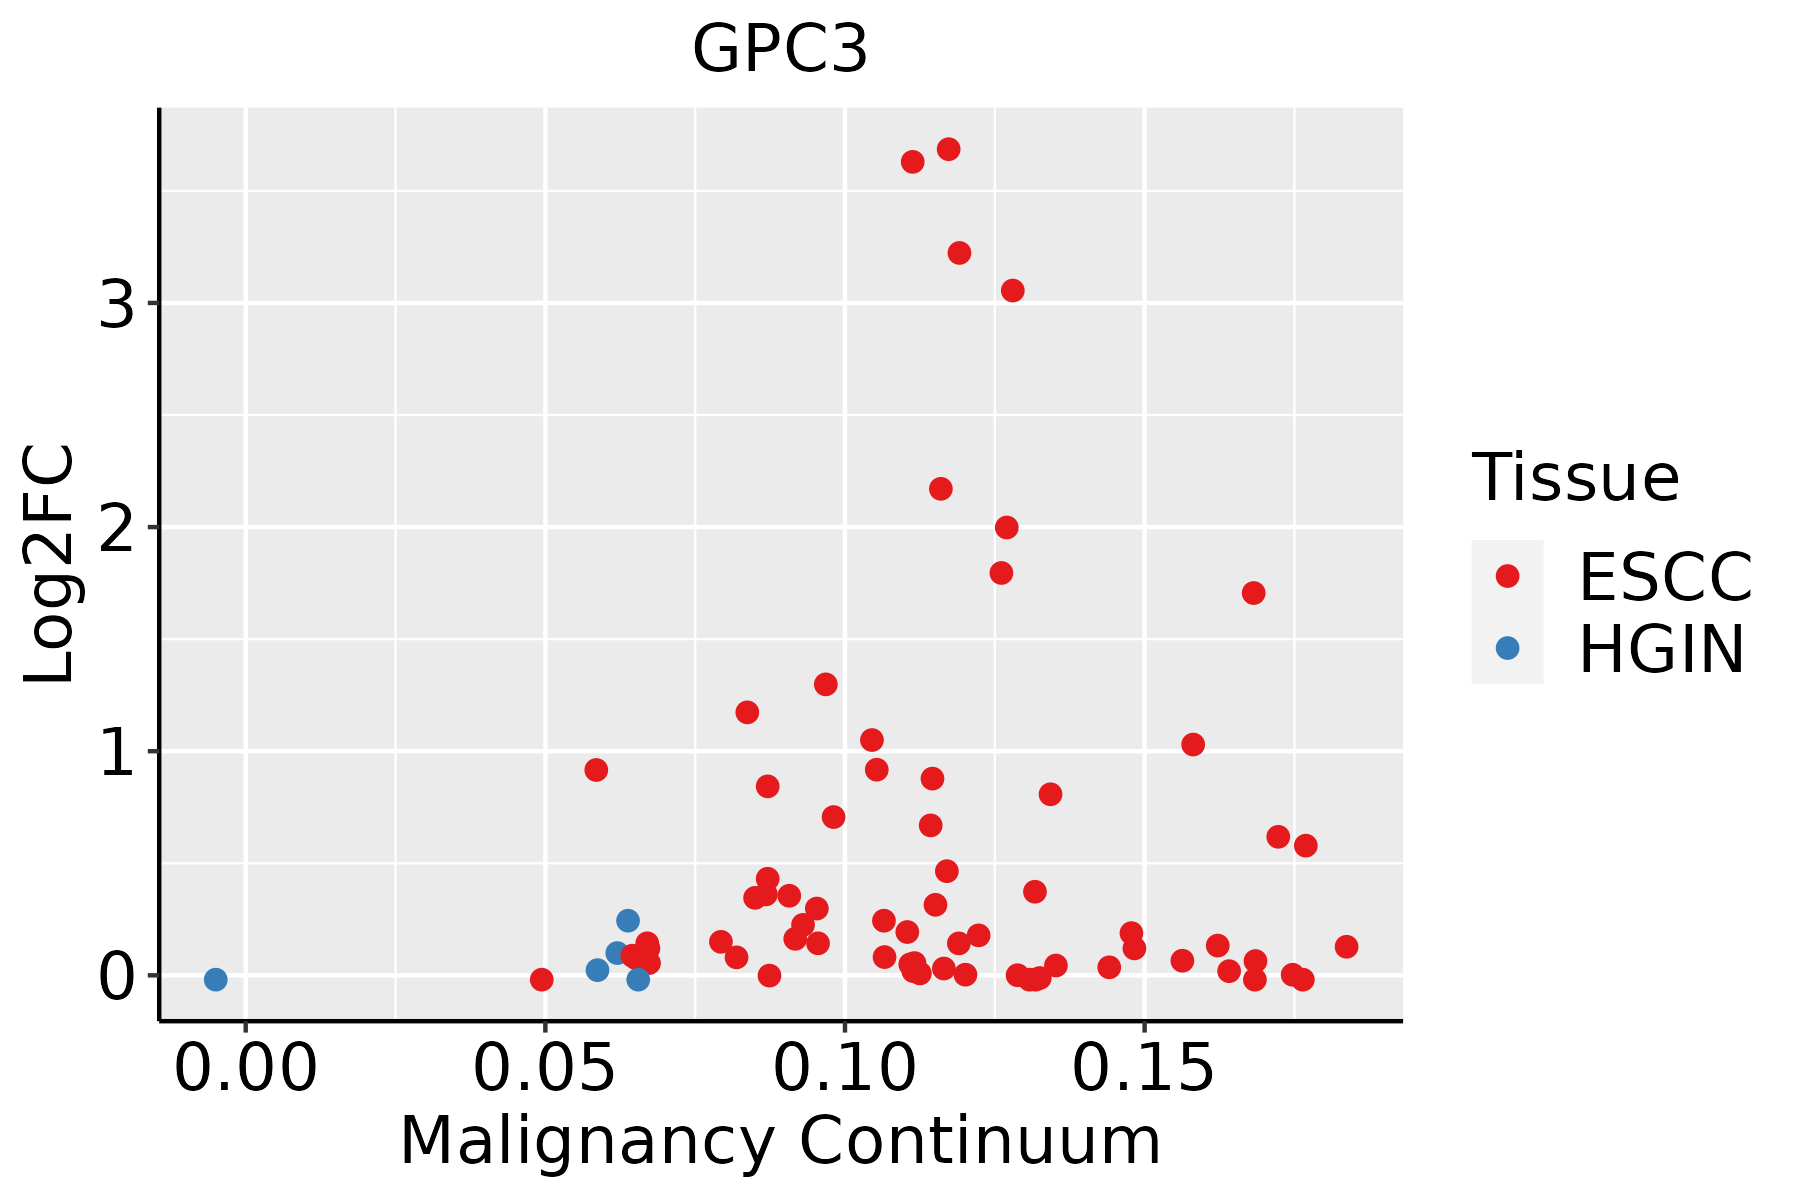 | ESCC: Esophageal squamous cell carcinoma |
| HGIN: High-grade intraepithelial neoplasias | ||
| LGIN: Low-grade intraepithelial neoplasias | ||
| Liver | 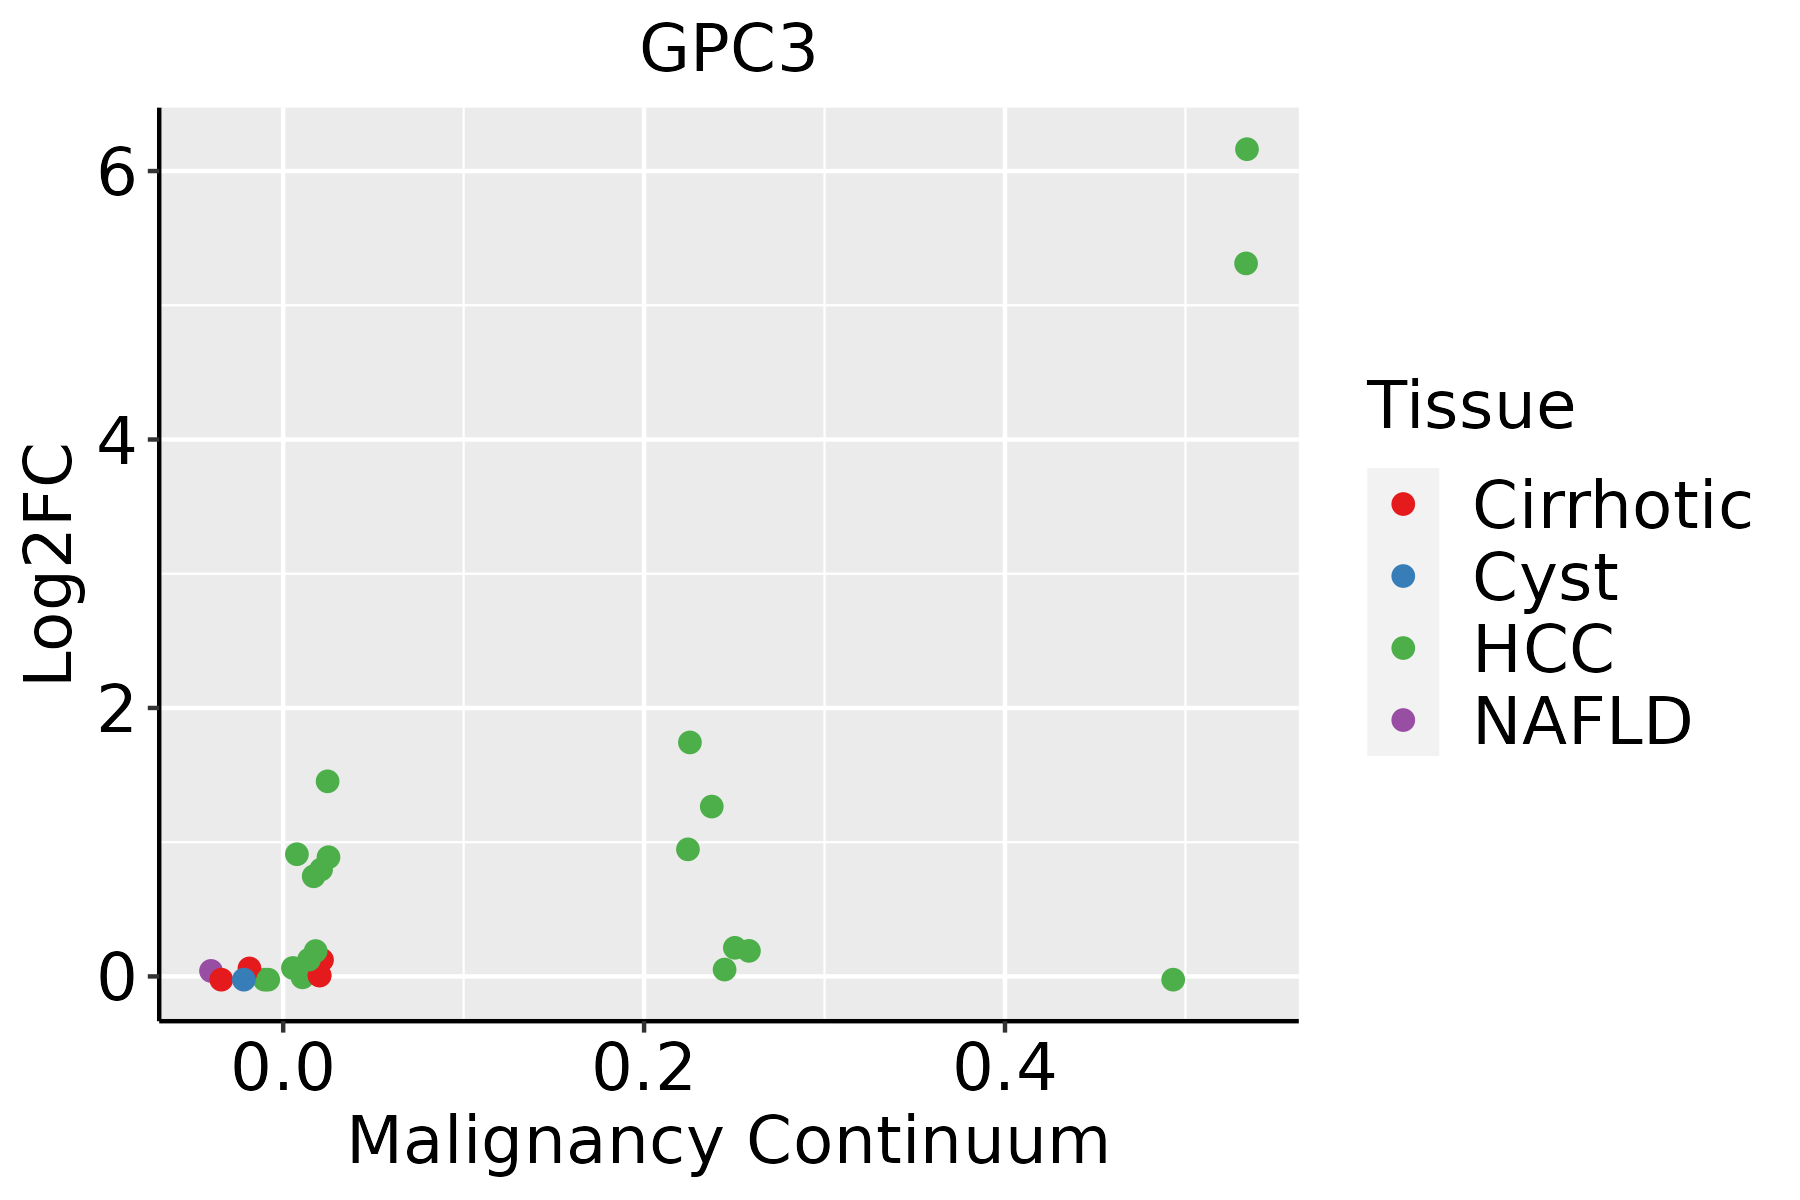 | HCC: Hepatocellular carcinoma |
| NAFLD: Non-alcoholic fatty liver disease | ||
| Oral Cavity |  | EOLP: Erosive Oral lichen planus |
| LP: leukoplakia | ||
| NEOLP: Non-erosive oral lichen planus | ||
| OSCC: Oral squamous cell carcinoma | ||
| Thyroid | 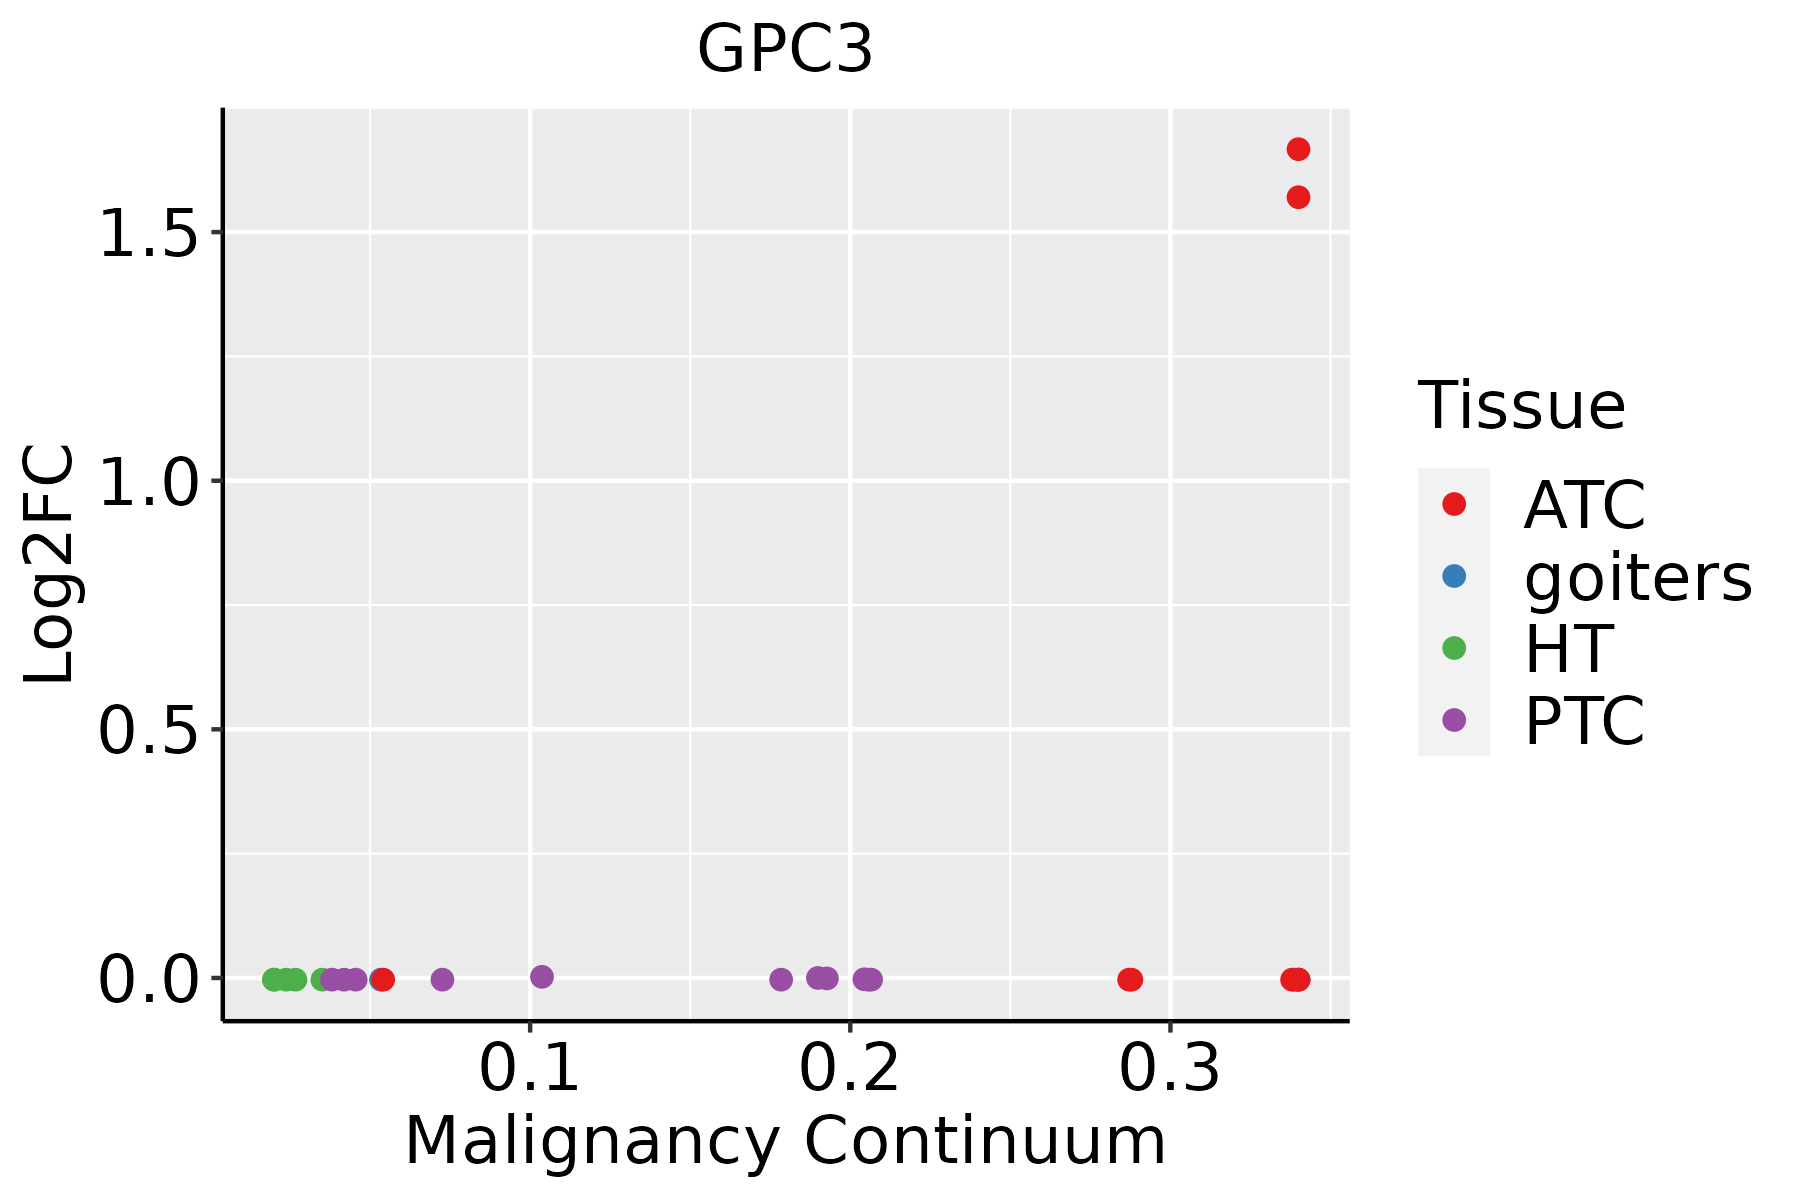 | ATC: Anaplastic thyroid cancer |
| HT: Hashimoto's thyroiditis | ||
| PTC: Papillary thyroid cancer |
| ∗log2FC in expression of this searched gene in stem-like cells from each diseased tissue sample relative to stem-like cells in normal samples in each tissue plotted against the malignancy continuum. Samples are colored based on if they are from different disease stage. |
Top |
Malignant transformation related pathway analysis |
| Find out the enriched GO biological processes and KEGG pathways involved in transition from healthy to precancer to cancer |
| Tissue | Disease Stage | Enriched GO biological Processes |
| Colorectum | AD |  |
| Colorectum | SER |  |
| Colorectum | MSS |  |
| Colorectum | MSI-H |  |
| Colorectum | FAP |  |
| ∗Top 15 enriched GO BP terms are showed in the bar plot of each disease state in each tissue. Each row represents a significant GO biological process which is colored according to the -log10(p.adjust). |
| Page: 1 2 3 4 5 6 7 8 9 |
| GO ID | Tissue | Disease Stage | Description | Gene Ratio | Bg Ratio | pvalue | p.adjust | Count |
| GO:005254714 | Breast | IDC | regulation of peptidase activity | 96/1434 | 461/18723 | 7.58e-20 | 6.15e-17 | 96 |
| GO:004586114 | Breast | IDC | negative regulation of proteolysis | 70/1434 | 351/18723 | 8.21e-14 | 2.22e-11 | 70 |
| GO:005134613 | Breast | IDC | negative regulation of hydrolase activity | 71/1434 | 379/18723 | 1.33e-12 | 2.90e-10 | 71 |
| GO:001046613 | Breast | IDC | negative regulation of peptidase activity | 56/1434 | 262/18723 | 1.39e-12 | 2.92e-10 | 56 |
| GO:004217614 | Breast | IDC | regulation of protein catabolic process | 63/1434 | 391/18723 | 1.32e-08 | 9.61e-07 | 63 |
| GO:000166714 | Breast | IDC | ameboidal-type cell migration | 64/1434 | 475/18723 | 6.65e-06 | 2.05e-04 | 64 |
| GO:005067313 | Breast | IDC | epithelial cell proliferation | 60/1434 | 437/18723 | 7.13e-06 | 2.15e-04 | 60 |
| GO:003009914 | Breast | IDC | myeloid cell differentiation | 54/1434 | 381/18723 | 8.07e-06 | 2.39e-04 | 54 |
| GO:005067812 | Breast | IDC | regulation of epithelial cell proliferation | 54/1434 | 381/18723 | 8.07e-06 | 2.39e-04 | 54 |
| GO:004573214 | Breast | IDC | positive regulation of protein catabolic process | 37/1434 | 231/18723 | 1.46e-05 | 3.71e-04 | 37 |
| GO:000257312 | Breast | IDC | myeloid leukocyte differentiation | 33/1434 | 208/18723 | 5.02e-05 | 1.09e-03 | 33 |
| GO:000989614 | Breast | IDC | positive regulation of catabolic process | 62/1434 | 492/18723 | 7.06e-05 | 1.42e-03 | 62 |
| GO:190547513 | Breast | IDC | regulation of protein localization to membrane | 28/1434 | 175/18723 | 1.56e-04 | 2.71e-03 | 28 |
| GO:006056212 | Breast | IDC | epithelial tube morphogenesis | 44/1434 | 325/18723 | 1.58e-04 | 2.73e-03 | 44 |
| GO:00303244 | Breast | IDC | lung development | 28/1434 | 177/18723 | 1.90e-04 | 3.15e-03 | 28 |
| GO:00303234 | Breast | IDC | respiratory tube development | 28/1434 | 181/18723 | 2.78e-04 | 4.26e-03 | 28 |
| GO:00611383 | Breast | IDC | morphogenesis of a branching epithelium | 28/1434 | 182/18723 | 3.05e-04 | 4.60e-03 | 28 |
| GO:00605412 | Breast | IDC | respiratory system development | 30/1434 | 203/18723 | 3.85e-04 | 5.40e-03 | 30 |
| GO:00017635 | Breast | IDC | morphogenesis of a branching structure | 29/1434 | 196/18723 | 4.68e-04 | 6.26e-03 | 29 |
| GO:004580713 | Breast | IDC | positive regulation of endocytosis | 18/1434 | 100/18723 | 5.40e-04 | 6.96e-03 | 18 |
| Page: 1 2 3 4 5 6 7 8 9 10 11 12 13 14 15 16 17 |
| Pathway ID | Tissue | Disease Stage | Description | Gene Ratio | Bg Ratio | pvalue | p.adjust | qvalue | Count |
| hsa05205 | Colorectum | AD | Proteoglycans in cancer | 70/2092 | 205/8465 | 1.37e-03 | 8.46e-03 | 5.39e-03 | 70 |
| hsa052051 | Colorectum | AD | Proteoglycans in cancer | 70/2092 | 205/8465 | 1.37e-03 | 8.46e-03 | 5.39e-03 | 70 |
| hsa052052 | Colorectum | SER | Proteoglycans in cancer | 58/1580 | 205/8465 | 4.37e-04 | 3.82e-03 | 2.77e-03 | 58 |
| hsa052053 | Colorectum | SER | Proteoglycans in cancer | 58/1580 | 205/8465 | 4.37e-04 | 3.82e-03 | 2.77e-03 | 58 |
| hsa052054 | Colorectum | MSS | Proteoglycans in cancer | 65/1875 | 205/8465 | 8.66e-04 | 5.38e-03 | 3.29e-03 | 65 |
| hsa052055 | Colorectum | MSS | Proteoglycans in cancer | 65/1875 | 205/8465 | 8.66e-04 | 5.38e-03 | 3.29e-03 | 65 |
| hsa0520529 | Esophagus | ESCC | Proteoglycans in cancer | 138/4205 | 205/8465 | 1.79e-07 | 1.40e-06 | 7.15e-07 | 138 |
| hsa0520537 | Esophagus | ESCC | Proteoglycans in cancer | 138/4205 | 205/8465 | 1.79e-07 | 1.40e-06 | 7.15e-07 | 138 |
| hsa0520521 | Liver | HCC | Proteoglycans in cancer | 121/4020 | 205/8465 | 5.22e-04 | 2.18e-03 | 1.21e-03 | 121 |
| hsa0520531 | Liver | HCC | Proteoglycans in cancer | 121/4020 | 205/8465 | 5.22e-04 | 2.18e-03 | 1.21e-03 | 121 |
| hsa0520526 | Oral cavity | OSCC | Proteoglycans in cancer | 128/3704 | 205/8465 | 4.00e-08 | 3.12e-07 | 1.59e-07 | 128 |
| hsa05205111 | Oral cavity | OSCC | Proteoglycans in cancer | 128/3704 | 205/8465 | 4.00e-08 | 3.12e-07 | 1.59e-07 | 128 |
| hsa0520527 | Oral cavity | LP | Proteoglycans in cancer | 77/2418 | 205/8465 | 3.01e-03 | 1.29e-02 | 8.35e-03 | 77 |
| hsa0520536 | Oral cavity | LP | Proteoglycans in cancer | 77/2418 | 205/8465 | 3.01e-03 | 1.29e-02 | 8.35e-03 | 77 |
| Page: 1 |
Top |
Cell-cell communication analysis |
| Identification of potential cell-cell interactions between two cell types and their ligand-receptor pairs for different disease states |
| Ligand | Receptor | LRpair | Pathway | Tissue | Disease Stage |
| Page: 1 |
Top |
Single-cell gene regulatory network inference analysis |
| Find out the significant the regulons (TFs) and the target genes of each regulon across cell types for different disease states |
| TF | Cell Type | Tissue | Disease Stage | Target Gene | RSS | Regulon Activity |
| ∗The dot plots of a searched regulon are shown for all cell subpopulations in each disease state of each tissue based on the regulon specific score inferred using pySCENIC and by calculating the average expression. |
| Page: 1 |
Top |
Somatic mutation of malignant transformation related genes |
| Annotation of somatic variants for genes involved in malignant transformation |
| Hugo Symbol | Variant Class | Variant Classification | dbSNP RS | HGVSc | HGVSp | HGVSp Short | SWISSPROT | BIOTYPE | SIFT | PolyPhen | Tumor Sample Barcode | Tissue | Histology | Sex | Age | Stage | Therapy Types | Drugs | Outcome |
| GPC3 | SNV | Missense_Mutation | c.427N>C | p.Glu143Gln | p.E143Q | P51654 | protein_coding | tolerated(0.26) | benign(0.023) | TCGA-A8-A07U-01 | Breast | breast invasive carcinoma | Female | >=65 | III/IV | Chemotherapy | 5-fluorouracil | SD | |
| GPC3 | SNV | Missense_Mutation | c.596N>A | p.Arg199Gln | p.R199Q | P51654 | protein_coding | deleterious(0.03) | benign(0.087) | TCGA-A8-A0A9-01 | Breast | breast invasive carcinoma | Female | >=65 | I/II | Hormone Therapy | anastrozole | SD | |
| GPC3 | SNV | Missense_Mutation | novel | c.901C>A | p.Leu301Met | p.L301M | P51654 | protein_coding | tolerated(0.07) | possibly_damaging(0.722) | TCGA-AN-A046-01 | Breast | breast invasive carcinoma | Female | >=65 | I/II | Unknown | Unknown | SD |
| GPC3 | insertion | In_Frame_Ins | novel | c.898_899insCTGTAGACACTCTACTGATCTATCAAACACTGAGTCTTATCA | p.Tyr299_Ile300insThrValAspThrLeuLeuIleTyrGlnThrLeuSerLeuIle | p.Y299_I300insTVDTLLIYQTLSLI | P51654 | protein_coding | TCGA-A7-A0CG-01 | Breast | breast invasive carcinoma | Female | >=65 | I/II | Unknown | Unknown | SD | ||
| GPC3 | insertion | In_Frame_Ins | novel | c.350_351insGGTCCCCCACCCTTGGATGGCTCCAAGAACTTTTCAAGTTCTCAA | p.Ile117delinsMetValProHisProTrpMetAlaProArgThrPheGlnValLeuAsn | p.I117delinsMVPHPWMAPRTFQVLN | P51654 | protein_coding | TCGA-A8-A07G-01 | Breast | breast invasive carcinoma | Female | >=65 | I/II | Chemotherapy | 5-fluorouracil | CR | ||
| GPC3 | insertion | Frame_Shift_Ins | novel | c.930_931insATCTATCA | p.Tyr311IlefsTer34 | p.Y311Ifs*34 | P51654 | protein_coding | TCGA-AO-A0JB-01 | Breast | breast invasive carcinoma | Female | <65 | III/IV | Chemotherapy | cyclophosphamide | SD | ||
| GPC3 | insertion | Nonsense_Mutation | novel | c.929_930insAGATTACTATACACTGTAGACACTCTACT | p.Met310IlefsTer7 | p.M310Ifs*7 | P51654 | protein_coding | TCGA-AO-A0JB-01 | Breast | breast invasive carcinoma | Female | <65 | III/IV | Chemotherapy | cyclophosphamide | SD | ||
| GPC3 | insertion | Frame_Shift_Ins | novel | c.915_916insATTCACCCACAAACTCAAAAGCTTGTGGAGTCAGG | p.Leu306IlefsTer14 | p.L306Ifs*14 | P51654 | protein_coding | TCGA-AO-A128-01 | Breast | breast invasive carcinoma | Female | <65 | I/II | Chemotherapy | doxorubicin | SD | ||
| GPC3 | insertion | In_Frame_Ins | novel | c.1257_1258insCTCAATTTATAT | p.Lys419_Ser420insLeuAsnLeuTyr | p.K419_S420insLNLY | P51654 | protein_coding | TCGA-BH-A0B1-01 | Breast | breast invasive carcinoma | Female | >=65 | I/II | Chemotherapy | adriamycin | SD | ||
| GPC3 | SNV | Missense_Mutation | c.1165C>T | p.Leu389Phe | p.L389F | P51654 | protein_coding | tolerated(0.71) | benign(0.012) | TCGA-EK-A2PG-01 | Cervix | cervical & endocervical cancer | Female | >=65 | I/II | Unknown | Unknown | SD |
| Page: 1 2 3 4 5 6 7 8 9 |
Top |
Related drugs of malignant transformation related genes |
| Identification of chemicals and drugs interact with genes involved in malignant transfromation |
| (DGIdb 4.0) |
| Entrez ID | Symbol | Category | Interaction Types | Drug Claim Name | Drug Name | PMIDs |
| 2719 | GPC3 | DRUGGABLE GENOME, CELL SURFACE, CLINICALLY ACTIONABLE | GPC3 targeting CAR-T cells | |||
| 2719 | GPC3 | DRUGGABLE GENOME, CELL SURFACE, CLINICALLY ACTIONABLE | CAR-T cells targeting GPC3 | |||
| 2719 | GPC3 | DRUGGABLE GENOME, CELL SURFACE, CLINICALLY ACTIONABLE | CAR-GPC3 T cell | |||
| 2719 | GPC3 | DRUGGABLE GENOME, CELL SURFACE, CLINICALLY ACTIONABLE | RG7686 | |||
| 2719 | GPC3 | DRUGGABLE GENOME, CELL SURFACE, CLINICALLY ACTIONABLE | GPC-3298306 | |||
| 2719 | GPC3 | DRUGGABLE GENOME, CELL SURFACE, CLINICALLY ACTIONABLE | CAR-GPC3 T Cells | |||
| 2719 | GPC3 | DRUGGABLE GENOME, CELL SURFACE, CLINICALLY ACTIONABLE | Anti-GPC3 CAR T | |||
| 2719 | GPC3 | DRUGGABLE GENOME, CELL SURFACE, CLINICALLY ACTIONABLE | ERY974 | ERY-974 | ||
| 2719 | GPC3 | DRUGGABLE GENOME, CELL SURFACE, CLINICALLY ACTIONABLE | CAR-GPC3 T cells | |||
| 2719 | GPC3 | DRUGGABLE GENOME, CELL SURFACE, CLINICALLY ACTIONABLE | TAI-GPC3-CART cells |
| Page: 1 2 |

Copyright 2023-Present -The University of Texas Health Science Center at Houston |