
|
|||||
|
 | |
| |
| |
| |
| |
| |
|
Gene: GPC1 |
Gene summary for GPC1 |
| Gene information | Species | Human | Gene symbol | GPC1 | Gene ID | 2817 |
| Gene name | glypican 1 | |
| Gene Alias | glypican | |
| Cytomap | 2q37.3 | |
| Gene Type | protein-coding | GO ID | GO:0006029 | UniProtAcc | P35052 |
Top |
Malignant transformation analysis |
| Identification of the aberrant gene expression in precancerous and cancerous lesions by comparing the gene expression of stem-like cells in diseased tissues with normal stem cells |
| Entrez ID | Symbol | Replicates | Species | Organ | Tissue | Adj P-value | Log2FC | Malignancy |
| 2817 | GPC1 | CA_HPV_1 | Human | Cervix | CC | 7.62e-09 | -2.54e-01 | 0.0264 |
| 2817 | GPC1 | CA_HPV_3 | Human | Cervix | CC | 3.55e-09 | 2.29e-01 | 0.0414 |
| 2817 | GPC1 | Tumor | Human | Cervix | CC | 1.42e-16 | 5.44e-01 | 0.1241 |
| 2817 | GPC1 | sample3 | Human | Cervix | CC | 2.29e-23 | 5.33e-01 | 0.1387 |
| 2817 | GPC1 | H2 | Human | Cervix | HSIL_HPV | 3.08e-03 | -1.91e-01 | 0.0632 |
| 2817 | GPC1 | T3 | Human | Cervix | CC | 9.70e-25 | 5.78e-01 | 0.1389 |
| 2817 | GPC1 | LZE4T | Human | Esophagus | ESCC | 1.09e-07 | 6.10e-02 | 0.0811 |
| 2817 | GPC1 | LZE7T | Human | Esophagus | ESCC | 2.03e-04 | -5.21e-02 | 0.0667 |
| 2817 | GPC1 | LZE8T | Human | Esophagus | ESCC | 1.65e-12 | 3.11e-01 | 0.067 |
| 2817 | GPC1 | LZE20T | Human | Esophagus | ESCC | 1.16e-08 | -4.56e-03 | 0.0662 |
| 2817 | GPC1 | LZE21D1 | Human | Esophagus | HGIN | 2.57e-05 | 3.33e-01 | 0.0632 |
| 2817 | GPC1 | LZE24T | Human | Esophagus | ESCC | 4.59e-06 | 1.67e-01 | 0.0596 |
| 2817 | GPC1 | LZE21T | Human | Esophagus | ESCC | 1.96e-04 | 8.15e-01 | 0.0655 |
| 2817 | GPC1 | P1T-E | Human | Esophagus | ESCC | 2.67e-05 | 6.21e-01 | 0.0875 |
| 2817 | GPC1 | P2T-E | Human | Esophagus | ESCC | 3.45e-35 | 7.82e-01 | 0.1177 |
| 2817 | GPC1 | P4T-E | Human | Esophagus | ESCC | 1.52e-15 | 6.65e-01 | 0.1323 |
| 2817 | GPC1 | P5T-E | Human | Esophagus | ESCC | 2.00e-30 | 7.43e-01 | 0.1327 |
| 2817 | GPC1 | P8T-E | Human | Esophagus | ESCC | 4.79e-23 | 4.00e-01 | 0.0889 |
| 2817 | GPC1 | P9T-E | Human | Esophagus | ESCC | 2.21e-52 | 1.34e+00 | 0.1131 |
| 2817 | GPC1 | P10T-E | Human | Esophagus | ESCC | 1.07e-54 | 1.57e+00 | 0.116 |
| Page: 1 2 3 4 5 6 7 |
| Tissue | Expression Dynamics | Abbreviation |
| Cervix | 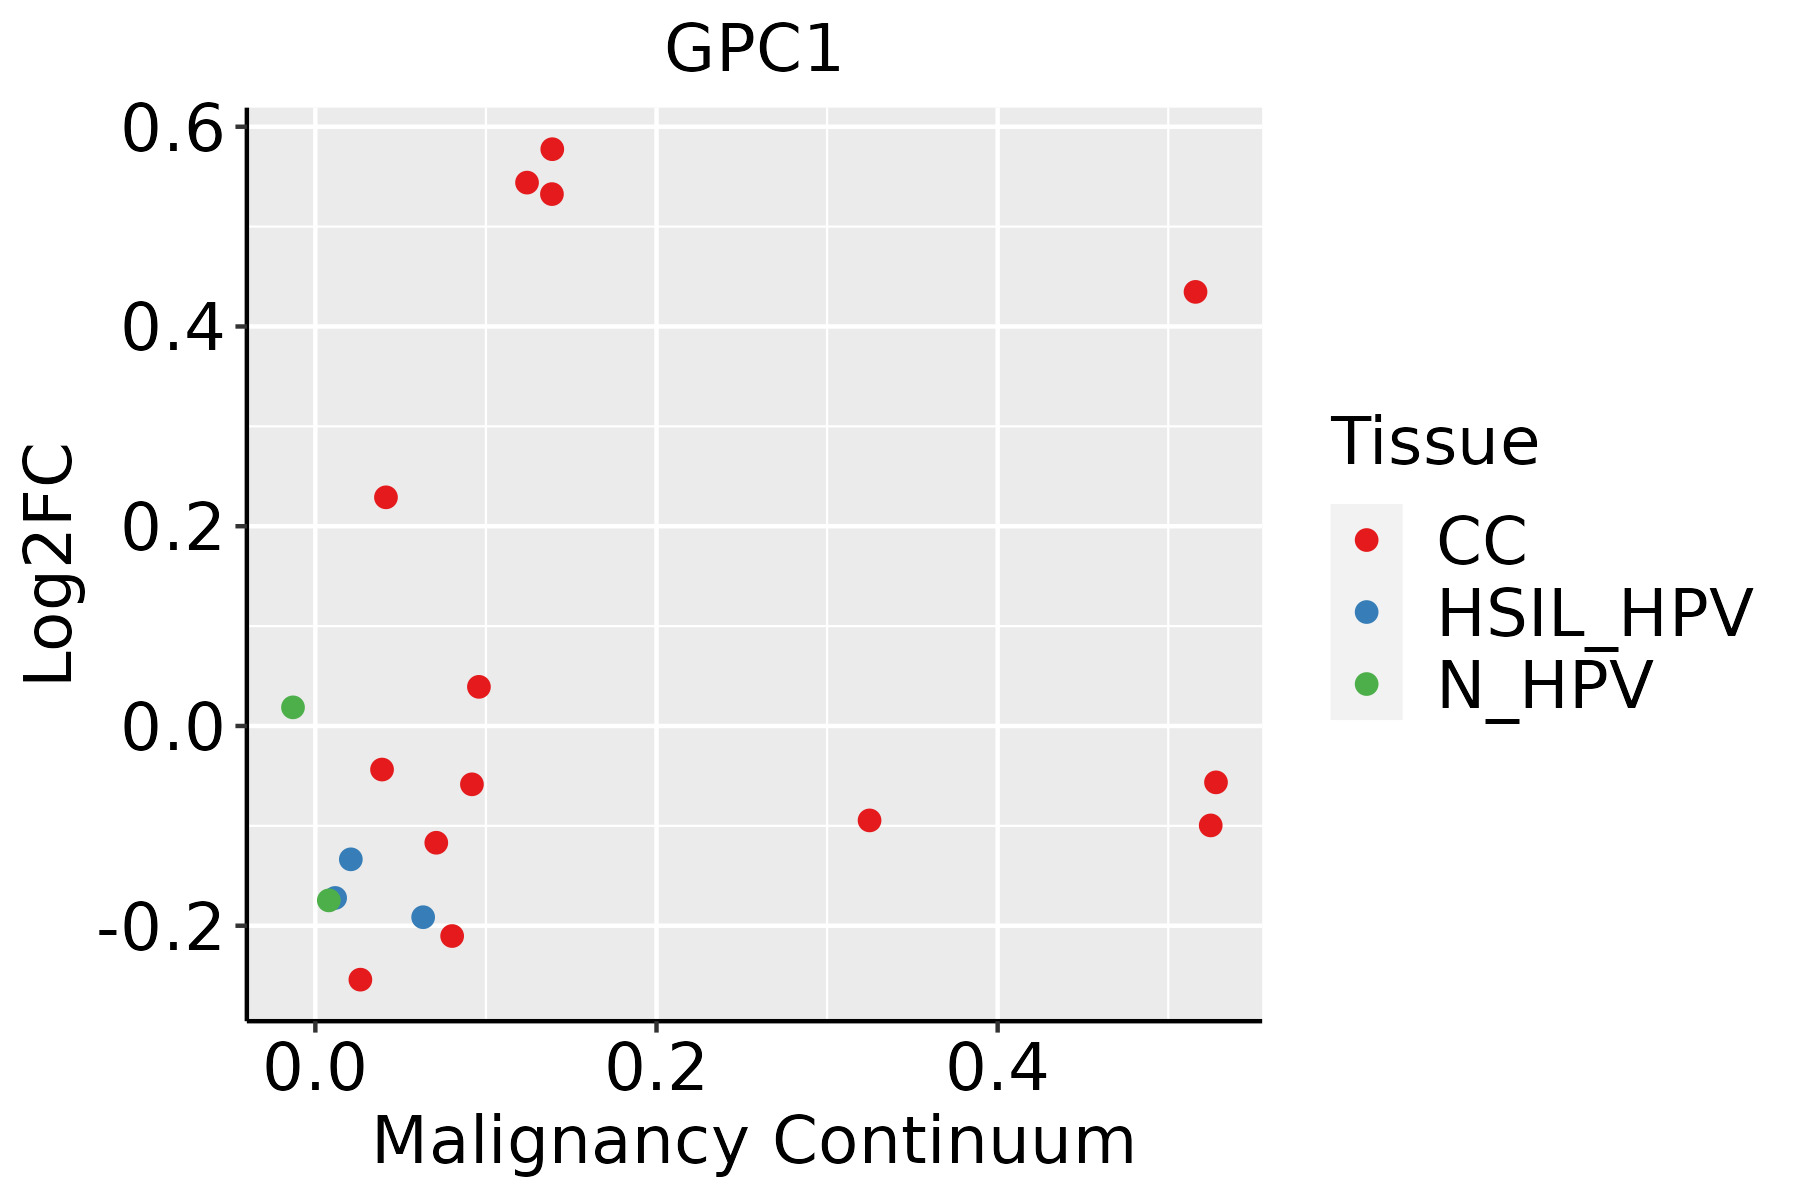 | CC: Cervix cancer |
| HSIL_HPV: HPV-infected high-grade squamous intraepithelial lesions | ||
| N_HPV: HPV-infected normal cervix | ||
| Esophagus |  | ESCC: Esophageal squamous cell carcinoma |
| HGIN: High-grade intraepithelial neoplasias | ||
| LGIN: Low-grade intraepithelial neoplasias | ||
| Liver | 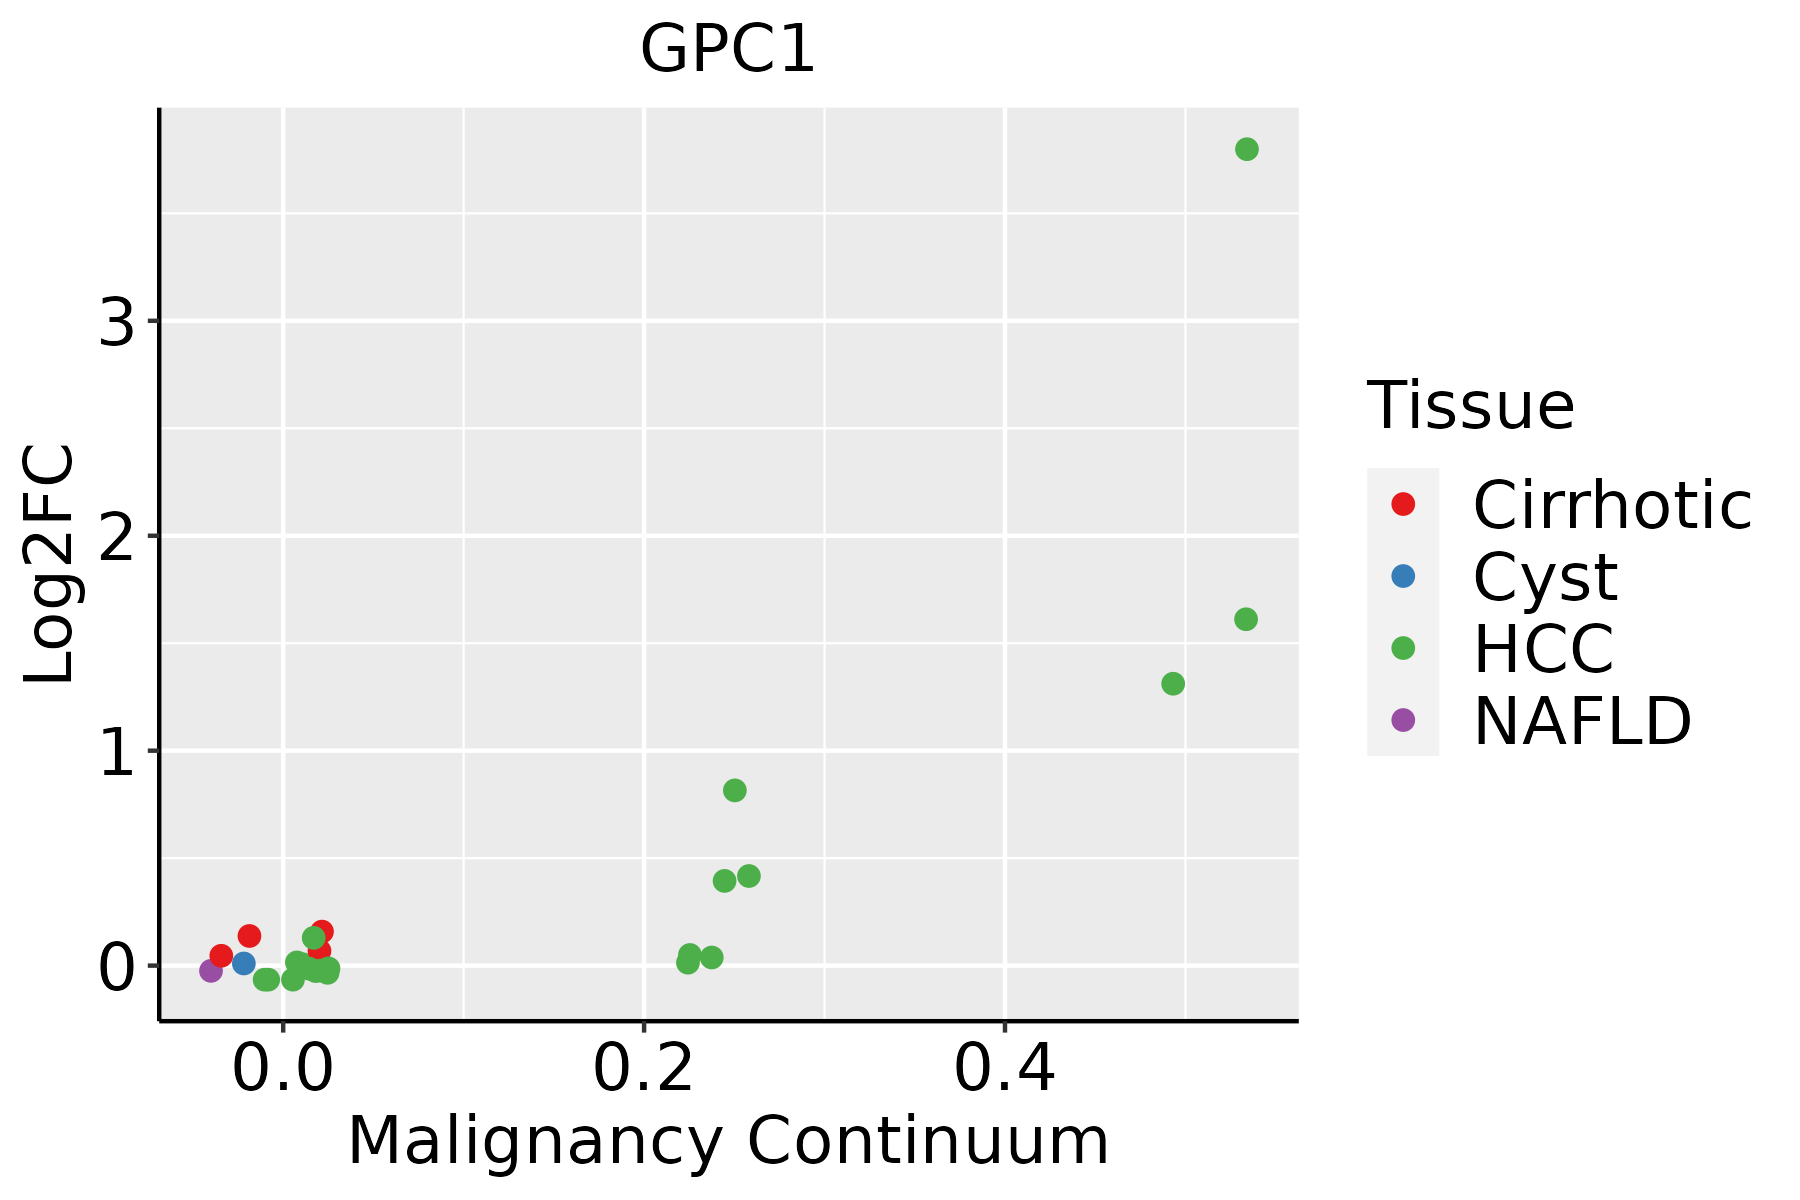 | HCC: Hepatocellular carcinoma |
| NAFLD: Non-alcoholic fatty liver disease | ||
| Oral Cavity |  | EOLP: Erosive Oral lichen planus |
| LP: leukoplakia | ||
| NEOLP: Non-erosive oral lichen planus | ||
| OSCC: Oral squamous cell carcinoma | ||
| Prostate |  | BPH: Benign Prostatic Hyperplasia |
| Skin | 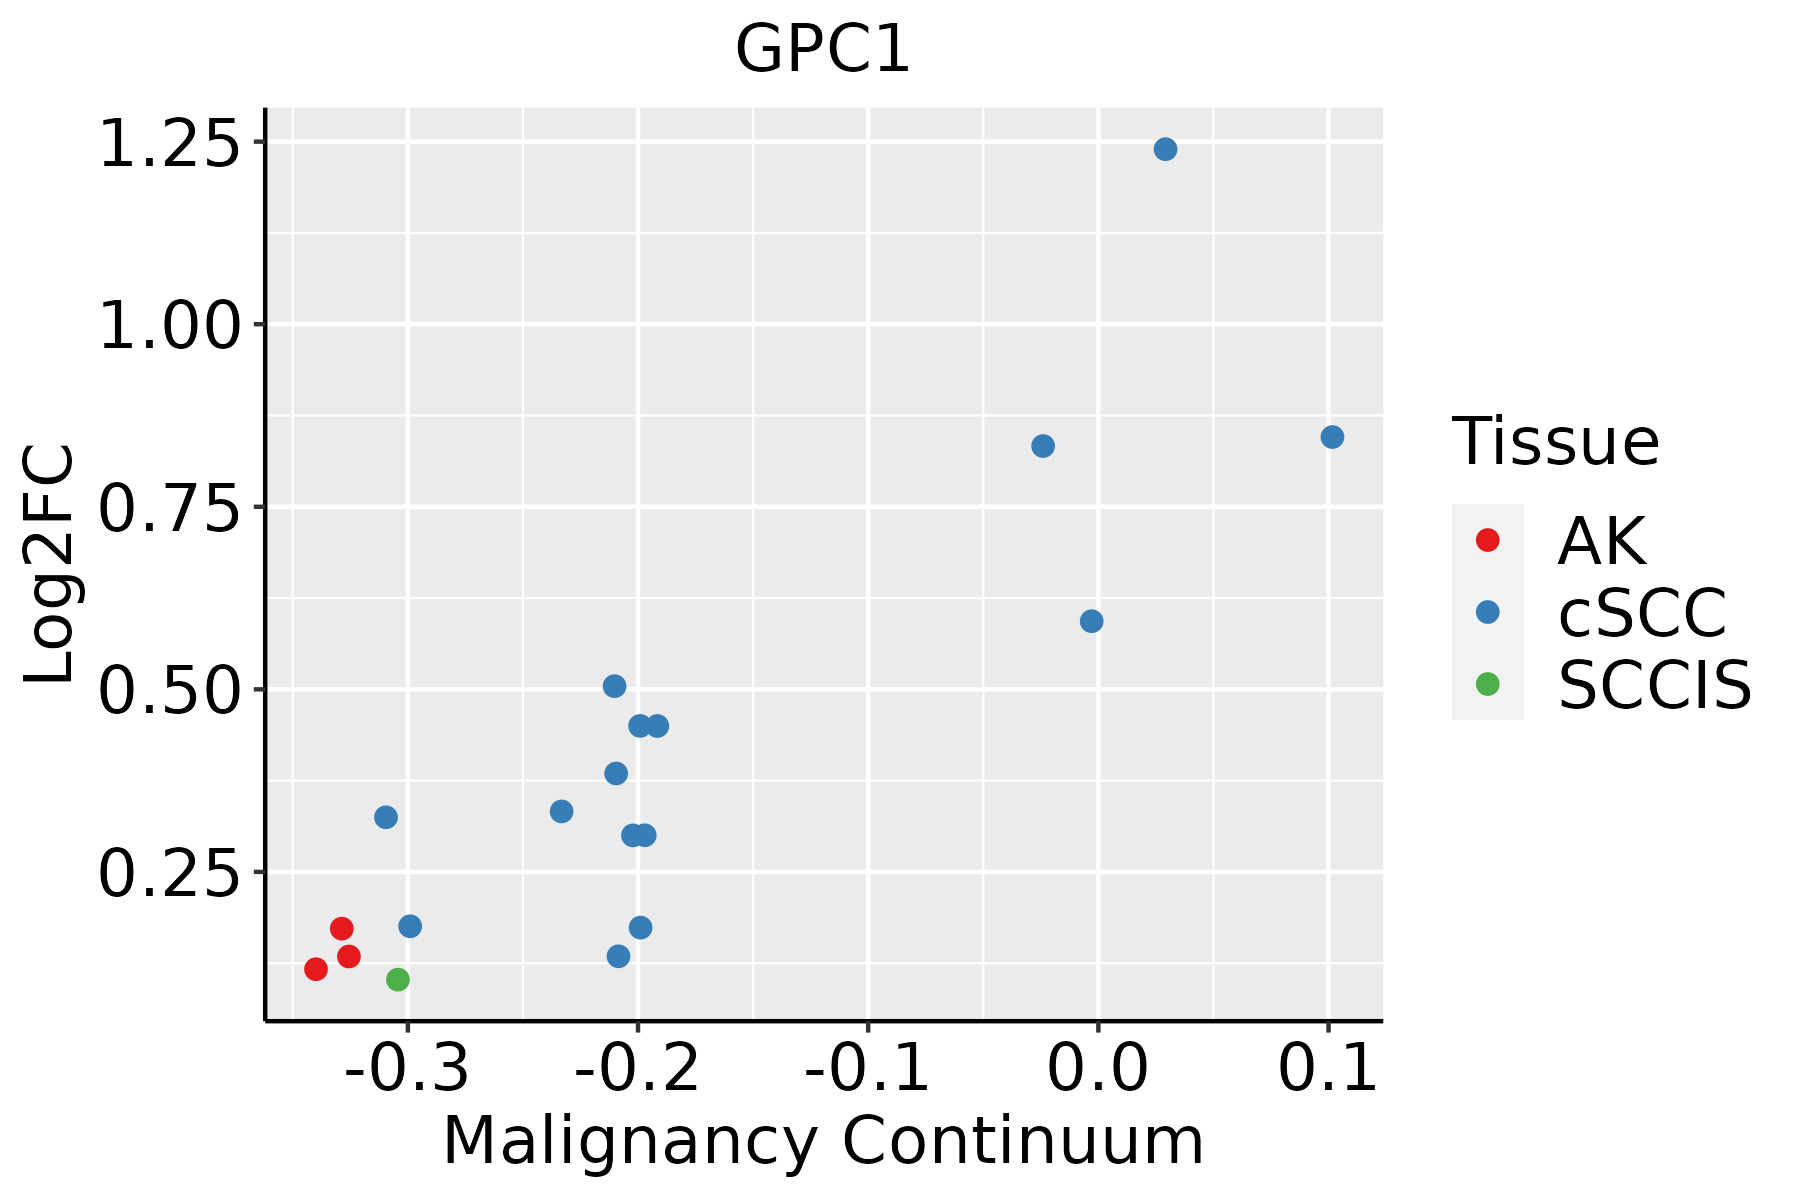 | AK: Actinic keratosis |
| cSCC: Cutaneous squamous cell carcinoma | ||
| SCCIS:squamous cell carcinoma in situ | ||
| Thyroid | 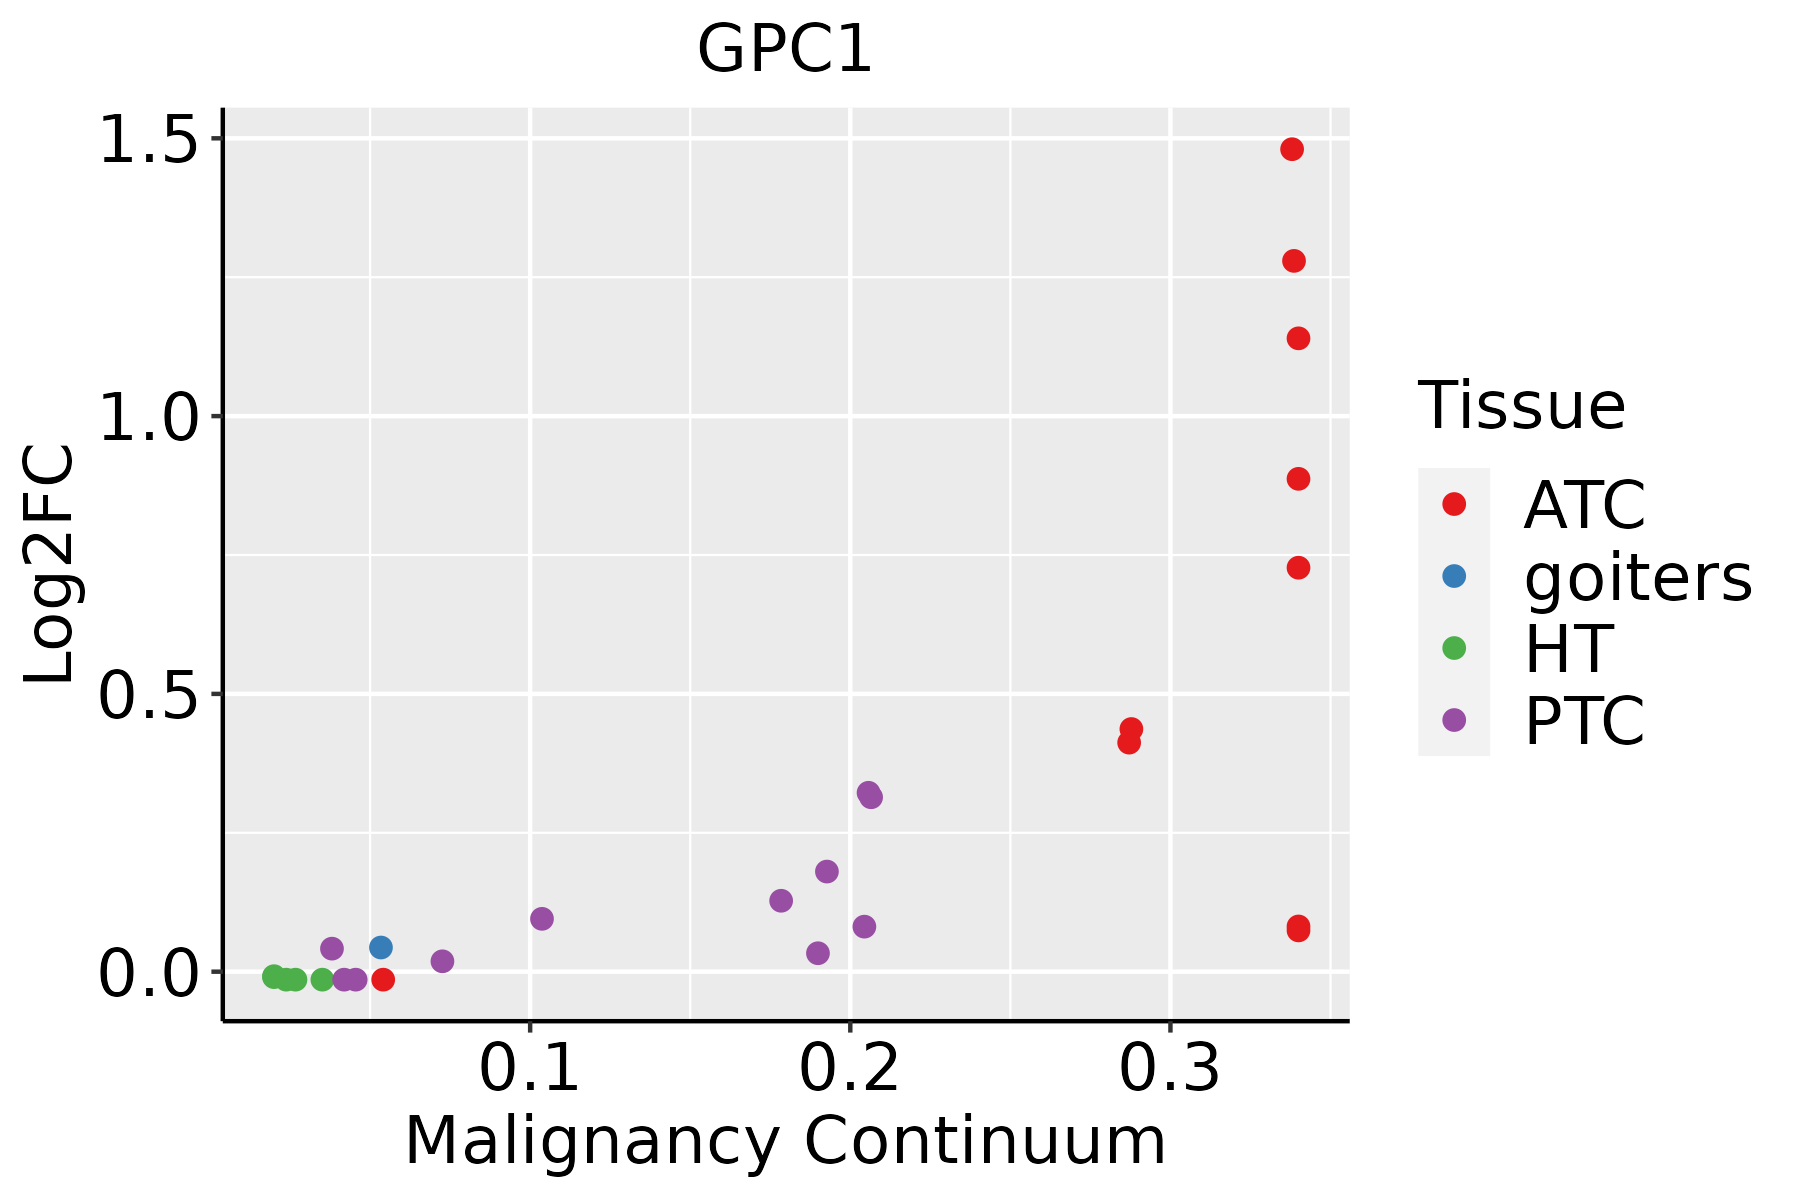 | ATC: Anaplastic thyroid cancer |
| HT: Hashimoto's thyroiditis | ||
| PTC: Papillary thyroid cancer |
| ∗log2FC in expression of this searched gene in stem-like cells from each diseased tissue sample relative to stem-like cells in normal samples in each tissue plotted against the malignancy continuum. Samples are colored based on if they are from different disease stage. |
Top |
Malignant transformation related pathway analysis |
| Find out the enriched GO biological processes and KEGG pathways involved in transition from healthy to precancer to cancer |
| Tissue | Disease Stage | Enriched GO biological Processes |
| Colorectum | AD |  |
| Colorectum | SER |  |
| Colorectum | MSS |  |
| Colorectum | MSI-H |  |
| Colorectum | FAP |  |
| ∗Top 15 enriched GO BP terms are showed in the bar plot of each disease state in each tissue. Each row represents a significant GO biological process which is colored according to the -log10(p.adjust). |
| Page: 1 2 3 4 5 6 7 8 9 |
| GO ID | Tissue | Disease Stage | Description | Gene Ratio | Bg Ratio | pvalue | p.adjust | Count |
| GO:00605375 | Cervix | CC | muscle tissue development | 76/2311 | 403/18723 | 9.76e-05 | 1.27e-03 | 76 |
| GO:00147064 | Cervix | CC | striated muscle tissue development | 72/2311 | 384/18723 | 1.76e-04 | 2.07e-03 | 72 |
| GO:19054758 | Cervix | CC | regulation of protein localization to membrane | 36/2311 | 175/18723 | 1.33e-03 | 1.05e-02 | 36 |
| GO:00075173 | Cervix | CC | muscle organ development | 58/2311 | 327/18723 | 2.73e-03 | 1.85e-02 | 58 |
| GO:00075192 | Cervix | CC | skeletal muscle tissue development | 30/2311 | 155/18723 | 7.97e-03 | 4.18e-02 | 30 |
| GO:00359143 | Cervix | HSIL_HPV | skeletal muscle cell differentiation | 12/737 | 67/18723 | 1.04e-05 | 3.52e-04 | 12 |
| GO:00075191 | Cervix | HSIL_HPV | skeletal muscle tissue development | 16/737 | 155/18723 | 4.13e-04 | 6.25e-03 | 16 |
| GO:00605381 | Cervix | HSIL_HPV | skeletal muscle organ development | 16/737 | 166/18723 | 8.78e-04 | 1.13e-02 | 16 |
| GO:001470611 | Cervix | HSIL_HPV | striated muscle tissue development | 28/737 | 384/18723 | 1.35e-03 | 1.55e-02 | 28 |
| GO:000751711 | Cervix | HSIL_HPV | muscle organ development | 24/737 | 327/18723 | 2.65e-03 | 2.55e-02 | 24 |
| GO:006053712 | Cervix | HSIL_HPV | muscle tissue development | 28/737 | 403/18723 | 2.72e-03 | 2.59e-02 | 28 |
| GO:190547518 | Esophagus | HGIN | regulation of protein localization to membrane | 43/2587 | 175/18723 | 9.45e-05 | 2.03e-03 | 43 |
| GO:00605379 | Esophagus | HGIN | muscle tissue development | 76/2587 | 403/18723 | 2.67e-03 | 2.63e-02 | 76 |
| GO:00147068 | Esophagus | HGIN | striated muscle tissue development | 72/2587 | 384/18723 | 3.94e-03 | 3.56e-02 | 72 |
| GO:190547519 | Esophagus | ESCC | regulation of protein localization to membrane | 117/8552 | 175/18723 | 1.14e-08 | 2.26e-07 | 117 |
| GO:00091002 | Esophagus | ESCC | glycoprotein metabolic process | 226/8552 | 387/18723 | 2.64e-07 | 3.94e-06 | 226 |
| GO:00425524 | Esophagus | ESCC | myelination | 85/8552 | 134/18723 | 2.51e-05 | 2.13e-04 | 85 |
| GO:00072724 | Esophagus | ESCC | ensheathment of neurons | 86/8552 | 136/18723 | 2.68e-05 | 2.24e-04 | 86 |
| GO:00083664 | Esophagus | ESCC | axon ensheathment | 86/8552 | 136/18723 | 2.68e-05 | 2.24e-04 | 86 |
| GO:00420636 | Esophagus | ESCC | gliogenesis | 172/8552 | 301/18723 | 3.75e-05 | 3.04e-04 | 172 |
| Page: 1 2 3 4 5 6 7 |
| Pathway ID | Tissue | Disease Stage | Description | Gene Ratio | Bg Ratio | pvalue | p.adjust | qvalue | Count |
| hsa0541820 | Cervix | CC | Fluid shear stress and atherosclerosis | 50/1267 | 139/8465 | 5.71e-10 | 1.32e-08 | 7.81e-09 | 50 |
| hsa0520516 | Cervix | CC | Proteoglycans in cancer | 60/1267 | 205/8465 | 9.13e-08 | 1.18e-06 | 7.00e-07 | 60 |
| hsa05418110 | Cervix | CC | Fluid shear stress and atherosclerosis | 50/1267 | 139/8465 | 5.71e-10 | 1.32e-08 | 7.81e-09 | 50 |
| hsa0520517 | Cervix | CC | Proteoglycans in cancer | 60/1267 | 205/8465 | 9.13e-08 | 1.18e-06 | 7.00e-07 | 60 |
| hsa0541825 | Cervix | HSIL_HPV | Fluid shear stress and atherosclerosis | 16/459 | 139/8465 | 3.41e-03 | 2.08e-02 | 1.68e-02 | 16 |
| hsa0541835 | Cervix | HSIL_HPV | Fluid shear stress and atherosclerosis | 16/459 | 139/8465 | 3.41e-03 | 2.08e-02 | 1.68e-02 | 16 |
| hsa0541839 | Esophagus | HGIN | Fluid shear stress and atherosclerosis | 42/1383 | 139/8465 | 2.92e-05 | 3.81e-04 | 3.02e-04 | 42 |
| hsa0520528 | Esophagus | HGIN | Proteoglycans in cancer | 47/1383 | 205/8465 | 8.23e-03 | 4.71e-02 | 3.74e-02 | 47 |
| hsa05418115 | Esophagus | HGIN | Fluid shear stress and atherosclerosis | 42/1383 | 139/8465 | 2.92e-05 | 3.81e-04 | 3.02e-04 | 42 |
| hsa05205112 | Esophagus | HGIN | Proteoglycans in cancer | 47/1383 | 205/8465 | 8.23e-03 | 4.71e-02 | 3.74e-02 | 47 |
| hsa05418211 | Esophagus | ESCC | Fluid shear stress and atherosclerosis | 109/4205 | 139/8465 | 2.00e-12 | 3.72e-11 | 1.90e-11 | 109 |
| hsa0520529 | Esophagus | ESCC | Proteoglycans in cancer | 138/4205 | 205/8465 | 1.79e-07 | 1.40e-06 | 7.15e-07 | 138 |
| hsa05418310 | Esophagus | ESCC | Fluid shear stress and atherosclerosis | 109/4205 | 139/8465 | 2.00e-12 | 3.72e-11 | 1.90e-11 | 109 |
| hsa0520537 | Esophagus | ESCC | Proteoglycans in cancer | 138/4205 | 205/8465 | 1.79e-07 | 1.40e-06 | 7.15e-07 | 138 |
| hsa0541822 | Liver | Cirrhotic | Fluid shear stress and atherosclerosis | 62/2530 | 139/8465 | 1.53e-04 | 1.06e-03 | 6.54e-04 | 62 |
| hsa0520510 | Liver | Cirrhotic | Proteoglycans in cancer | 85/2530 | 205/8465 | 2.37e-04 | 1.58e-03 | 9.75e-04 | 85 |
| hsa0541832 | Liver | Cirrhotic | Fluid shear stress and atherosclerosis | 62/2530 | 139/8465 | 1.53e-04 | 1.06e-03 | 6.54e-04 | 62 |
| hsa0520511 | Liver | Cirrhotic | Proteoglycans in cancer | 85/2530 | 205/8465 | 2.37e-04 | 1.58e-03 | 9.75e-04 | 85 |
| hsa0541842 | Liver | HCC | Fluid shear stress and atherosclerosis | 89/4020 | 139/8465 | 5.58e-05 | 2.88e-04 | 1.60e-04 | 89 |
| hsa0520521 | Liver | HCC | Proteoglycans in cancer | 121/4020 | 205/8465 | 5.22e-04 | 2.18e-03 | 1.21e-03 | 121 |
| Page: 1 2 |
Top |
Cell-cell communication analysis |
| Identification of potential cell-cell interactions between two cell types and their ligand-receptor pairs for different disease states |
| Ligand | Receptor | LRpair | Pathway | Tissue | Disease Stage |
| Page: 1 |
Top |
Single-cell gene regulatory network inference analysis |
| Find out the significant the regulons (TFs) and the target genes of each regulon across cell types for different disease states |
| TF | Cell Type | Tissue | Disease Stage | Target Gene | RSS | Regulon Activity |
| ∗The dot plots of a searched regulon are shown for all cell subpopulations in each disease state of each tissue based on the regulon specific score inferred using pySCENIC and by calculating the average expression. |
| Page: 1 |
Top |
Somatic mutation of malignant transformation related genes |
| Annotation of somatic variants for genes involved in malignant transformation |
| Hugo Symbol | Variant Class | Variant Classification | dbSNP RS | HGVSc | HGVSp | HGVSp Short | SWISSPROT | BIOTYPE | SIFT | PolyPhen | Tumor Sample Barcode | Tissue | Histology | Sex | Age | Stage | Therapy Types | Drugs | Outcome |
| GPC1 | SNV | Missense_Mutation | novel | c.1207N>A | p.Glu403Lys | p.E403K | P35052 | protein_coding | tolerated(0.08) | possibly_damaging(0.566) | TCGA-C5-A8XJ-01 | Cervix | cervical & endocervical cancer | Female | >=65 | I/II | Chemotherapy | cisplatin | SD |
| GPC1 | SNV | Missense_Mutation | novel | c.873G>T | p.Arg291Ser | p.R291S | P35052 | protein_coding | deleterious(0.04) | benign(0.062) | TCGA-EK-A2PG-01 | Cervix | cervical & endocervical cancer | Female | >=65 | I/II | Unknown | Unknown | SD |
| GPC1 | SNV | Missense_Mutation | c.1321N>A | p.Glu441Lys | p.E441K | P35052 | protein_coding | deleterious(0) | probably_damaging(0.999) | TCGA-Q1-A73O-01 | Cervix | cervical & endocervical cancer | Female | <65 | I/II | Chemotherapy | cisplatin | CR | |
| GPC1 | SNV | Missense_Mutation | novel | c.1542N>C | p.Leu514Phe | p.L514F | P35052 | protein_coding | tolerated(0.05) | benign(0.214) | TCGA-VS-A953-01 | Cervix | cervical & endocervical cancer | Female | <65 | I/II | Unknown | Unknown | PD |
| GPC1 | deletion | Frame_Shift_Del | c.537delN | p.Gln181SerfsTer71 | p.Q181Sfs*71 | P35052 | protein_coding | TCGA-MA-AA42-01 | Cervix | cervical & endocervical cancer | Female | >=65 | I/II | Unknown | Unknown | SD | |||
| GPC1 | SNV | Missense_Mutation | c.192G>T | p.Gln64His | p.Q64H | P35052 | protein_coding | deleterious(0.02) | probably_damaging(0.992) | TCGA-AD-5900-01 | Colorectum | colon adenocarcinoma | Male | >=65 | I/II | Unknown | Unknown | SD | |
| GPC1 | SNV | Missense_Mutation | rs775242022 | c.1441G>A | p.Ala481Thr | p.A481T | P35052 | protein_coding | tolerated(0.97) | benign(0.05) | TCGA-AD-A5EJ-01 | Colorectum | colon adenocarcinoma | Female | >=65 | I/II | Unknown | Unknown | SD |
| GPC1 | SNV | Missense_Mutation | c.1300N>A | p.Ala434Thr | p.A434T | P35052 | protein_coding | tolerated(0.17) | possibly_damaging(0.53) | TCGA-AZ-6598-01 | Colorectum | colon adenocarcinoma | Female | >=65 | I/II | Unknown | Unknown | SD | |
| GPC1 | SNV | Missense_Mutation | rs751991629 | c.979N>A | p.Ala327Thr | p.A327T | P35052 | protein_coding | tolerated(0.61) | benign(0.058) | TCGA-CK-4951-01 | Colorectum | colon adenocarcinoma | Female | >=65 | I/II | Unknown | Unknown | PD |
| GPC1 | SNV | Missense_Mutation | rs750226747 | c.1162N>A | p.Asp388Asn | p.D388N | P35052 | protein_coding | tolerated(0.06) | benign(0.36) | TCGA-CM-6678-01 | Colorectum | colon adenocarcinoma | Female | <65 | I/II | Chemotherapy | fluorouracil | SD |
| Page: 1 2 3 4 |
Top |
Related drugs of malignant transformation related genes |
| Identification of chemicals and drugs interact with genes involved in malignant transfromation |
| (DGIdb 4.0) |
| Entrez ID | Symbol | Category | Interaction Types | Drug Claim Name | Drug Name | PMIDs |
| Page: 1 |

Copyright 2023-Present -The University of Texas Health Science Center at Houston |