
|
|||||
|
 | |
| |
| |
| |
| |
| |
|
Gene: GPATCH4 |
Gene summary for GPATCH4 |
| Gene information | Species | Human | Gene symbol | GPATCH4 | Gene ID | 54865 |
| Gene name | G-patch domain containing 4 | |
| Gene Alias | GPATC4 | |
| Cytomap | 1q22-q23.1 | |
| Gene Type | protein-coding | GO ID | GO:0003674 | UniProtAcc | A8KAG1 |
Top |
Malignant transformation analysis |
| Identification of the aberrant gene expression in precancerous and cancerous lesions by comparing the gene expression of stem-like cells in diseased tissues with normal stem cells |
| Entrez ID | Symbol | Replicates | Species | Organ | Tissue | Adj P-value | Log2FC | Malignancy |
| 54865 | GPATCH4 | LZE2T | Human | Esophagus | ESCC | 1.15e-04 | 6.44e-01 | 0.082 |
| 54865 | GPATCH4 | LZE4T | Human | Esophagus | ESCC | 6.52e-04 | 2.20e-01 | 0.0811 |
| 54865 | GPATCH4 | LZE7T | Human | Esophagus | ESCC | 1.00e-02 | 2.81e-01 | 0.0667 |
| 54865 | GPATCH4 | LZE8T | Human | Esophagus | ESCC | 1.50e-02 | 1.52e-01 | 0.067 |
| 54865 | GPATCH4 | LZE20T | Human | Esophagus | ESCC | 4.27e-02 | 1.48e-01 | 0.0662 |
| 54865 | GPATCH4 | LZE24T | Human | Esophagus | ESCC | 4.49e-11 | 3.73e-01 | 0.0596 |
| 54865 | GPATCH4 | LZE6T | Human | Esophagus | ESCC | 9.23e-05 | 3.04e-01 | 0.0845 |
| 54865 | GPATCH4 | P1T-E | Human | Esophagus | ESCC | 8.50e-06 | 2.65e-01 | 0.0875 |
| 54865 | GPATCH4 | P2T-E | Human | Esophagus | ESCC | 7.91e-27 | 5.51e-01 | 0.1177 |
| 54865 | GPATCH4 | P4T-E | Human | Esophagus | ESCC | 1.04e-15 | 5.05e-01 | 0.1323 |
| 54865 | GPATCH4 | P5T-E | Human | Esophagus | ESCC | 7.88e-25 | 6.23e-01 | 0.1327 |
| 54865 | GPATCH4 | P8T-E | Human | Esophagus | ESCC | 3.40e-13 | 2.39e-01 | 0.0889 |
| 54865 | GPATCH4 | P9T-E | Human | Esophagus | ESCC | 1.70e-24 | 7.33e-01 | 0.1131 |
| 54865 | GPATCH4 | P10T-E | Human | Esophagus | ESCC | 6.72e-16 | 3.08e-01 | 0.116 |
| 54865 | GPATCH4 | P11T-E | Human | Esophagus | ESCC | 1.38e-08 | 3.81e-01 | 0.1426 |
| 54865 | GPATCH4 | P12T-E | Human | Esophagus | ESCC | 5.08e-16 | 1.98e-01 | 0.1122 |
| 54865 | GPATCH4 | P15T-E | Human | Esophagus | ESCC | 6.84e-20 | 5.68e-01 | 0.1149 |
| 54865 | GPATCH4 | P16T-E | Human | Esophagus | ESCC | 9.56e-17 | 3.57e-01 | 0.1153 |
| 54865 | GPATCH4 | P17T-E | Human | Esophagus | ESCC | 1.61e-09 | 7.31e-01 | 0.1278 |
| 54865 | GPATCH4 | P20T-E | Human | Esophagus | ESCC | 3.32e-13 | 4.09e-01 | 0.1124 |
| Page: 1 2 3 4 5 6 |
| Tissue | Expression Dynamics | Abbreviation |
| Esophagus | 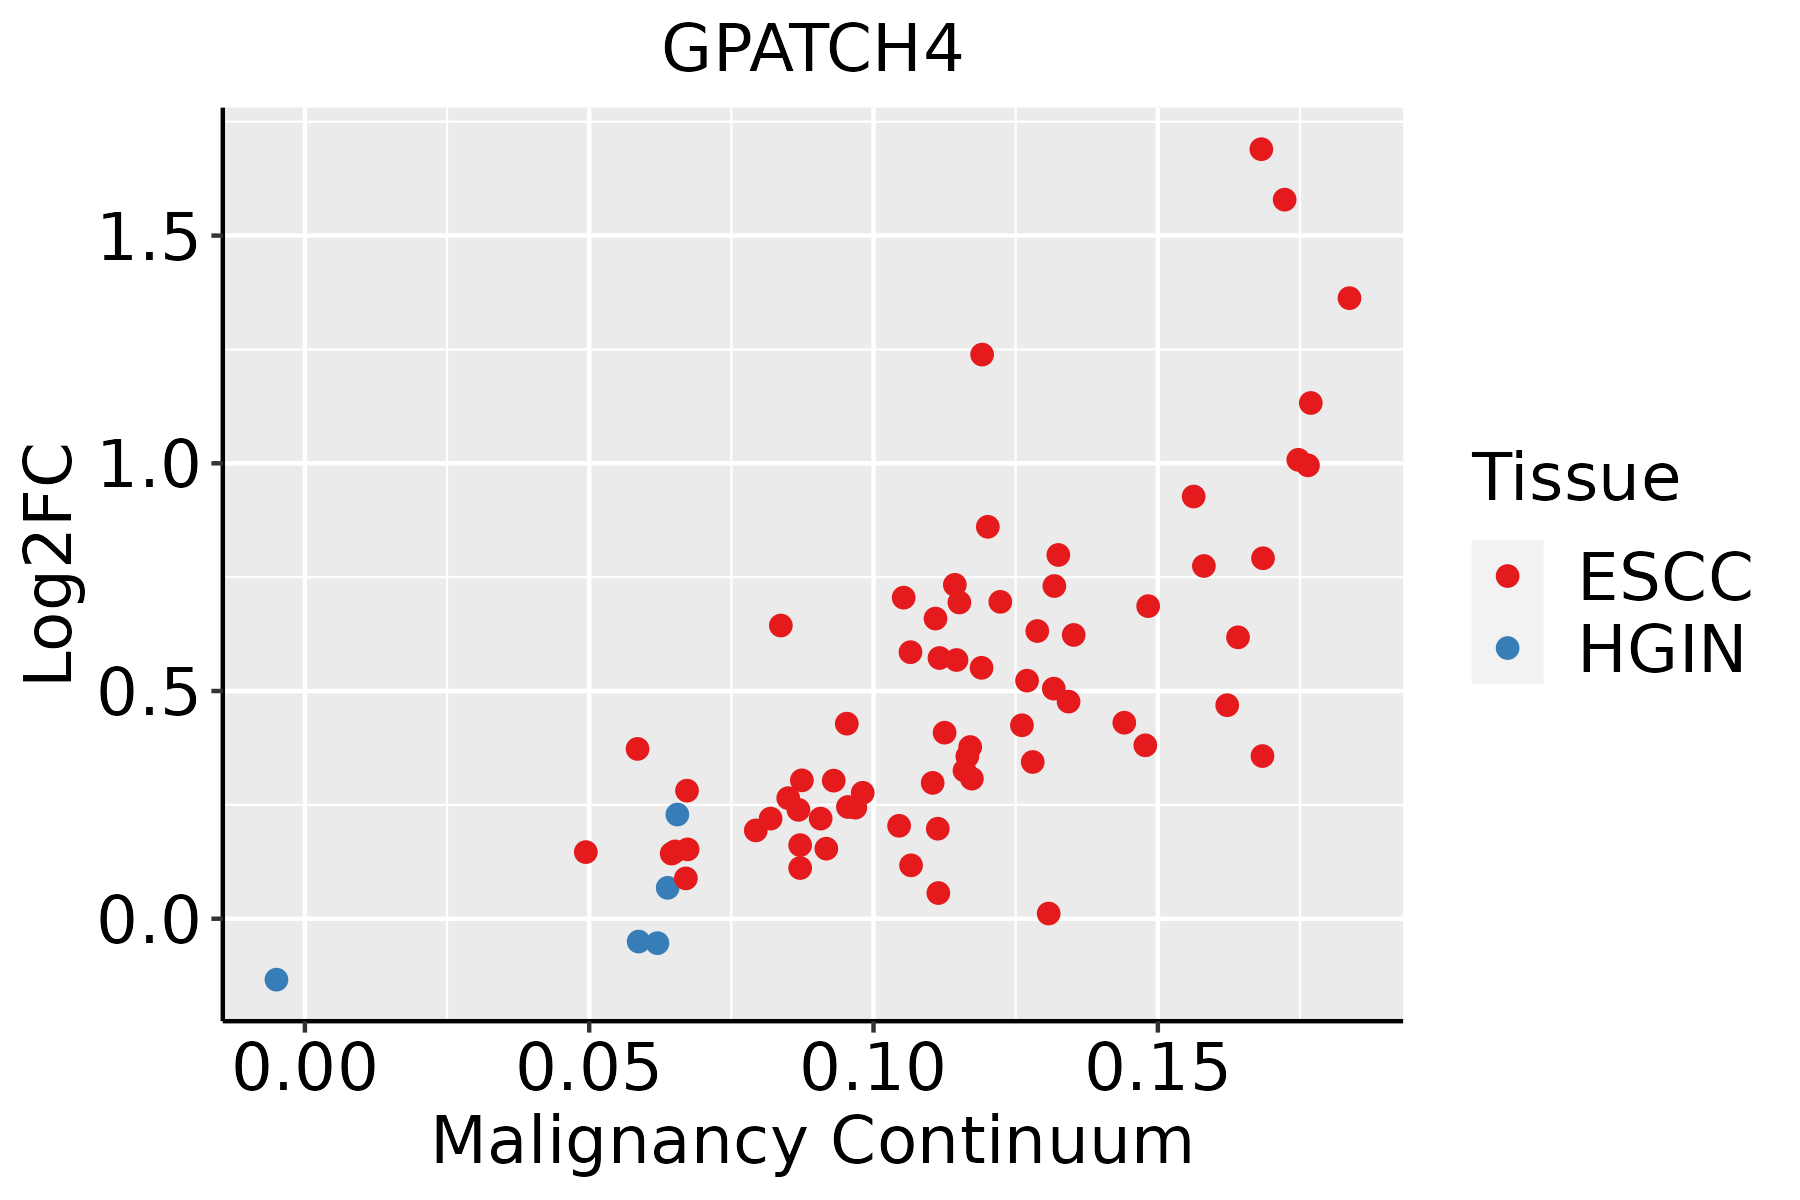 | ESCC: Esophageal squamous cell carcinoma |
| HGIN: High-grade intraepithelial neoplasias | ||
| LGIN: Low-grade intraepithelial neoplasias | ||
| Liver | 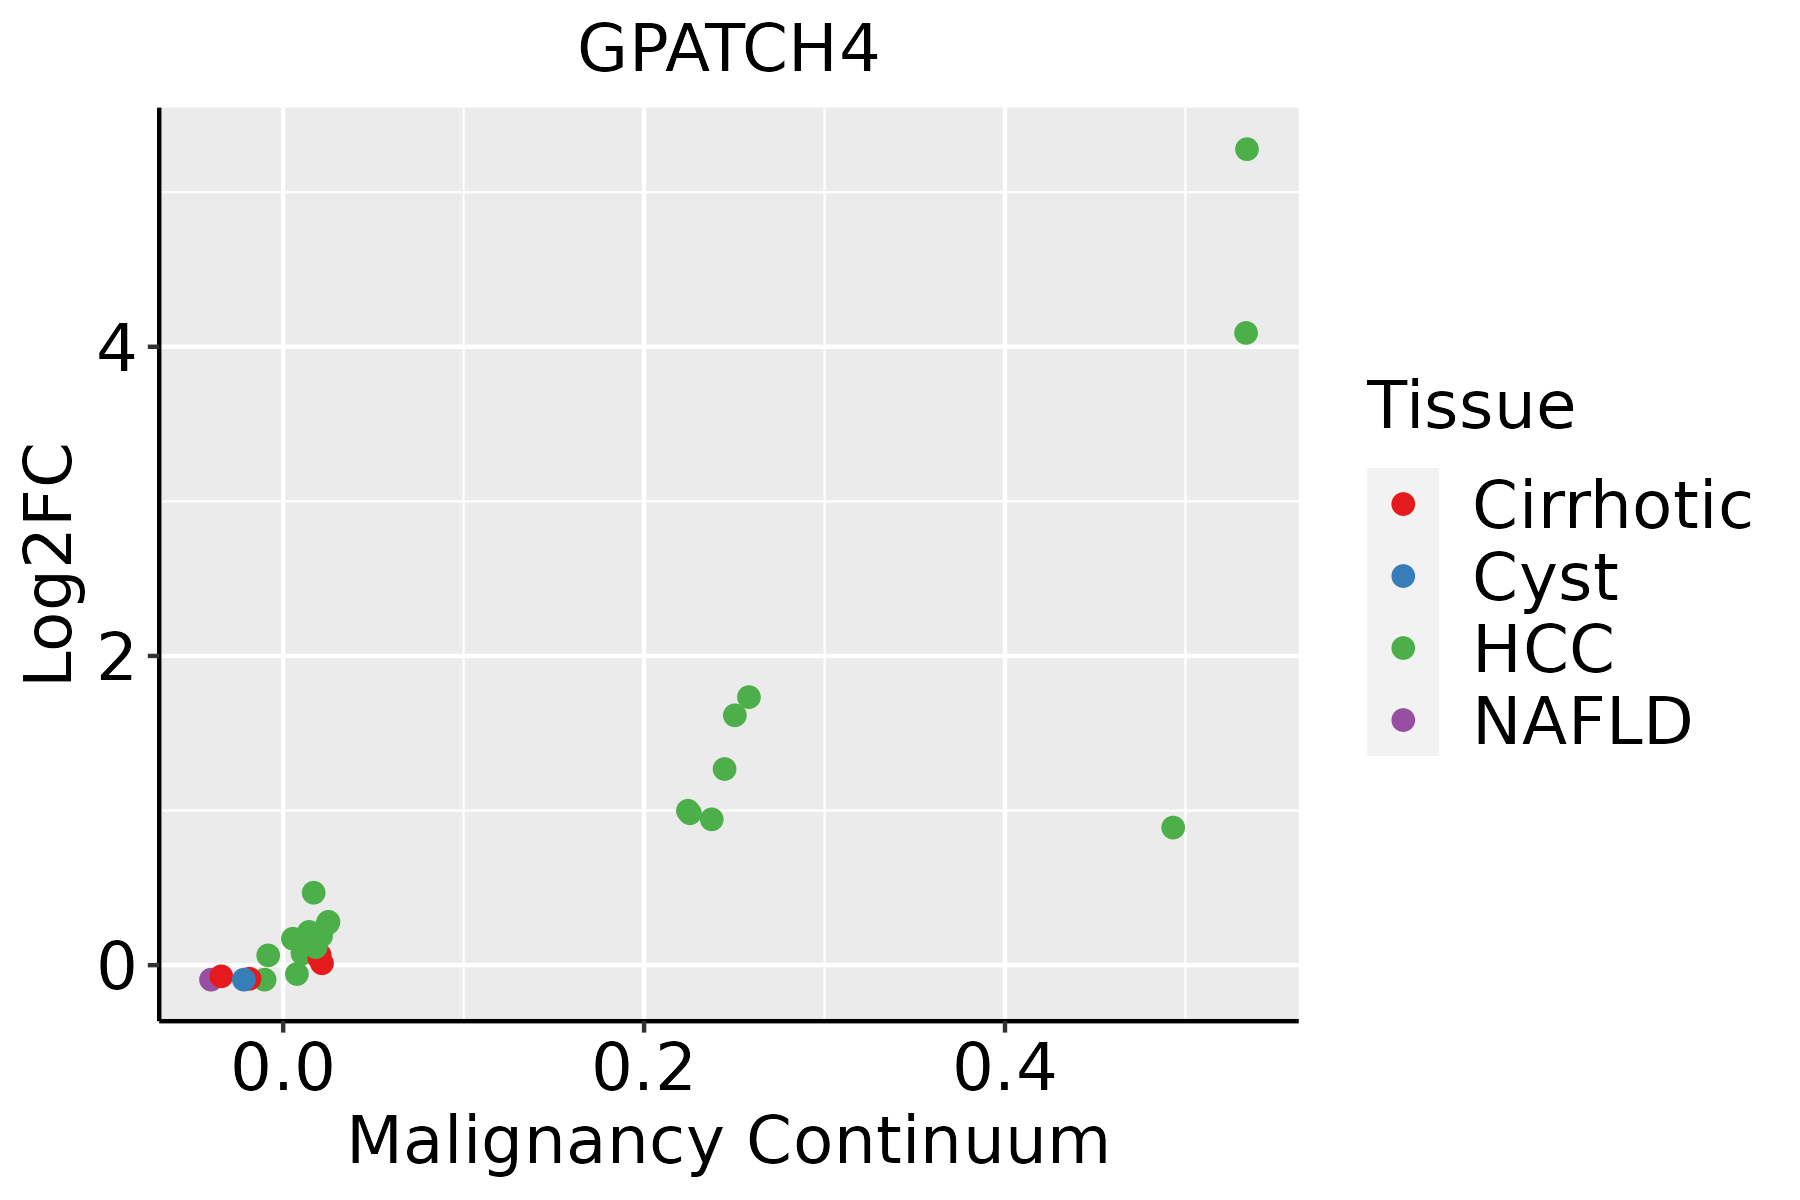 | HCC: Hepatocellular carcinoma |
| NAFLD: Non-alcoholic fatty liver disease | ||
| Oral Cavity | 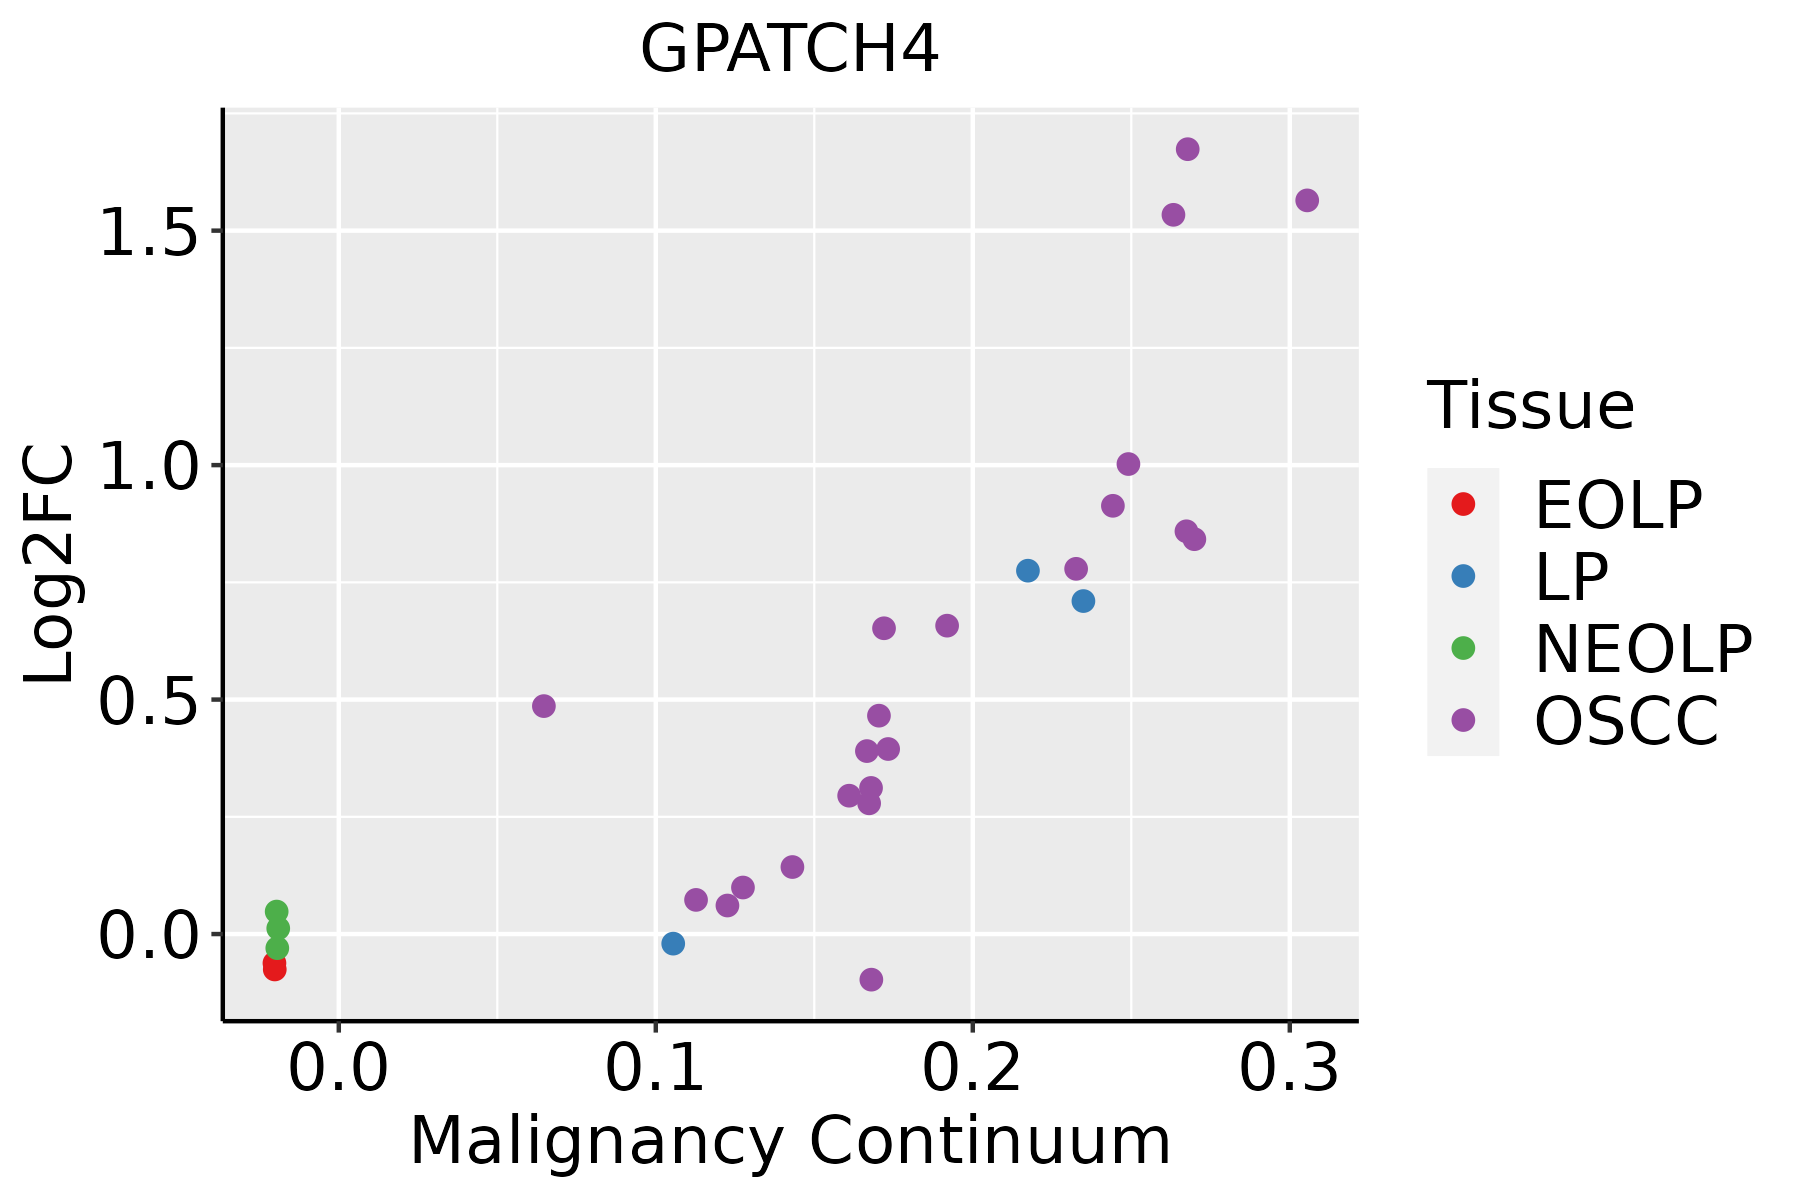 | EOLP: Erosive Oral lichen planus |
| LP: leukoplakia | ||
| NEOLP: Non-erosive oral lichen planus | ||
| OSCC: Oral squamous cell carcinoma | ||
| Prostate | 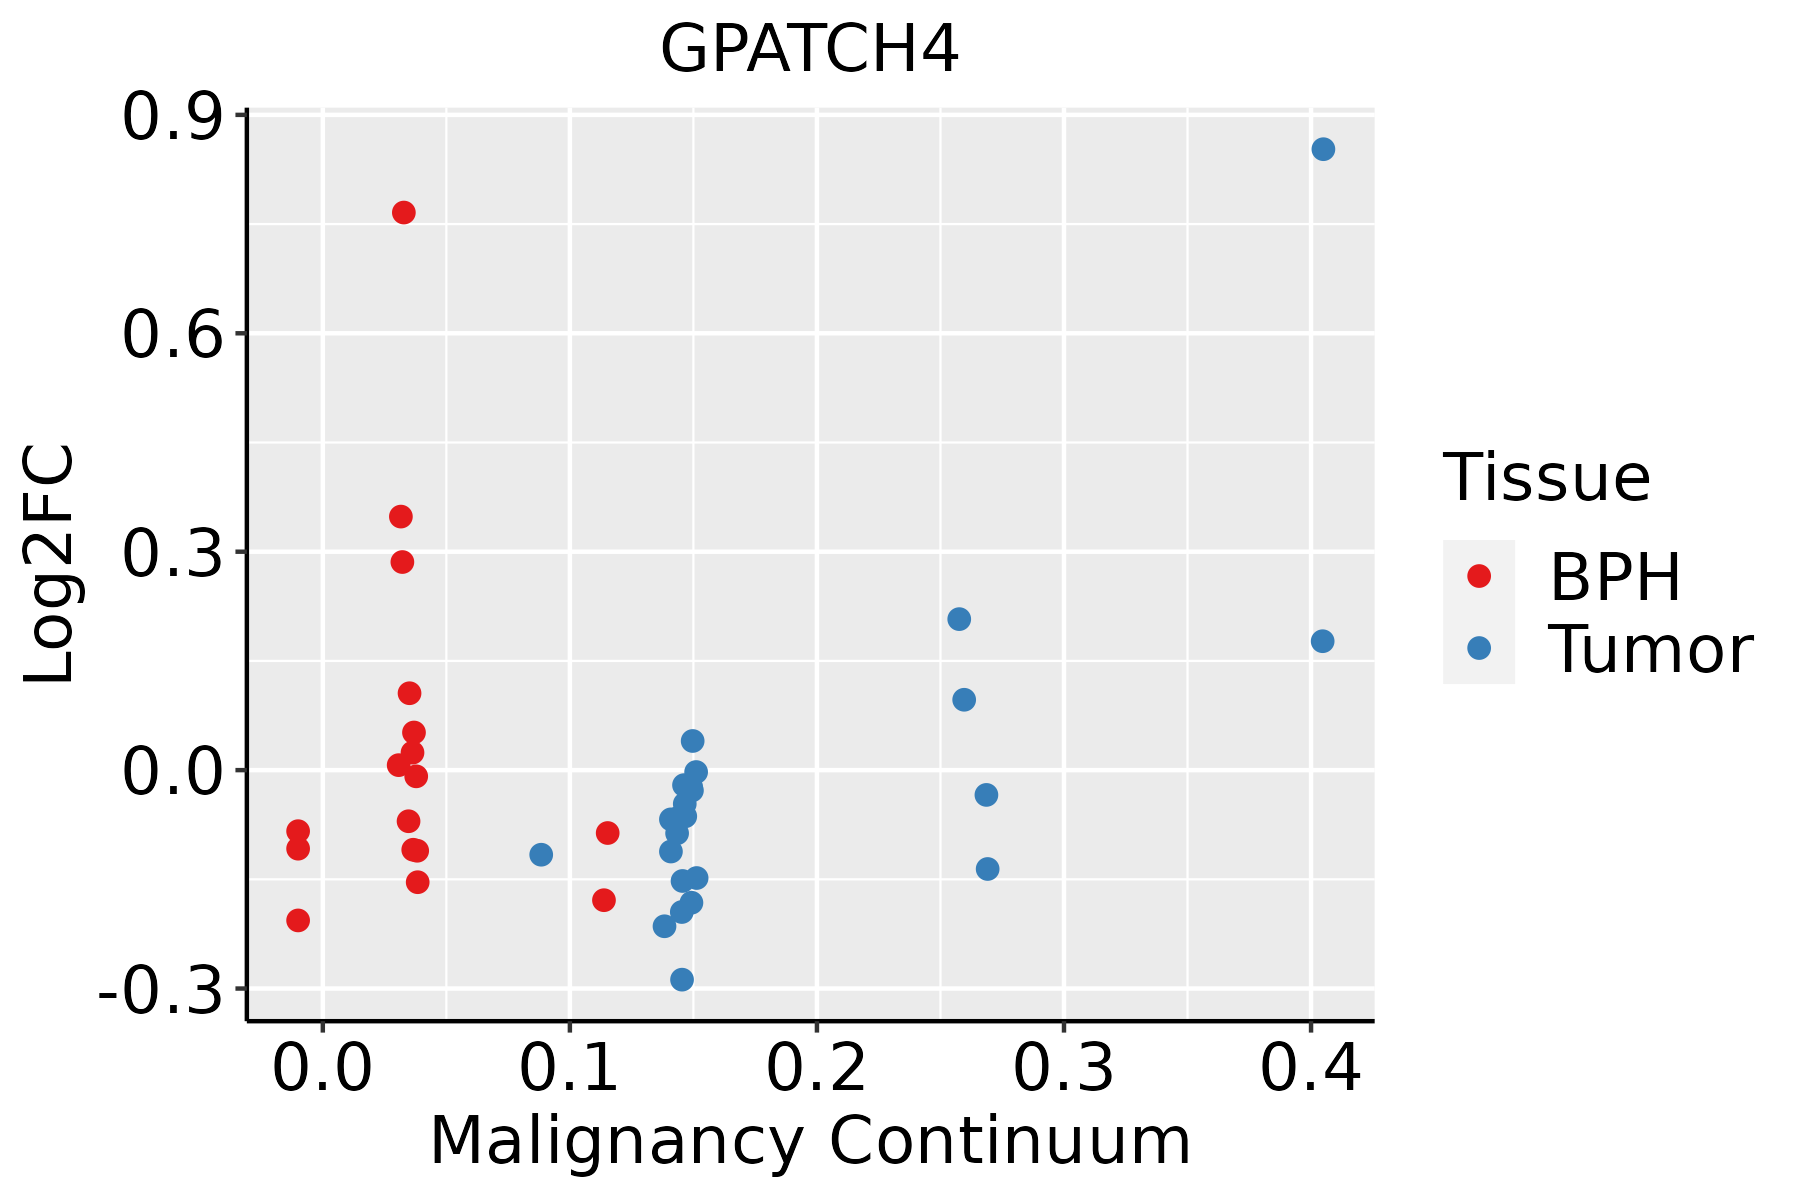 | BPH: Benign Prostatic Hyperplasia |
| Skin | 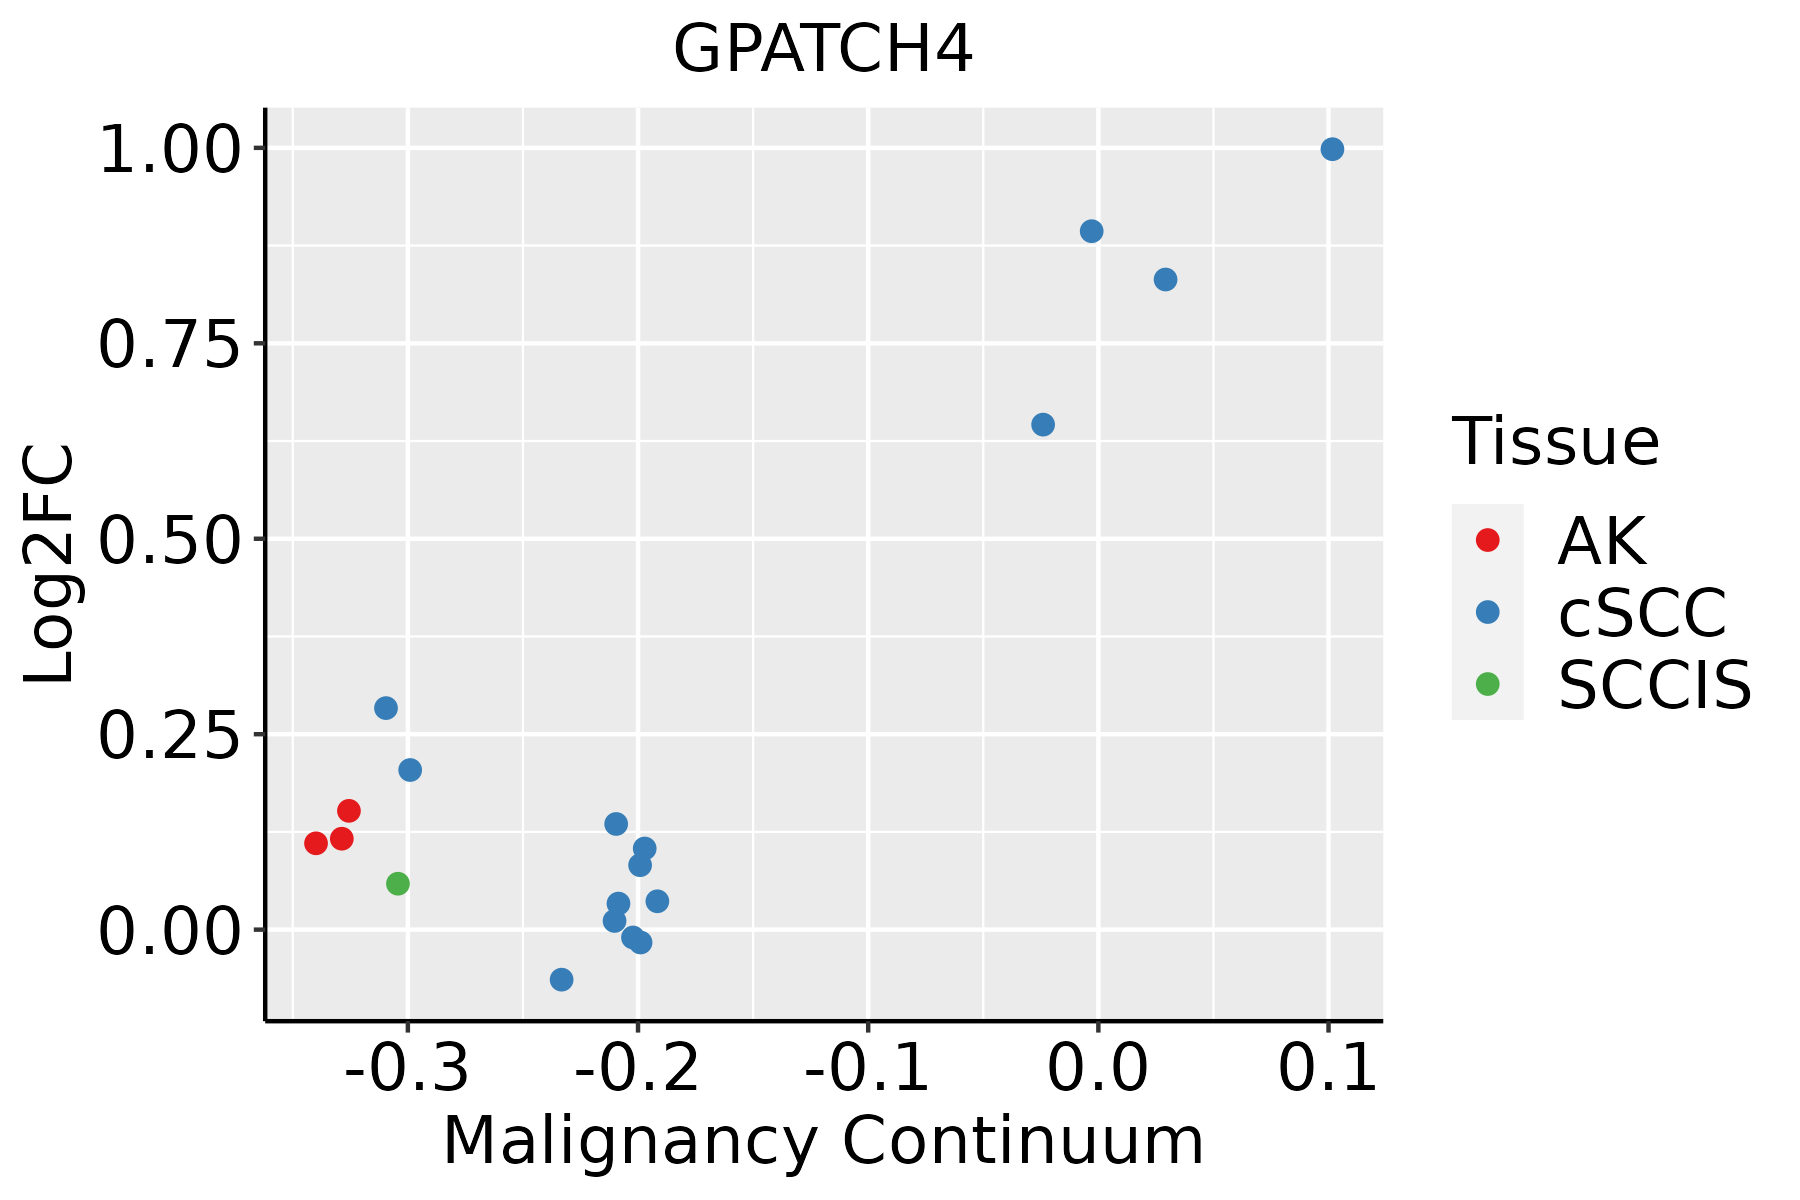 | AK: Actinic keratosis |
| cSCC: Cutaneous squamous cell carcinoma | ||
| SCCIS:squamous cell carcinoma in situ | ||
| Thyroid | 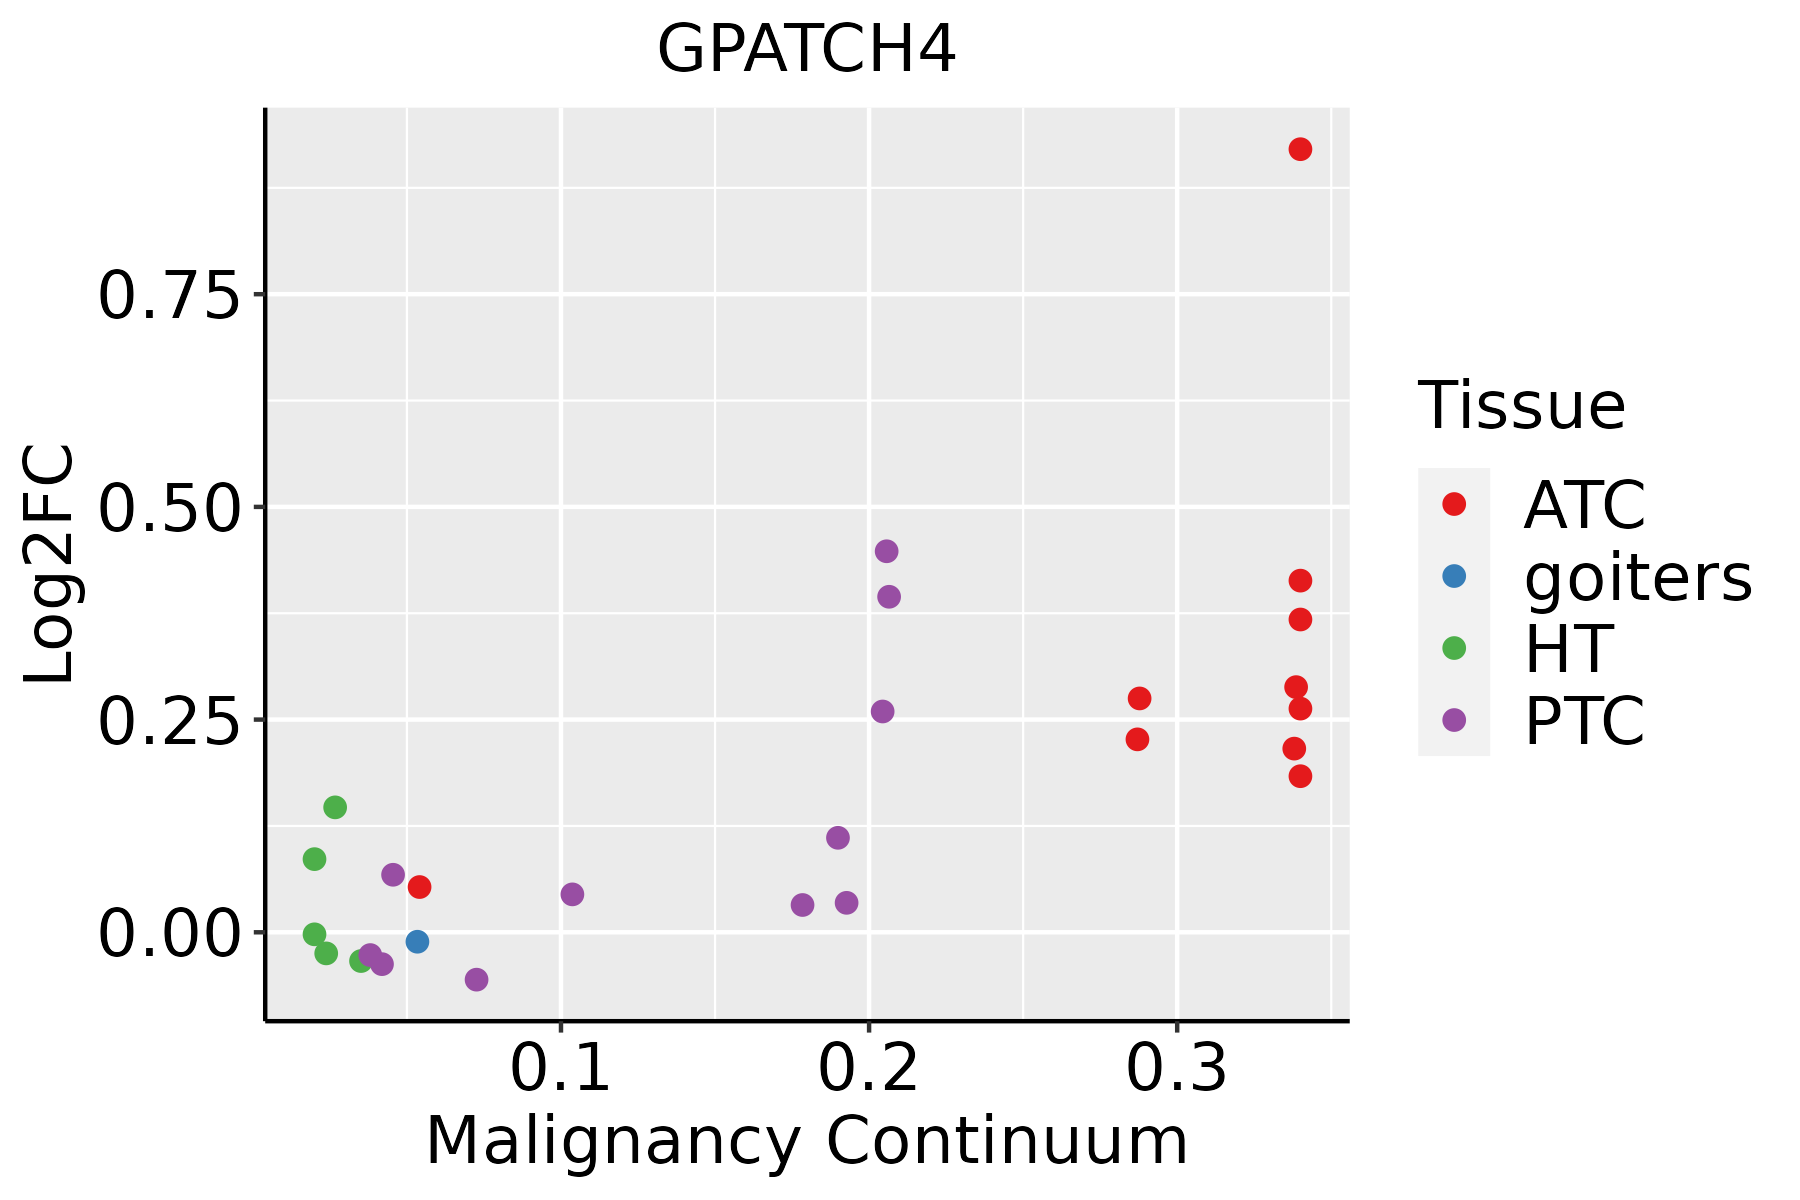 | ATC: Anaplastic thyroid cancer |
| HT: Hashimoto's thyroiditis | ||
| PTC: Papillary thyroid cancer |
| ∗log2FC in expression of this searched gene in stem-like cells from each diseased tissue sample relative to stem-like cells in normal samples in each tissue plotted against the malignancy continuum. Samples are colored based on if they are from different disease stage. |
Top |
Malignant transformation related pathway analysis |
| Find out the enriched GO biological processes and KEGG pathways involved in transition from healthy to precancer to cancer |
| Tissue | Disease Stage | Enriched GO biological Processes |
| Colorectum | AD |  |
| Colorectum | SER |  |
| Colorectum | MSS |  |
| Colorectum | MSI-H |  |
| Colorectum | FAP |  |
| ∗Top 15 enriched GO BP terms are showed in the bar plot of each disease state in each tissue. Each row represents a significant GO biological process which is colored according to the -log10(p.adjust). |
| Page: 1 2 3 4 5 6 7 8 9 |
| GO ID | Tissue | Disease Stage | Description | Gene Ratio | Bg Ratio | pvalue | p.adjust | Count |
| Page: 1 |
| Pathway ID | Tissue | Disease Stage | Description | Gene Ratio | Bg Ratio | pvalue | p.adjust | qvalue | Count |
| Page: 1 |
Top |
Cell-cell communication analysis |
| Identification of potential cell-cell interactions between two cell types and their ligand-receptor pairs for different disease states |
| Ligand | Receptor | LRpair | Pathway | Tissue | Disease Stage |
| Page: 1 |
Top |
Single-cell gene regulatory network inference analysis |
| Find out the significant the regulons (TFs) and the target genes of each regulon across cell types for different disease states |
| TF | Cell Type | Tissue | Disease Stage | Target Gene | RSS | Regulon Activity |
| ∗The dot plots of a searched regulon are shown for all cell subpopulations in each disease state of each tissue based on the regulon specific score inferred using pySCENIC and by calculating the average expression. |
| Page: 1 |
Top |
Somatic mutation of malignant transformation related genes |
| Annotation of somatic variants for genes involved in malignant transformation |
| Hugo Symbol | Variant Class | Variant Classification | dbSNP RS | HGVSc | HGVSp | HGVSp Short | SWISSPROT | BIOTYPE | SIFT | PolyPhen | Tumor Sample Barcode | Tissue | Histology | Sex | Age | Stage | Therapy Types | Drugs | Outcome |
| GPATCH4 | SNV | Missense_Mutation | c.607N>C | p.Glu203Gln | p.E203Q | protein_coding | tolerated(0.06) | benign(0.13) | TCGA-AO-A0J9-01 | Breast | breast invasive carcinoma | Female | <65 | III/IV | Chemotherapy | cyclophosphamide | PD | ||
| GPATCH4 | SNV | Missense_Mutation | c.684T>A | p.Asn228Lys | p.N228K | protein_coding | tolerated(0.08) | benign(0) | TCGA-BH-A1ET-01 | Breast | breast invasive carcinoma | Female | <65 | I/II | Unknown | Unknown | SD | ||
| GPATCH4 | SNV | Missense_Mutation | c.266N>T | p.Gly89Val | p.G89V | protein_coding | deleterious(0) | possibly_damaging(0.829) | TCGA-E2-A152-01 | Breast | breast invasive carcinoma | Female | <65 | I/II | Targeted Molecular therapy | trastuzumab | PD | ||
| GPATCH4 | deletion | Frame_Shift_Del | rs867255433 | c.885delG | p.Lys296ArgfsTer34 | p.K296Rfs*34 | protein_coding | TCGA-D8-A27V-01 | Breast | breast invasive carcinoma | Female | <65 | I/II | Hormone Therapy | tamoxiphen | SD | |||
| GPATCH4 | insertion | In_Frame_Ins | novel | c.250_251insTGG | p.Val83dup | p.V83dup | protein_coding | TCGA-E9-A1NF-01 | Breast | breast invasive carcinoma | Female | <65 | I/II | Chemotherapy | doxorubicin | PD | |||
| GPATCH4 | SNV | Missense_Mutation | novel | c.126C>G | p.Ile42Met | p.I42M | protein_coding | deleterious(0) | probably_damaging(1) | TCGA-VS-A958-01 | Cervix | cervical & endocervical cancer | Female | <65 | I/II | Chemotherapy | cisplatin | CR | |
| GPATCH4 | deletion | Frame_Shift_Del | c.629delN | p.Lys210ArgfsTer73 | p.K210Rfs*73 | protein_coding | TCGA-AA-3530-01 | Colorectum | colon adenocarcinoma | Male | >=65 | I/II | Unknown | Unknown | SD | ||||
| GPATCH4 | deletion | Frame_Shift_Del | c.629delA | p.Lys210ArgfsTer73 | p.K210Rfs*73 | protein_coding | TCGA-AA-A02R-01 | Colorectum | colon adenocarcinoma | Female | >=65 | I/II | Unknown | Unknown | PD | ||||
| GPATCH4 | deletion | Frame_Shift_Del | c.629delA | p.Lys210ArgfsTer73 | p.K210Rfs*73 | protein_coding | TCGA-AY-6386-01 | Colorectum | colon adenocarcinoma | Female | >=65 | III/IV | Chemotherapy | 5-fu | SD | ||||
| GPATCH4 | SNV | Missense_Mutation | novel | c.200N>G | p.Asn67Ser | p.N67S | protein_coding | tolerated(0.16) | benign(0.255) | TCGA-A5-A0G2-01 | Endometrium | uterine corpus endometrioid carcinoma | Female | <65 | III/IV | Unknown | Unknown | SD |
| Page: 1 2 3 4 5 6 |
Top |
Related drugs of malignant transformation related genes |
| Identification of chemicals and drugs interact with genes involved in malignant transfromation |
| (DGIdb 4.0) |
| Entrez ID | Symbol | Category | Interaction Types | Drug Claim Name | Drug Name | PMIDs |
| Page: 1 |

Copyright 2023-Present -The University of Texas Health Science Center at Houston |