
|
|||||
|
 | |
| |
| |
| |
| |
| |
|
Gene: GPATCH3 |
Gene summary for GPATCH3 |
| Gene information | Species | Human | Gene symbol | GPATCH3 | Gene ID | 63906 |
| Gene name | G-patch domain containing 3 | |
| Gene Alias | GPATC3 | |
| Cytomap | 1p36.11 | |
| Gene Type | protein-coding | GO ID | GO:0001816 | UniProtAcc | Q96I76 |
Top |
Malignant transformation analysis |
| Identification of the aberrant gene expression in precancerous and cancerous lesions by comparing the gene expression of stem-like cells in diseased tissues with normal stem cells |
| Entrez ID | Symbol | Replicates | Species | Organ | Tissue | Adj P-value | Log2FC | Malignancy |
| 63906 | GPATCH3 | LZE4T | Human | Esophagus | ESCC | 3.84e-05 | 1.51e-01 | 0.0811 |
| 63906 | GPATCH3 | LZE7T | Human | Esophagus | ESCC | 1.11e-02 | 2.02e-01 | 0.0667 |
| 63906 | GPATCH3 | LZE20T | Human | Esophagus | ESCC | 2.95e-03 | 1.53e-01 | 0.0662 |
| 63906 | GPATCH3 | LZE24T | Human | Esophagus | ESCC | 5.68e-10 | 2.61e-01 | 0.0596 |
| 63906 | GPATCH3 | P1T-E | Human | Esophagus | ESCC | 1.35e-08 | 2.48e-01 | 0.0875 |
| 63906 | GPATCH3 | P2T-E | Human | Esophagus | ESCC | 1.13e-16 | 3.15e-01 | 0.1177 |
| 63906 | GPATCH3 | P4T-E | Human | Esophagus | ESCC | 2.29e-08 | 1.92e-01 | 0.1323 |
| 63906 | GPATCH3 | P5T-E | Human | Esophagus | ESCC | 2.93e-15 | 2.56e-01 | 0.1327 |
| 63906 | GPATCH3 | P8T-E | Human | Esophagus | ESCC | 9.56e-08 | 1.53e-01 | 0.0889 |
| 63906 | GPATCH3 | P9T-E | Human | Esophagus | ESCC | 7.71e-05 | 1.04e-01 | 0.1131 |
| 63906 | GPATCH3 | P10T-E | Human | Esophagus | ESCC | 2.06e-08 | 1.80e-01 | 0.116 |
| 63906 | GPATCH3 | P11T-E | Human | Esophagus | ESCC | 1.84e-04 | 2.83e-01 | 0.1426 |
| 63906 | GPATCH3 | P12T-E | Human | Esophagus | ESCC | 7.31e-14 | 2.38e-01 | 0.1122 |
| 63906 | GPATCH3 | P15T-E | Human | Esophagus | ESCC | 9.74e-13 | 1.86e-01 | 0.1149 |
| 63906 | GPATCH3 | P16T-E | Human | Esophagus | ESCC | 4.44e-08 | 1.82e-01 | 0.1153 |
| 63906 | GPATCH3 | P19T-E | Human | Esophagus | ESCC | 1.10e-02 | 2.06e-01 | 0.1662 |
| 63906 | GPATCH3 | P20T-E | Human | Esophagus | ESCC | 4.60e-14 | 3.41e-01 | 0.1124 |
| 63906 | GPATCH3 | P21T-E | Human | Esophagus | ESCC | 1.23e-20 | 3.85e-01 | 0.1617 |
| 63906 | GPATCH3 | P22T-E | Human | Esophagus | ESCC | 9.35e-10 | 1.91e-01 | 0.1236 |
| 63906 | GPATCH3 | P23T-E | Human | Esophagus | ESCC | 2.66e-20 | 4.45e-01 | 0.108 |
| Page: 1 2 3 4 |
| Tissue | Expression Dynamics | Abbreviation |
| Esophagus | 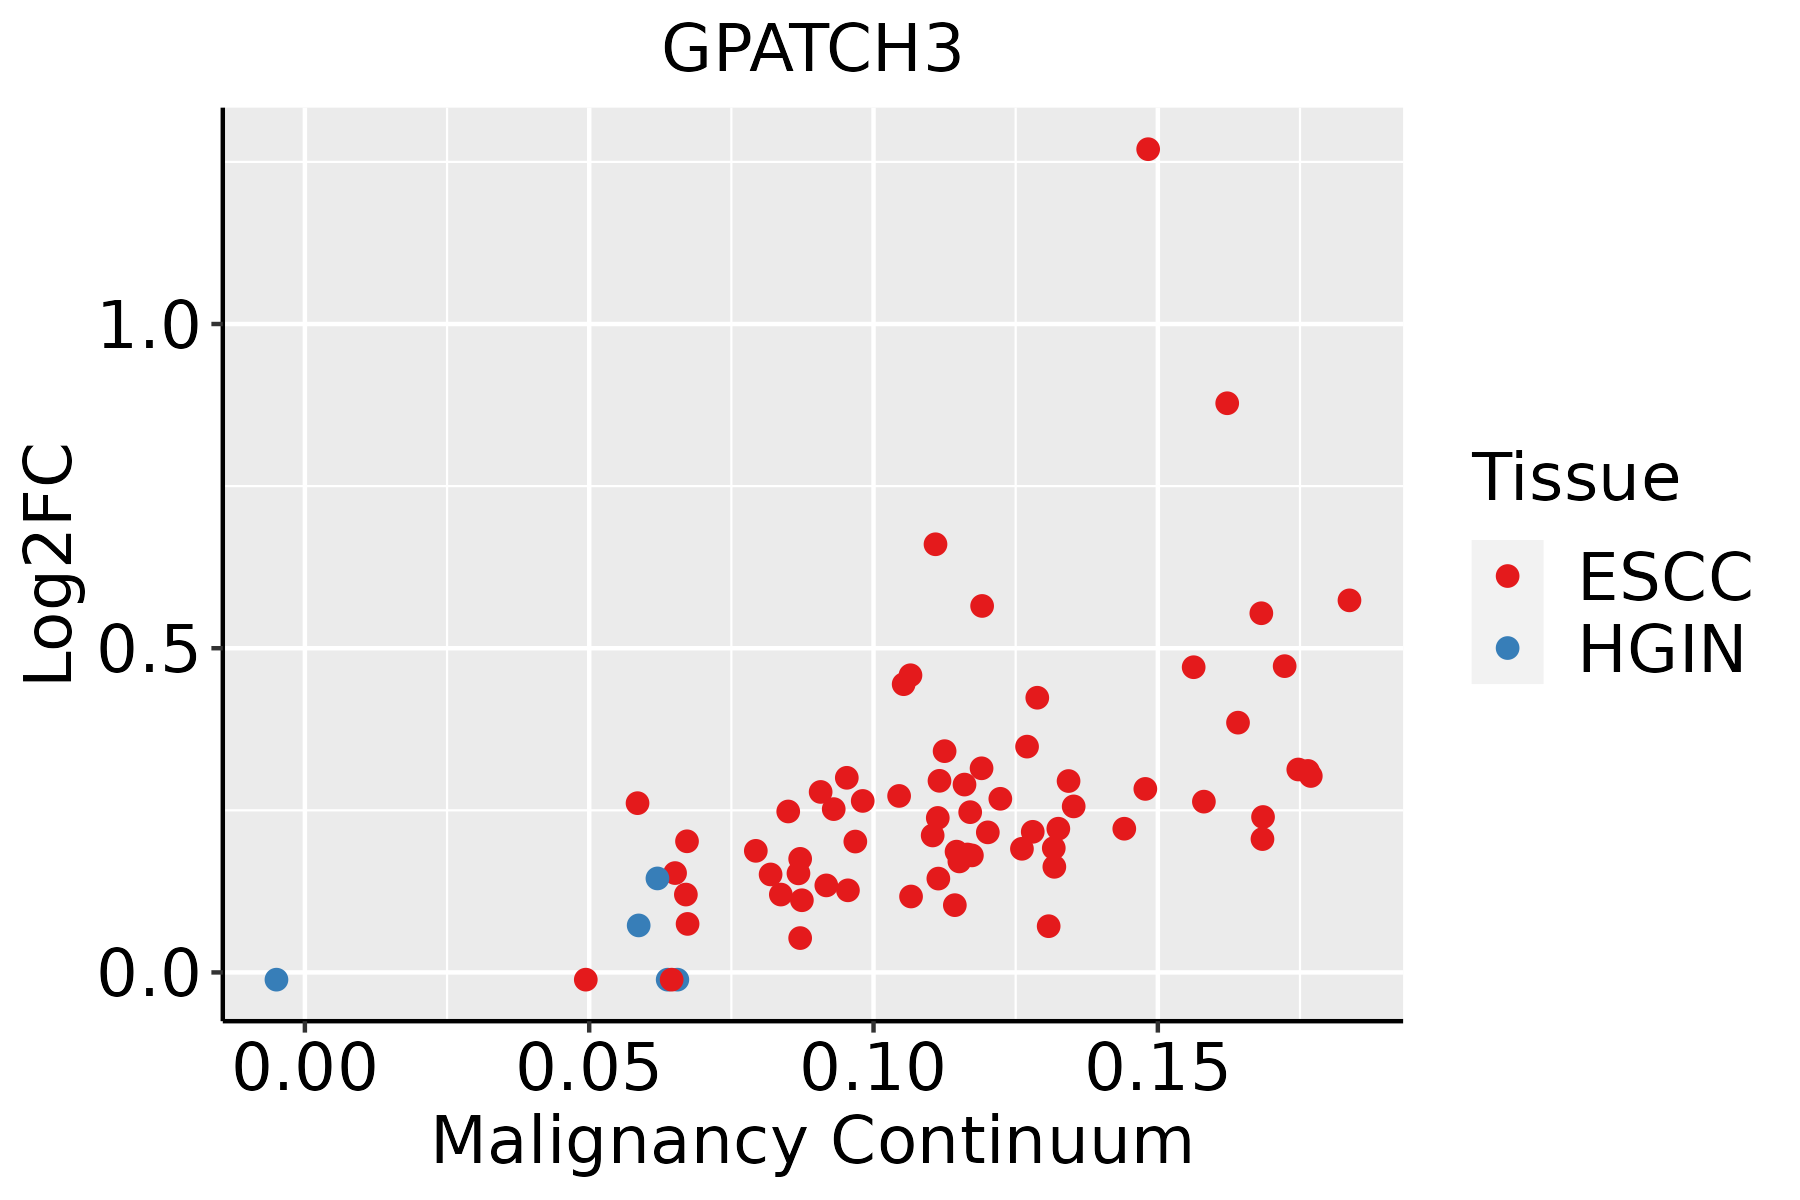 | ESCC: Esophageal squamous cell carcinoma |
| HGIN: High-grade intraepithelial neoplasias | ||
| LGIN: Low-grade intraepithelial neoplasias | ||
| Liver | 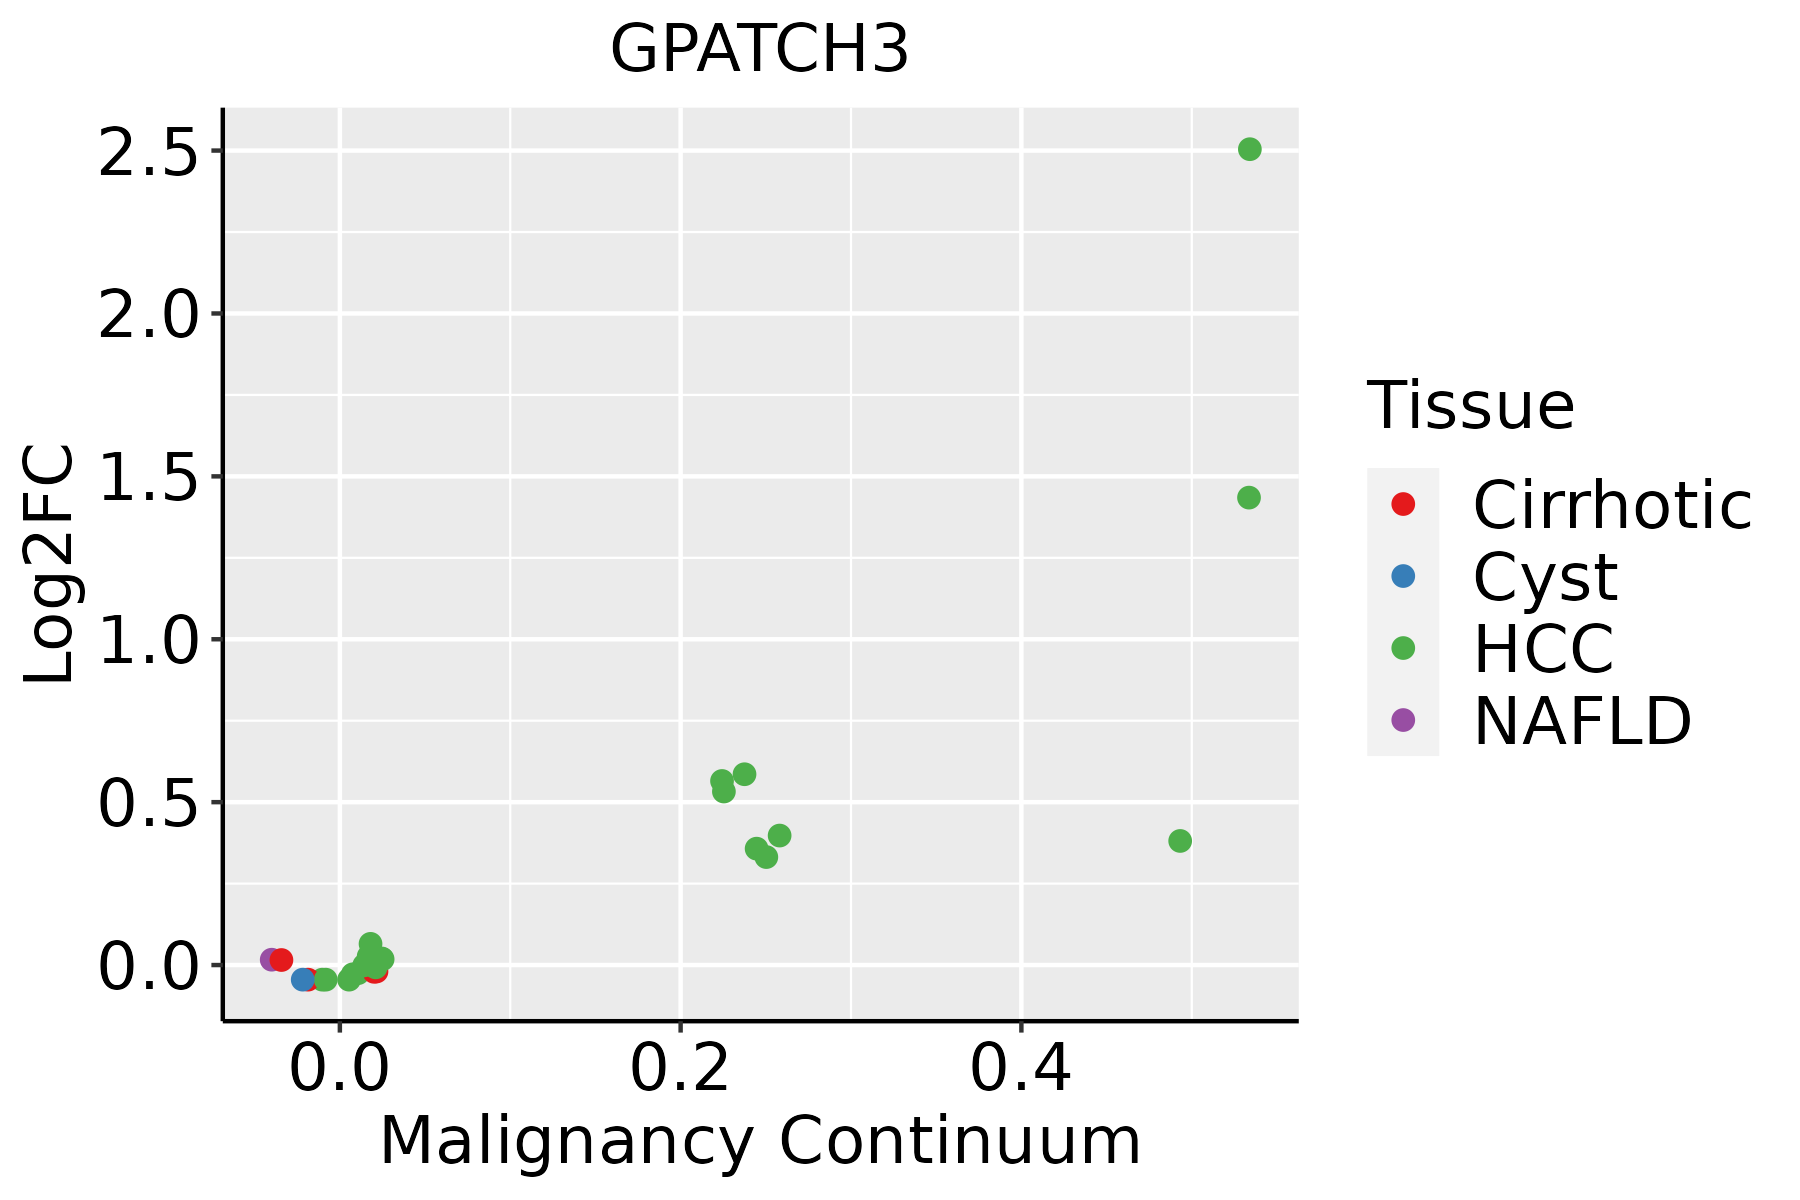 | HCC: Hepatocellular carcinoma |
| NAFLD: Non-alcoholic fatty liver disease |
| ∗log2FC in expression of this searched gene in stem-like cells from each diseased tissue sample relative to stem-like cells in normal samples in each tissue plotted against the malignancy continuum. Samples are colored based on if they are from different disease stage. |
Top |
Malignant transformation related pathway analysis |
| Find out the enriched GO biological processes and KEGG pathways involved in transition from healthy to precancer to cancer |
| Tissue | Disease Stage | Enriched GO biological Processes |
| Colorectum | AD |  |
| Colorectum | SER |  |
| Colorectum | MSS |  |
| Colorectum | MSI-H |  |
| Colorectum | FAP |  |
| ∗Top 15 enriched GO BP terms are showed in the bar plot of each disease state in each tissue. Each row represents a significant GO biological process which is colored according to the -log10(p.adjust). |
| Page: 1 2 3 4 5 6 7 8 9 |
| GO ID | Tissue | Disease Stage | Description | Gene Ratio | Bg Ratio | pvalue | p.adjust | Count |
| GO:000961518 | Esophagus | ESCC | response to virus | 238/8552 | 367/18723 | 6.65e-14 | 3.32e-12 | 238 |
| GO:00516075 | Esophagus | ESCC | defense response to virus | 171/8552 | 265/18723 | 3.91e-10 | 1.05e-08 | 171 |
| GO:01405465 | Esophagus | ESCC | defense response to symbiont | 171/8552 | 265/18723 | 3.91e-10 | 1.05e-08 | 171 |
| GO:0030522110 | Esophagus | ESCC | intracellular receptor signaling pathway | 170/8552 | 265/18723 | 8.58e-10 | 2.09e-08 | 170 |
| GO:00028318 | Esophagus | ESCC | regulation of response to biotic stimulus | 191/8552 | 327/18723 | 2.12e-06 | 2.45e-05 | 191 |
| GO:000283212 | Esophagus | ESCC | negative regulation of response to biotic stimulus | 72/8552 | 108/18723 | 8.36e-06 | 8.11e-05 | 72 |
| GO:003952813 | Esophagus | ESCC | cytoplasmic pattern recognition receptor signaling pathway in response to virus | 28/8552 | 34/18723 | 1.21e-05 | 1.12e-04 | 28 |
| GO:009858613 | Esophagus | ESCC | cellular response to virus | 56/8552 | 84/18723 | 8.20e-05 | 6.01e-04 | 56 |
| GO:003952913 | Esophagus | ESCC | RIG-I signaling pathway | 22/8552 | 27/18723 | 1.49e-04 | 9.92e-04 | 22 |
| GO:003247912 | Esophagus | ESCC | regulation of type I interferon production | 61/8552 | 95/18723 | 2.05e-04 | 1.29e-03 | 61 |
| GO:003260612 | Esophagus | ESCC | type I interferon production | 61/8552 | 95/18723 | 2.05e-04 | 1.29e-03 | 61 |
| GO:000275313 | Esophagus | ESCC | cytoplasmic pattern recognition receptor signaling pathway | 41/8552 | 60/18723 | 3.25e-04 | 1.91e-03 | 41 |
| GO:00507775 | Esophagus | ESCC | negative regulation of immune response | 112/8552 | 194/18723 | 4.67e-04 | 2.62e-03 | 112 |
| GO:00506884 | Esophagus | ESCC | regulation of defense response to virus | 45/8552 | 69/18723 | 8.26e-04 | 4.27e-03 | 45 |
| GO:000268316 | Esophagus | ESCC | negative regulation of immune system process | 231/8552 | 434/18723 | 8.48e-04 | 4.36e-03 | 231 |
| GO:00395313 | Esophagus | ESCC | regulation of viral-induced cytoplasmic pattern recognition receptor signaling pathway | 18/8552 | 24/18723 | 3.43e-03 | 1.41e-02 | 18 |
| GO:00506871 | Esophagus | ESCC | negative regulation of defense response to virus | 18/8552 | 24/18723 | 3.43e-03 | 1.41e-02 | 18 |
| GO:00395355 | Esophagus | ESCC | regulation of RIG-I signaling pathway | 15/8552 | 20/18723 | 7.60e-03 | 2.71e-02 | 15 |
| GO:003052222 | Liver | HCC | intracellular receptor signaling pathway | 171/7958 | 265/18723 | 3.00e-13 | 1.61e-11 | 171 |
| GO:000961511 | Liver | HCC | response to virus | 210/7958 | 367/18723 | 7.32e-09 | 1.86e-07 | 210 |
| Page: 1 2 |
| Pathway ID | Tissue | Disease Stage | Description | Gene Ratio | Bg Ratio | pvalue | p.adjust | qvalue | Count |
| Page: 1 |
Top |
Cell-cell communication analysis |
| Identification of potential cell-cell interactions between two cell types and their ligand-receptor pairs for different disease states |
| Ligand | Receptor | LRpair | Pathway | Tissue | Disease Stage |
| Page: 1 |
Top |
Single-cell gene regulatory network inference analysis |
| Find out the significant the regulons (TFs) and the target genes of each regulon across cell types for different disease states |
| TF | Cell Type | Tissue | Disease Stage | Target Gene | RSS | Regulon Activity |
| ∗The dot plots of a searched regulon are shown for all cell subpopulations in each disease state of each tissue based on the regulon specific score inferred using pySCENIC and by calculating the average expression. |
| Page: 1 |
Top |
Somatic mutation of malignant transformation related genes |
| Annotation of somatic variants for genes involved in malignant transformation |
| Hugo Symbol | Variant Class | Variant Classification | dbSNP RS | HGVSc | HGVSp | HGVSp Short | SWISSPROT | BIOTYPE | SIFT | PolyPhen | Tumor Sample Barcode | Tissue | Histology | Sex | Age | Stage | Therapy Types | Drugs | Outcome |
| GPATCH3 | SNV | Missense_Mutation | c.1541N>A | p.Ser514Tyr | p.S514Y | Q96I76 | protein_coding | deleterious(0.01) | possibly_damaging(0.819) | TCGA-AN-A0AK-01 | Breast | breast invasive carcinoma | Female | >=65 | I/II | Unknown | Unknown | SD | |
| GPATCH3 | SNV | Missense_Mutation | c.1096G>T | p.Val366Leu | p.V366L | Q96I76 | protein_coding | deleterious(0.02) | benign(0.094) | TCGA-AN-A0FK-01 | Breast | breast invasive carcinoma | Female | >=65 | III/IV | Unknown | Unknown | SD | |
| GPATCH3 | SNV | Missense_Mutation | c.309N>G | p.Cys103Trp | p.C103W | Q96I76 | protein_coding | deleterious(0) | probably_damaging(0.999) | TCGA-E2-A1LH-01 | Breast | breast invasive carcinoma | Female | <65 | I/II | Chemotherapy | adriamycin | SD | |
| GPATCH3 | insertion | In_Frame_Ins | novel | c.914_915insCAGTCTAATGAGAGAGAT | p.Ala305_Leu306insSerLeuMetArgGluMet | p.A305_L306insSLMREM | Q96I76 | protein_coding | TCGA-A7-A0CJ-01 | Breast | breast invasive carcinoma | Female | <65 | I/II | Chemotherapy | cytoxan | SD | ||
| GPATCH3 | insertion | Nonsense_Mutation | novel | c.1221_1222insGTCAGGAGTTAGAGACCAGCCTGGCCAACATGGTGAAAT | p.Glu407_Arg408insValArgSerTerArgProAlaTrpProThrTrpTerAsn | p.E407_R408insVRS*RPAWPTW*N | Q96I76 | protein_coding | TCGA-A8-A08X-01 | Breast | breast invasive carcinoma | Female | <65 | III/IV | Chemotherapy | doxorubicin | PD | ||
| GPATCH3 | insertion | In_Frame_Ins | novel | c.1475_1476insGGGAGG | p.Ser492_Leu493insGlyGly | p.S492_L493insGG | Q96I76 | protein_coding | TCGA-AN-A0FX-01 | Breast | breast invasive carcinoma | Female | <65 | I/II | Unknown | Unknown | SD | ||
| GPATCH3 | SNV | Missense_Mutation | rs267598527 | c.821G>A | p.Gly274Glu | p.G274E | Q96I76 | protein_coding | tolerated(0.55) | benign(0) | TCGA-2W-A8YY-01 | Cervix | cervical & endocervical cancer | Female | <65 | I/II | Chemotherapy | cisplatin | CR |
| GPATCH3 | SNV | Missense_Mutation | rs746205141 | c.823N>C | p.Glu275Gln | p.E275Q | Q96I76 | protein_coding | tolerated(0.36) | benign(0.018) | TCGA-C5-A1BQ-01 | Cervix | cervical & endocervical cancer | Female | >=65 | III/IV | Chemotherapy | cisplatin | CR |
| GPATCH3 | SNV | Missense_Mutation | novel | c.856G>C | p.Glu286Gln | p.E286Q | Q96I76 | protein_coding | tolerated(0.09) | benign(0.009) | TCGA-C5-A1M7-01 | Cervix | cervical & endocervical cancer | Female | <65 | I/II | Unknown | Unknown | SD |
| GPATCH3 | SNV | Missense_Mutation | novel | c.253N>A | p.Asp85Asn | p.D85N | Q96I76 | protein_coding | tolerated(0.24) | benign(0.003) | TCGA-C5-A1MH-01 | Cervix | cervical & endocervical cancer | Female | >=65 | III/IV | Chemotherapy | cisplatin | PD |
| Page: 1 2 3 4 5 6 |
Top |
Related drugs of malignant transformation related genes |
| Identification of chemicals and drugs interact with genes involved in malignant transfromation |
| (DGIdb 4.0) |
| Entrez ID | Symbol | Category | Interaction Types | Drug Claim Name | Drug Name | PMIDs |
| Page: 1 |

Copyright 2023-Present -The University of Texas Health Science Center at Houston |