
|
|||||
|
 | |
| |
| |
| |
| |
| |
|
Gene: GPAT4 |
Gene summary for GPAT4 |
| Gene information | Species | Human | Gene symbol | GPAT4 | Gene ID | 137964 |
| Gene name | glycerol-3-phosphate acyltransferase 4 | |
| Gene Alias | 1-AGPAT 6 | |
| Cytomap | 8p11.21 | |
| Gene Type | protein-coding | GO ID | GO:0002064 | UniProtAcc | Q2TU73 |
Top |
Malignant transformation analysis |
| Identification of the aberrant gene expression in precancerous and cancerous lesions by comparing the gene expression of stem-like cells in diseased tissues with normal stem cells |
| Entrez ID | Symbol | Replicates | Species | Organ | Tissue | Adj P-value | Log2FC | Malignancy |
| 137964 | GPAT4 | LZE4T | Human | Esophagus | ESCC | 4.00e-02 | -4.27e-03 | 0.0811 |
| 137964 | GPAT4 | LZE8T | Human | Esophagus | ESCC | 2.40e-04 | 9.67e-02 | 0.067 |
| 137964 | GPAT4 | LZE20T | Human | Esophagus | ESCC | 2.08e-09 | 3.96e-01 | 0.0662 |
| 137964 | GPAT4 | LZE22T | Human | Esophagus | ESCC | 9.46e-05 | 1.76e-01 | 0.068 |
| 137964 | GPAT4 | LZE24T | Human | Esophagus | ESCC | 3.17e-14 | 2.87e-01 | 0.0596 |
| 137964 | GPAT4 | P2T-E | Human | Esophagus | ESCC | 5.78e-14 | 1.89e-01 | 0.1177 |
| 137964 | GPAT4 | P4T-E | Human | Esophagus | ESCC | 3.08e-13 | 2.12e-01 | 0.1323 |
| 137964 | GPAT4 | P5T-E | Human | Esophagus | ESCC | 1.17e-05 | 3.11e-03 | 0.1327 |
| 137964 | GPAT4 | P8T-E | Human | Esophagus | ESCC | 2.14e-10 | 1.12e-01 | 0.0889 |
| 137964 | GPAT4 | P9T-E | Human | Esophagus | ESCC | 2.39e-10 | 1.30e-01 | 0.1131 |
| 137964 | GPAT4 | P10T-E | Human | Esophagus | ESCC | 2.93e-11 | 1.72e-01 | 0.116 |
| 137964 | GPAT4 | P11T-E | Human | Esophagus | ESCC | 6.55e-05 | 2.98e-01 | 0.1426 |
| 137964 | GPAT4 | P12T-E | Human | Esophagus | ESCC | 1.27e-18 | 2.71e-01 | 0.1122 |
| 137964 | GPAT4 | P15T-E | Human | Esophagus | ESCC | 4.37e-23 | 4.92e-01 | 0.1149 |
| 137964 | GPAT4 | P16T-E | Human | Esophagus | ESCC | 1.84e-15 | 1.44e-01 | 0.1153 |
| 137964 | GPAT4 | P17T-E | Human | Esophagus | ESCC | 1.26e-09 | 1.65e-01 | 0.1278 |
| 137964 | GPAT4 | P19T-E | Human | Esophagus | ESCC | 2.67e-04 | 1.79e-01 | 0.1662 |
| 137964 | GPAT4 | P20T-E | Human | Esophagus | ESCC | 1.03e-04 | 7.39e-02 | 0.1124 |
| 137964 | GPAT4 | P21T-E | Human | Esophagus | ESCC | 1.15e-09 | 1.24e-01 | 0.1617 |
| 137964 | GPAT4 | P22T-E | Human | Esophagus | ESCC | 1.85e-08 | 8.60e-02 | 0.1236 |
| Page: 1 2 3 4 5 |
| Tissue | Expression Dynamics | Abbreviation |
| Esophagus | 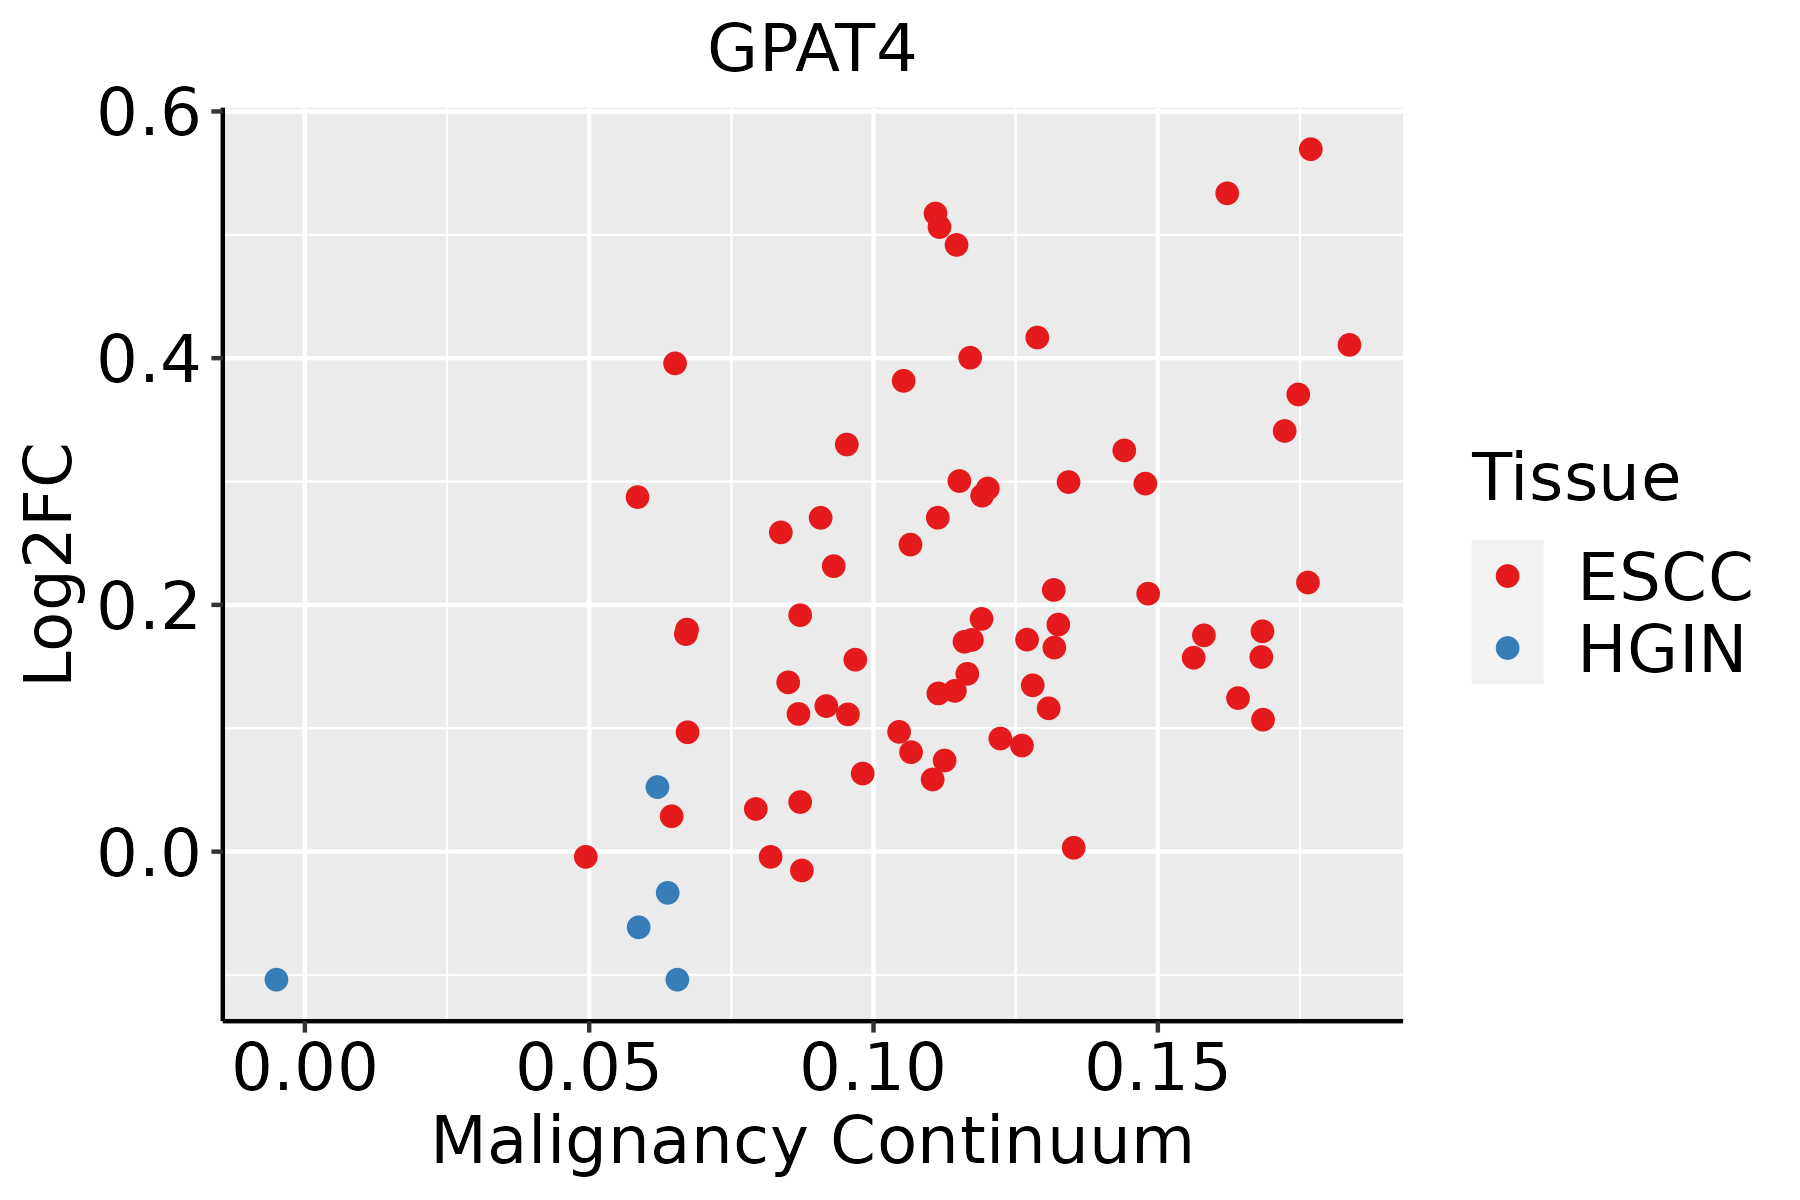 | ESCC: Esophageal squamous cell carcinoma |
| HGIN: High-grade intraepithelial neoplasias | ||
| LGIN: Low-grade intraepithelial neoplasias | ||
| Liver | 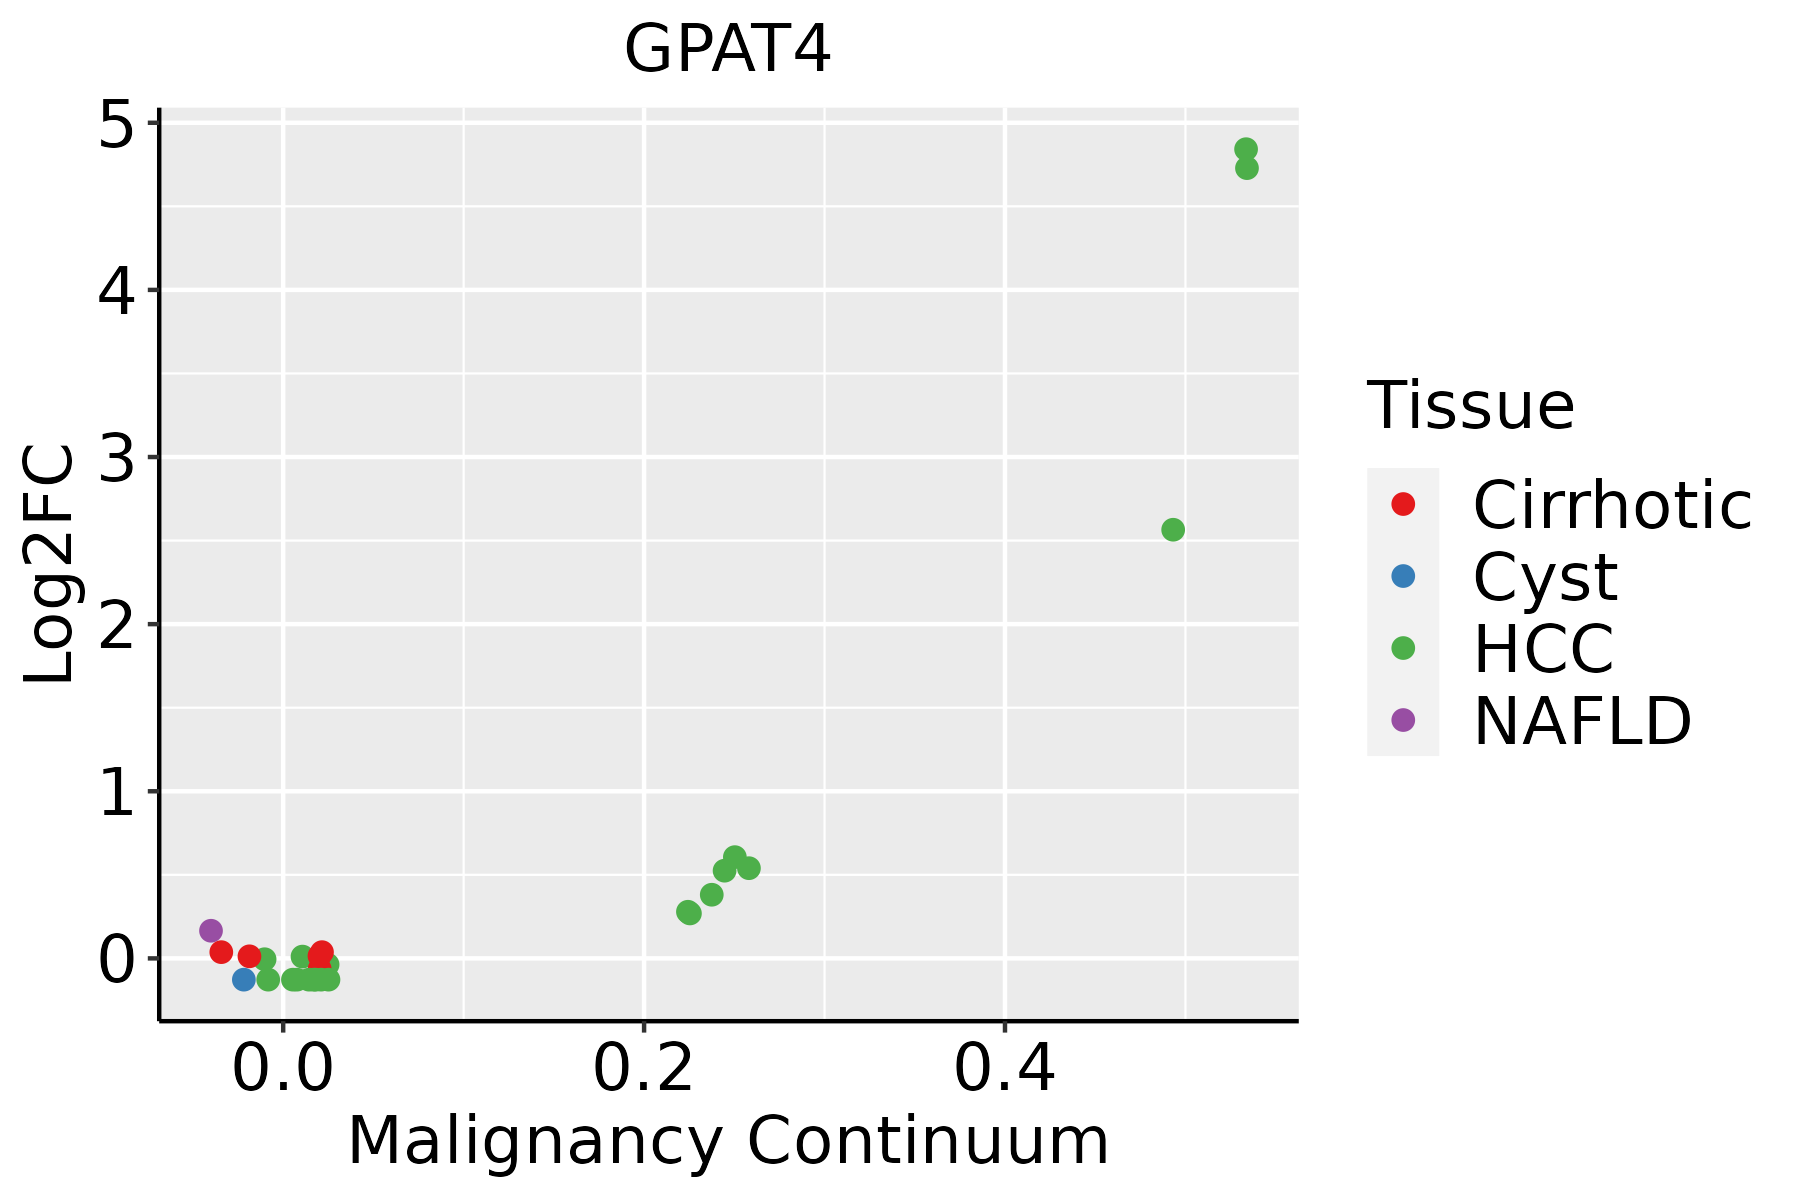 | HCC: Hepatocellular carcinoma |
| NAFLD: Non-alcoholic fatty liver disease | ||
| Oral Cavity |  | EOLP: Erosive Oral lichen planus |
| LP: leukoplakia | ||
| NEOLP: Non-erosive oral lichen planus | ||
| OSCC: Oral squamous cell carcinoma | ||
| Thyroid | 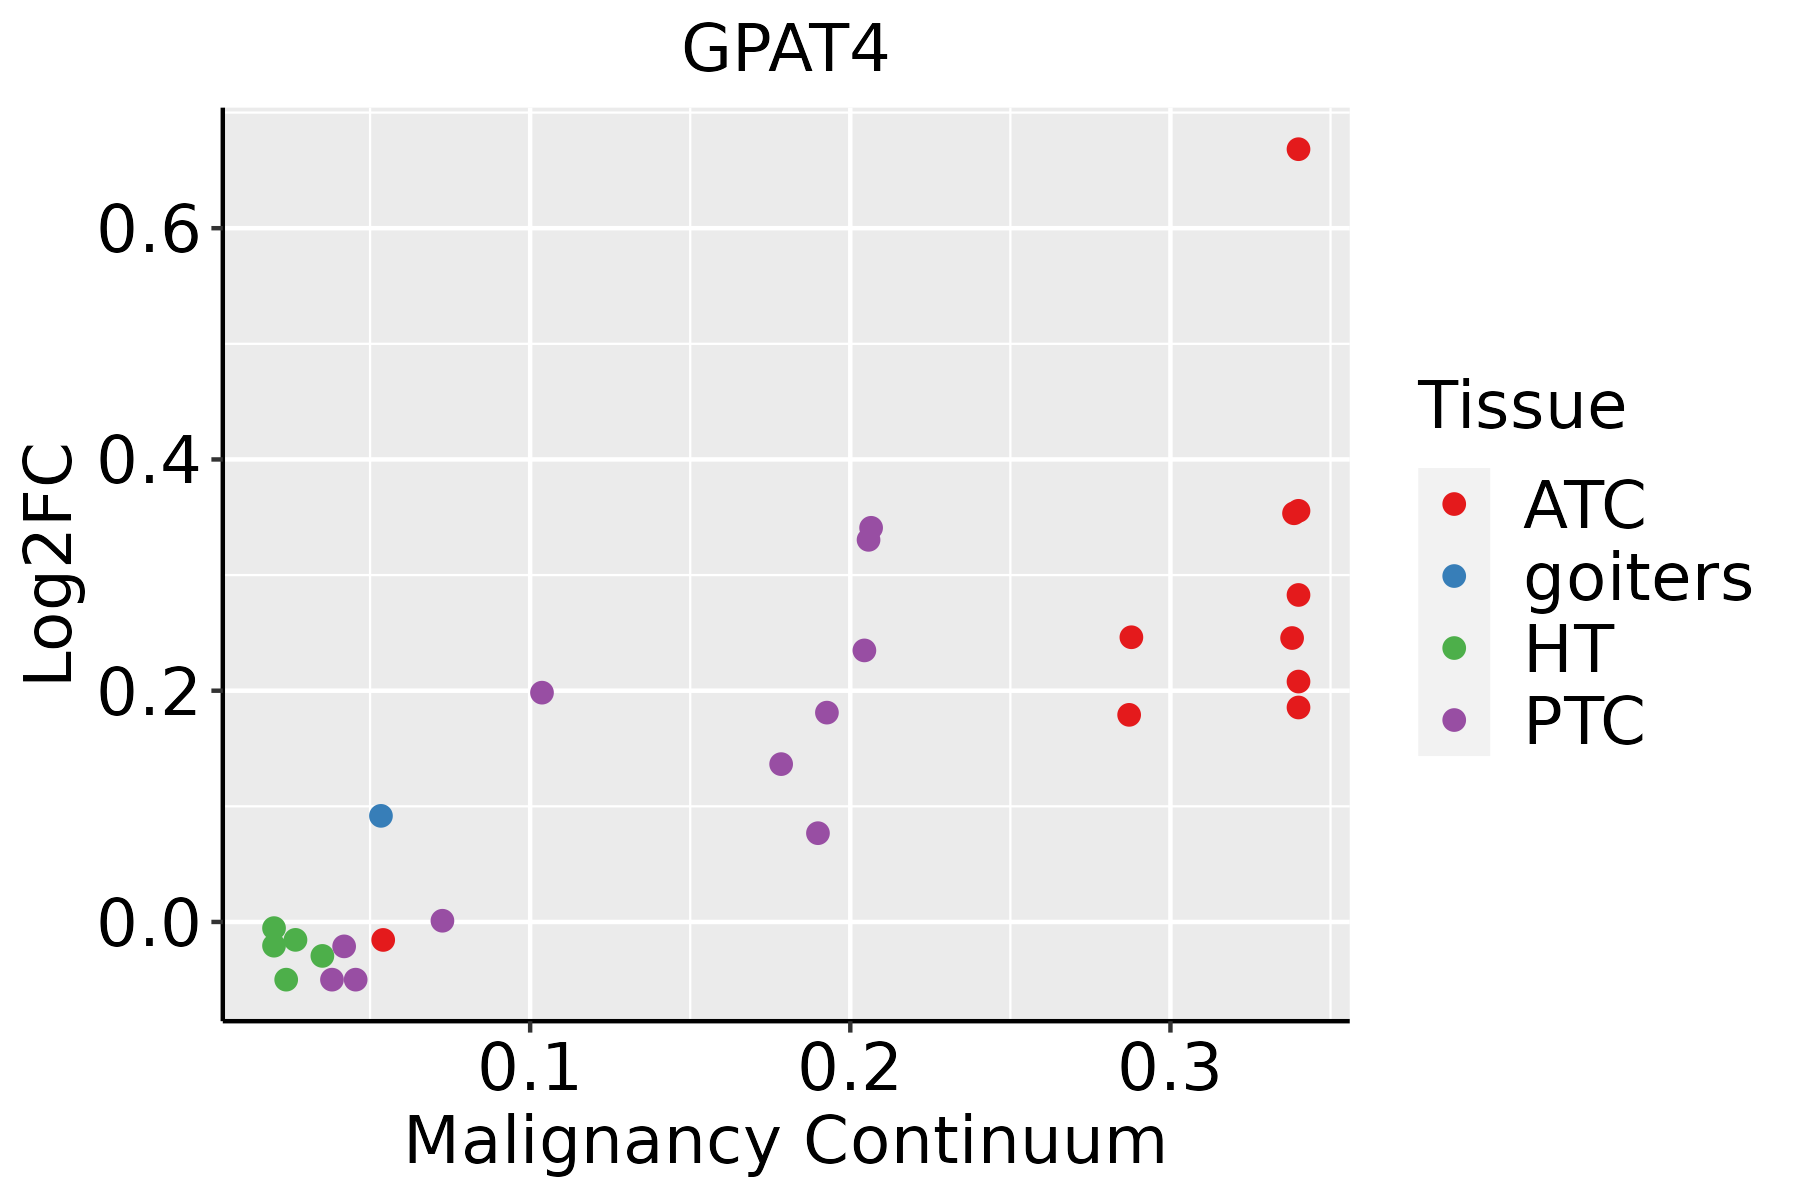 | ATC: Anaplastic thyroid cancer |
| HT: Hashimoto's thyroiditis | ||
| PTC: Papillary thyroid cancer |
| ∗log2FC in expression of this searched gene in stem-like cells from each diseased tissue sample relative to stem-like cells in normal samples in each tissue plotted against the malignancy continuum. Samples are colored based on if they are from different disease stage. |
Top |
Malignant transformation related pathway analysis |
| Find out the enriched GO biological processes and KEGG pathways involved in transition from healthy to precancer to cancer |
| Tissue | Disease Stage | Enriched GO biological Processes |
| Colorectum | AD |  |
| Colorectum | SER |  |
| Colorectum | MSS |  |
| Colorectum | MSI-H |  |
| Colorectum | FAP |  |
| ∗Top 15 enriched GO BP terms are showed in the bar plot of each disease state in each tissue. Each row represents a significant GO biological process which is colored according to the -log10(p.adjust). |
| Page: 1 2 3 4 5 6 7 8 9 |
| GO ID | Tissue | Disease Stage | Description | Gene Ratio | Bg Ratio | pvalue | p.adjust | Count |
| GO:0048732111 | Esophagus | ESCC | gland development | 269/8552 | 436/18723 | 7.81e-12 | 2.95e-10 | 269 |
| GO:00086544 | Esophagus | ESCC | phospholipid biosynthetic process | 162/8552 | 253/18723 | 2.59e-09 | 5.73e-08 | 162 |
| GO:0006753110 | Esophagus | ESCC | nucleoside phosphate metabolic process | 288/8552 | 497/18723 | 1.80e-08 | 3.50e-07 | 288 |
| GO:0019693111 | Esophagus | ESCC | ribose phosphate metabolic process | 234/8552 | 396/18723 | 4.24e-08 | 7.76e-07 | 234 |
| GO:0009117111 | Esophagus | ESCC | nucleotide metabolic process | 282/8552 | 489/18723 | 4.70e-08 | 8.50e-07 | 282 |
| GO:00464744 | Esophagus | ESCC | glycerophospholipid biosynthetic process | 135/8552 | 211/18723 | 5.75e-08 | 1.02e-06 | 135 |
| GO:00067906 | Esophagus | ESCC | sulfur compound metabolic process | 201/8552 | 339/18723 | 2.64e-07 | 3.94e-06 | 201 |
| GO:0009259111 | Esophagus | ESCC | ribonucleotide metabolic process | 224/8552 | 385/18723 | 4.41e-07 | 6.00e-06 | 224 |
| GO:00450175 | Esophagus | ESCC | glycerolipid biosynthetic process | 154/8552 | 252/18723 | 5.20e-07 | 6.96e-06 | 154 |
| GO:000206420 | Esophagus | ESCC | epithelial cell development | 136/8552 | 220/18723 | 9.50e-07 | 1.21e-05 | 136 |
| GO:0072521111 | Esophagus | ESCC | purine-containing compound metabolic process | 238/8552 | 416/18723 | 1.20e-06 | 1.49e-05 | 238 |
| GO:0009150111 | Esophagus | ESCC | purine ribonucleotide metabolic process | 213/8552 | 368/18723 | 1.40e-06 | 1.69e-05 | 213 |
| GO:0006163111 | Esophagus | ESCC | purine nucleotide metabolic process | 226/8552 | 396/18723 | 2.81e-06 | 3.21e-05 | 226 |
| GO:00066446 | Esophagus | ESCC | phospholipid metabolic process | 218/8552 | 383/18723 | 5.37e-06 | 5.59e-05 | 218 |
| GO:00066318 | Esophagus | ESCC | fatty acid metabolic process | 217/8552 | 390/18723 | 4.21e-05 | 3.39e-04 | 217 |
| GO:00066561 | Esophagus | ESCC | phosphatidylcholine biosynthetic process | 24/8552 | 29/18723 | 4.50e-05 | 3.55e-04 | 24 |
| GO:00066505 | Esophagus | ESCC | glycerophospholipid metabolic process | 174/8552 | 306/18723 | 4.92e-05 | 3.85e-04 | 174 |
| GO:003087914 | Esophagus | ESCC | mammary gland development | 85/8552 | 137/18723 | 8.11e-05 | 6.01e-04 | 85 |
| GO:00066541 | Esophagus | ESCC | phosphatidic acid biosynthetic process | 26/8552 | 33/18723 | 1.06e-04 | 7.43e-04 | 26 |
| GO:00464733 | Esophagus | ESCC | phosphatidic acid metabolic process | 28/8552 | 37/18723 | 2.00e-04 | 1.26e-03 | 28 |
| Page: 1 2 3 4 5 6 |
| Pathway ID | Tissue | Disease Stage | Description | Gene Ratio | Bg Ratio | pvalue | p.adjust | qvalue | Count |
| hsa005615 | Liver | HCC | Glycerolipid metabolism | 41/4020 | 63/8465 | 3.59e-03 | 1.12e-02 | 6.22e-03 | 41 |
| hsa0056112 | Liver | HCC | Glycerolipid metabolism | 41/4020 | 63/8465 | 3.59e-03 | 1.12e-02 | 6.22e-03 | 41 |
| Page: 1 |
Top |
Cell-cell communication analysis |
| Identification of potential cell-cell interactions between two cell types and their ligand-receptor pairs for different disease states |
| Ligand | Receptor | LRpair | Pathway | Tissue | Disease Stage |
| Page: 1 |
Top |
Single-cell gene regulatory network inference analysis |
| Find out the significant the regulons (TFs) and the target genes of each regulon across cell types for different disease states |
| TF | Cell Type | Tissue | Disease Stage | Target Gene | RSS | Regulon Activity |
| ∗The dot plots of a searched regulon are shown for all cell subpopulations in each disease state of each tissue based on the regulon specific score inferred using pySCENIC and by calculating the average expression. |
| Page: 1 |
Top |
Somatic mutation of malignant transformation related genes |
| Annotation of somatic variants for genes involved in malignant transformation |
| Hugo Symbol | Variant Class | Variant Classification | dbSNP RS | HGVSc | HGVSp | HGVSp Short | SWISSPROT | BIOTYPE | SIFT | PolyPhen | Tumor Sample Barcode | Tissue | Histology | Sex | Age | Stage | Therapy Types | Drugs | Outcome |
| GPAT4 | SNV | Missense_Mutation | c.934N>G | p.Lys312Glu | p.K312E | Q86UL3 | protein_coding | tolerated(0.45) | benign(0.007) | TCGA-A2-A0SY-01 | Breast | breast invasive carcinoma | Female | <65 | III/IV | Hormone Therapy | arimidex | SD | |
| GPAT4 | SNV | Missense_Mutation | novel | c.1180N>A | p.Glu394Lys | p.E394K | Q86UL3 | protein_coding | tolerated(0.33) | benign(0) | TCGA-AR-A2LE-01 | Breast | breast invasive carcinoma | Female | >=65 | I/II | Hormone Therapy | tamoxiphen | PD |
| GPAT4 | SNV | Missense_Mutation | rs754488446 | c.871N>A | p.Glu291Lys | p.E291K | Q86UL3 | protein_coding | deleterious(0) | possibly_damaging(0.734) | TCGA-BH-A0B6-01 | Breast | breast invasive carcinoma | Female | <65 | I/II | Unknown | Unknown | SD |
| GPAT4 | SNV | Missense_Mutation | rs779520353 | c.359G>A | p.Arg120Gln | p.R120Q | Q86UL3 | protein_coding | deleterious(0.01) | benign(0.068) | TCGA-E9-A1R7-01 | Breast | breast invasive carcinoma | Female | <65 | I/II | Hormone Therapy | fareston | SD |
| GPAT4 | insertion | In_Frame_Ins | novel | c.335_336insGGTCTCATTCTTGCTCTTGTATCTTGCTTC | p.Leu112_Ser113insValSerPheLeuLeuLeuTyrLeuAlaSer | p.L112_S113insVSFLLLYLAS | Q86UL3 | protein_coding | TCGA-AQ-A04J-01 | Breast | breast invasive carcinoma | Female | <65 | I/II | Chemotherapy | cytoxan | SD | ||
| GPAT4 | SNV | Missense_Mutation | rs760455234 | c.475N>T | p.Arg159Trp | p.R159W | Q86UL3 | protein_coding | deleterious(0) | possibly_damaging(0.841) | TCGA-2W-A8YY-01 | Cervix | cervical & endocervical cancer | Female | <65 | I/II | Chemotherapy | cisplatin | CR |
| GPAT4 | SNV | Missense_Mutation | rs765596568 | c.778N>A | p.Asp260Asn | p.D260N | Q86UL3 | protein_coding | deleterious(0.03) | benign(0.362) | TCGA-C5-A1MK-01 | Cervix | cervical & endocervical cancer | Female | >=65 | III/IV | Chemotherapy | carboplatin | PD |
| GPAT4 | SNV | Missense_Mutation | novel | c.1025N>C | p.Gly342Ala | p.G342A | Q86UL3 | protein_coding | deleterious(0.05) | possibly_damaging(0.451) | TCGA-VS-A8EL-01 | Cervix | cervical & endocervical cancer | Female | <65 | I/II | Chemotherapy | cisplatin | CR |
| GPAT4 | SNV | Missense_Mutation | novel | c.627G>A | p.Met209Ile | p.M209I | Q86UL3 | protein_coding | tolerated(0.07) | benign(0) | TCGA-VS-A9UC-01 | Cervix | cervical & endocervical cancer | Female | <65 | I/II | Chemotherapy | cisplatin | SD |
| GPAT4 | SNV | Missense_Mutation | c.410C>T | p.Ala137Val | p.A137V | Q86UL3 | protein_coding | deleterious(0) | benign(0.382) | TCGA-A6-2686-01 | Colorectum | colon adenocarcinoma | Female | >=65 | I/II | Unknown | Unknown | SD |
| Page: 1 2 3 4 5 6 |
Top |
Related drugs of malignant transformation related genes |
| Identification of chemicals and drugs interact with genes involved in malignant transfromation |
| (DGIdb 4.0) |
| Entrez ID | Symbol | Category | Interaction Types | Drug Claim Name | Drug Name | PMIDs |
| Page: 1 |

Copyright 2023-Present -The University of Texas Health Science Center at Houston |