
|
|||||
|
 | |
| |
| |
| |
| |
| |
|
Gene: GPAT3 |
Gene summary for GPAT3 |
| Gene information | Species | Human | Gene symbol | GPAT3 | Gene ID | 84803 |
| Gene name | glycerol-3-phosphate acyltransferase 3 | |
| Gene Alias | AGPAT 10 | |
| Cytomap | 4q21.23 | |
| Gene Type | protein-coding | GO ID | GO:0006072 | UniProtAcc | A0A024RDG5 |
Top |
Malignant transformation analysis |
| Identification of the aberrant gene expression in precancerous and cancerous lesions by comparing the gene expression of stem-like cells in diseased tissues with normal stem cells |
| Entrez ID | Symbol | Replicates | Species | Organ | Tissue | Adj P-value | Log2FC | Malignancy |
| 84803 | GPAT3 | LZE4T | Human | Esophagus | ESCC | 4.13e-02 | 2.76e-01 | 0.0811 |
| 84803 | GPAT3 | LZE7T | Human | Esophagus | ESCC | 7.35e-03 | 3.07e-01 | 0.0667 |
| 84803 | GPAT3 | LZE8T | Human | Esophagus | ESCC | 1.02e-02 | -2.96e-02 | 0.067 |
| 84803 | GPAT3 | P8T-E | Human | Esophagus | ESCC | 6.58e-04 | -1.03e-01 | 0.0889 |
| 84803 | GPAT3 | P9T-E | Human | Esophagus | ESCC | 3.25e-10 | 1.69e-01 | 0.1131 |
| 84803 | GPAT3 | P12T-E | Human | Esophagus | ESCC | 5.98e-07 | -4.90e-02 | 0.1122 |
| 84803 | GPAT3 | P15T-E | Human | Esophagus | ESCC | 1.08e-09 | 2.22e-01 | 0.1149 |
| 84803 | GPAT3 | P21T-E | Human | Esophagus | ESCC | 4.01e-05 | -5.91e-02 | 0.1617 |
| 84803 | GPAT3 | P22T-E | Human | Esophagus | ESCC | 1.93e-02 | -6.73e-02 | 0.1236 |
| 84803 | GPAT3 | P28T-E | Human | Esophagus | ESCC | 2.78e-16 | 6.14e-01 | 0.1149 |
| 84803 | GPAT3 | P31T-E | Human | Esophagus | ESCC | 9.70e-05 | -5.99e-02 | 0.1251 |
| 84803 | GPAT3 | P39T-E | Human | Esophagus | ESCC | 4.40e-11 | 8.31e-02 | 0.0894 |
| 84803 | GPAT3 | P48T-E | Human | Esophagus | ESCC | 1.67e-04 | -6.30e-02 | 0.0959 |
| 84803 | GPAT3 | P49T-E | Human | Esophagus | ESCC | 4.02e-05 | 1.06e+00 | 0.1768 |
| 84803 | GPAT3 | P57T-E | Human | Esophagus | ESCC | 4.10e-08 | -1.65e-02 | 0.0926 |
| 84803 | GPAT3 | P61T-E | Human | Esophagus | ESCC | 3.77e-02 | -9.56e-02 | 0.099 |
| 84803 | GPAT3 | P62T-E | Human | Esophagus | ESCC | 1.07e-03 | -5.71e-02 | 0.1302 |
| 84803 | GPAT3 | P75T-E | Human | Esophagus | ESCC | 2.02e-04 | -7.49e-02 | 0.1125 |
| 84803 | GPAT3 | P76T-E | Human | Esophagus | ESCC | 9.87e-05 | -5.81e-02 | 0.1207 |
| 84803 | GPAT3 | P83T-E | Human | Esophagus | ESCC | 8.02e-09 | 3.51e-01 | 0.1738 |
| Page: 1 2 |
| Tissue | Expression Dynamics | Abbreviation |
| Esophagus |  | ESCC: Esophageal squamous cell carcinoma |
| HGIN: High-grade intraepithelial neoplasias | ||
| LGIN: Low-grade intraepithelial neoplasias | ||
| Liver | 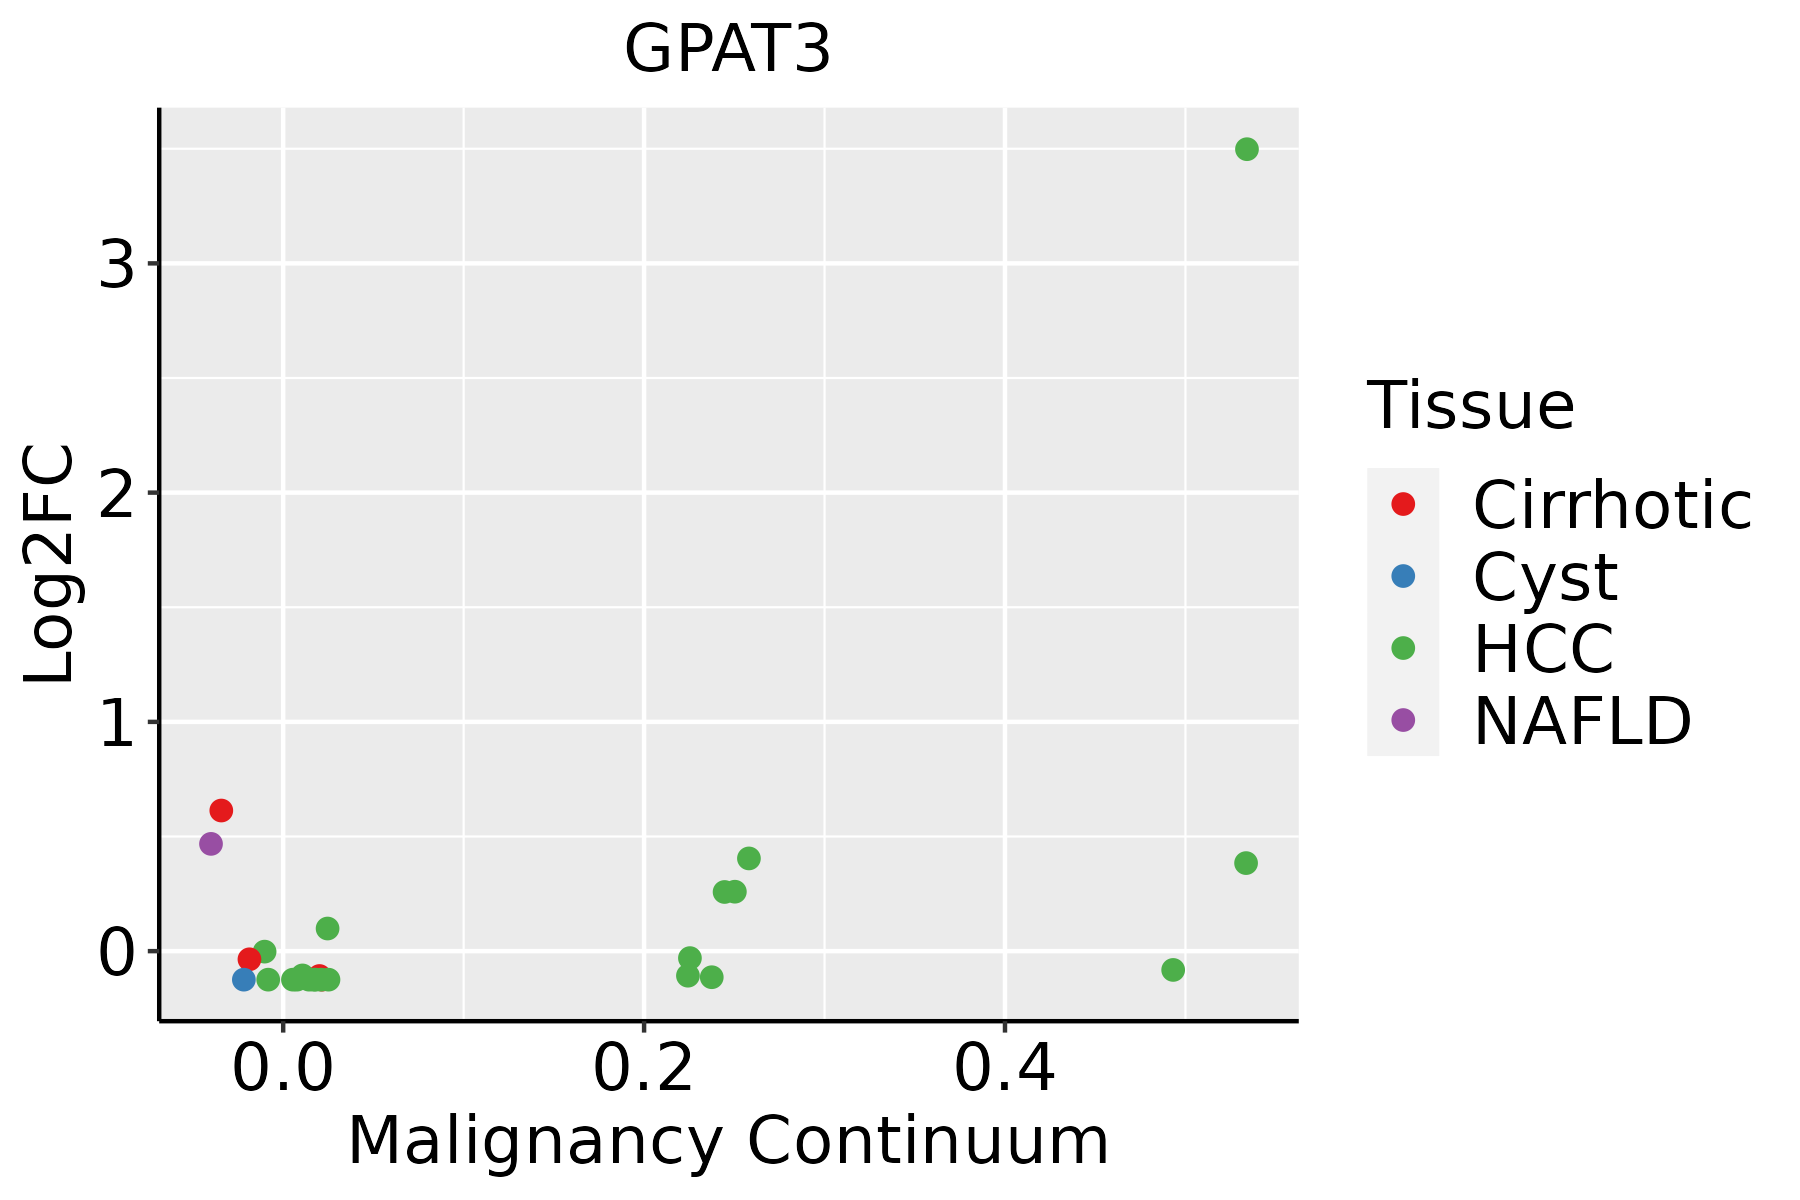 | HCC: Hepatocellular carcinoma |
| NAFLD: Non-alcoholic fatty liver disease |
| ∗log2FC in expression of this searched gene in stem-like cells from each diseased tissue sample relative to stem-like cells in normal samples in each tissue plotted against the malignancy continuum. Samples are colored based on if they are from different disease stage. |
Top |
Malignant transformation related pathway analysis |
| Find out the enriched GO biological processes and KEGG pathways involved in transition from healthy to precancer to cancer |
| Tissue | Disease Stage | Enriched GO biological Processes |
| Colorectum | AD |  |
| Colorectum | SER |  |
| Colorectum | MSS |  |
| Colorectum | MSI-H |  |
| Colorectum | FAP |  |
| ∗Top 15 enriched GO BP terms are showed in the bar plot of each disease state in each tissue. Each row represents a significant GO biological process which is colored according to the -log10(p.adjust). |
| Page: 1 2 3 4 5 6 7 8 9 |
| GO ID | Tissue | Disease Stage | Description | Gene Ratio | Bg Ratio | pvalue | p.adjust | Count |
| GO:0006650 | Colorectum | AD | glycerophospholipid metabolic process | 83/3918 | 306/18723 | 5.40e-03 | 3.55e-02 | 83 |
| GO:0006644 | Colorectum | AD | phospholipid metabolic process | 101/3918 | 383/18723 | 5.80e-03 | 3.67e-02 | 101 |
| GO:0045017 | Colorectum | AD | glycerolipid biosynthetic process | 69/3918 | 252/18723 | 8.33e-03 | 4.88e-02 | 69 |
| GO:0008654 | Colorectum | FAP | phospholipid biosynthetic process | 54/2622 | 253/18723 | 8.88e-04 | 9.08e-03 | 54 |
| GO:00066502 | Colorectum | FAP | glycerophospholipid metabolic process | 62/2622 | 306/18723 | 1.54e-03 | 1.38e-02 | 62 |
| GO:00066442 | Colorectum | FAP | phospholipid metabolic process | 74/2622 | 383/18723 | 2.24e-03 | 1.83e-02 | 74 |
| GO:0046473 | Colorectum | FAP | phosphatidic acid metabolic process | 12/2622 | 37/18723 | 3.43e-03 | 2.48e-02 | 12 |
| GO:0046474 | Colorectum | FAP | glycerophospholipid biosynthetic process | 44/2622 | 211/18723 | 3.98e-03 | 2.76e-02 | 44 |
| GO:00450172 | Colorectum | FAP | glycerolipid biosynthetic process | 50/2622 | 252/18723 | 6.32e-03 | 3.95e-02 | 50 |
| GO:00086544 | Esophagus | ESCC | phospholipid biosynthetic process | 162/8552 | 253/18723 | 2.59e-09 | 5.73e-08 | 162 |
| GO:00464744 | Esophagus | ESCC | glycerophospholipid biosynthetic process | 135/8552 | 211/18723 | 5.75e-08 | 1.02e-06 | 135 |
| GO:00450175 | Esophagus | ESCC | glycerolipid biosynthetic process | 154/8552 | 252/18723 | 5.20e-07 | 6.96e-06 | 154 |
| GO:00066446 | Esophagus | ESCC | phospholipid metabolic process | 218/8552 | 383/18723 | 5.37e-06 | 5.59e-05 | 218 |
| GO:00066505 | Esophagus | ESCC | glycerophospholipid metabolic process | 174/8552 | 306/18723 | 4.92e-05 | 3.85e-04 | 174 |
| GO:00319294 | Esophagus | ESCC | TOR signaling | 79/8552 | 126/18723 | 8.57e-05 | 6.21e-04 | 79 |
| GO:00066541 | Esophagus | ESCC | phosphatidic acid biosynthetic process | 26/8552 | 33/18723 | 1.06e-04 | 7.43e-04 | 26 |
| GO:00464733 | Esophagus | ESCC | phosphatidic acid metabolic process | 28/8552 | 37/18723 | 2.00e-04 | 1.26e-03 | 28 |
| GO:00464864 | Esophagus | ESCC | glycerolipid metabolic process | 211/8552 | 392/18723 | 6.51e-04 | 3.46e-03 | 211 |
| GO:00320061 | Esophagus | ESCC | regulation of TOR signaling | 63/8552 | 104/18723 | 1.55e-03 | 7.29e-03 | 63 |
| GO:00463411 | Esophagus | ESCC | CDP-diacylglycerol metabolic process | 11/8552 | 14/18723 | 1.30e-02 | 4.27e-02 | 11 |
| Page: 1 2 3 |
| Pathway ID | Tissue | Disease Stage | Description | Gene Ratio | Bg Ratio | pvalue | p.adjust | qvalue | Count |
| hsa005615 | Liver | HCC | Glycerolipid metabolism | 41/4020 | 63/8465 | 3.59e-03 | 1.12e-02 | 6.22e-03 | 41 |
| hsa0056112 | Liver | HCC | Glycerolipid metabolism | 41/4020 | 63/8465 | 3.59e-03 | 1.12e-02 | 6.22e-03 | 41 |
| Page: 1 |
Top |
Cell-cell communication analysis |
| Identification of potential cell-cell interactions between two cell types and their ligand-receptor pairs for different disease states |
| Ligand | Receptor | LRpair | Pathway | Tissue | Disease Stage |
| Page: 1 |
Top |
Single-cell gene regulatory network inference analysis |
| Find out the significant the regulons (TFs) and the target genes of each regulon across cell types for different disease states |
| TF | Cell Type | Tissue | Disease Stage | Target Gene | RSS | Regulon Activity |
| ∗The dot plots of a searched regulon are shown for all cell subpopulations in each disease state of each tissue based on the regulon specific score inferred using pySCENIC and by calculating the average expression. |
| Page: 1 |
Top |
Somatic mutation of malignant transformation related genes |
| Annotation of somatic variants for genes involved in malignant transformation |
| Hugo Symbol | Variant Class | Variant Classification | dbSNP RS | HGVSc | HGVSp | HGVSp Short | SWISSPROT | BIOTYPE | SIFT | PolyPhen | Tumor Sample Barcode | Tissue | Histology | Sex | Age | Stage | Therapy Types | Drugs | Outcome |
| GPAT3 | SNV | Missense_Mutation | rs780179869 | c.31N>A | p.Leu11Ile | p.L11I | Q53EU6 | protein_coding | tolerated(0.1) | benign(0.001) | TCGA-AO-A128-01 | Breast | breast invasive carcinoma | Female | <65 | I/II | Chemotherapy | doxorubicin | SD |
| GPAT3 | insertion | Nonsense_Mutation | novel | c.615_616insAATATATAAGA | p.Leu206AsnfsTer3 | p.L206Nfs*3 | Q53EU6 | protein_coding | TCGA-AR-A0U0-01 | Breast | breast invasive carcinoma | Female | >=65 | I/II | Unknown | Unknown | SD | ||
| GPAT3 | deletion | Frame_Shift_Del | c.190delN | p.Asn65ThrfsTer44 | p.N65Tfs*44 | Q53EU6 | protein_coding | TCGA-EW-A2FV-01 | Breast | breast invasive carcinoma | Female | <65 | III/IV | Chemotherapy | docetaxel | SD | |||
| GPAT3 | SNV | Missense_Mutation | rs746452375 | c.455N>A | p.Arg152His | p.R152H | Q53EU6 | protein_coding | deleterious(0) | possibly_damaging(0.828) | TCGA-EA-A410-01 | Cervix | cervical & endocervical cancer | Female | <65 | I/II | Unknown | Unknown | SD |
| GPAT3 | SNV | Missense_Mutation | c.197C>G | p.Ser66Cys | p.S66C | Q53EU6 | protein_coding | deleterious(0.03) | benign(0.219) | TCGA-Q1-A73O-01 | Cervix | cervical & endocervical cancer | Female | <65 | I/II | Chemotherapy | cisplatin | CR | |
| GPAT3 | SNV | Missense_Mutation | c.950N>G | p.Lys317Arg | p.K317R | Q53EU6 | protein_coding | deleterious(0.04) | probably_damaging(0.996) | TCGA-AA-3815-01 | Colorectum | colon adenocarcinoma | Female | >=65 | I/II | Unknown | Unknown | SD | |
| GPAT3 | SNV | Missense_Mutation | novel | c.344N>T | p.Arg115Met | p.R115M | Q53EU6 | protein_coding | deleterious(0) | probably_damaging(0.996) | TCGA-AA-3950-01 | Colorectum | colon adenocarcinoma | Female | >=65 | I/II | Unknown | Unknown | SD |
| GPAT3 | SNV | Missense_Mutation | novel | c.1165N>C | p.Ser389Pro | p.S389P | Q53EU6 | protein_coding | deleterious(0.01) | possibly_damaging(0.796) | TCGA-AA-A010-01 | Colorectum | colon adenocarcinoma | Female | <65 | I/II | Chemotherapy | folinic | CR |
| GPAT3 | SNV | Missense_Mutation | c.155G>A | p.Arg52Gln | p.R52Q | Q53EU6 | protein_coding | tolerated(0.37) | benign(0.009) | TCGA-CA-6718-01 | Colorectum | colon adenocarcinoma | Male | <65 | I/II | Unknown | Unknown | PD | |
| GPAT3 | SNV | Missense_Mutation | rs772639676 | c.1109C>T | p.Pro370Leu | p.P370L | Q53EU6 | protein_coding | deleterious(0) | probably_damaging(0.997) | TCGA-F4-6570-01 | Colorectum | colon adenocarcinoma | Female | >=65 | I/II | Unknown | Unknown | SD |
| Page: 1 2 3 4 5 6 |
Top |
Related drugs of malignant transformation related genes |
| Identification of chemicals and drugs interact with genes involved in malignant transfromation |
| (DGIdb 4.0) |
| Entrez ID | Symbol | Category | Interaction Types | Drug Claim Name | Drug Name | PMIDs |
| Page: 1 |

Copyright 2023-Present -The University of Texas Health Science Center at Houston |