
|
|||||
|
 | |
| |
| |
| |
| |
| |
|
Gene: GPAT2 |
Gene summary for GPAT2 |
| Gene information | Species | Human | Gene symbol | GPAT2 | Gene ID | 150763 |
| Gene name | glycerol-3-phosphate acyltransferase 2, mitochondrial | |
| Gene Alias | CT123 | |
| Cytomap | 2q11.2 | |
| Gene Type | protein-coding | GO ID | GO:0006072 | UniProtAcc | Q6NUI2 |
Top |
Malignant transformation analysis |
| Identification of the aberrant gene expression in precancerous and cancerous lesions by comparing the gene expression of stem-like cells in diseased tissues with normal stem cells |
| Entrez ID | Symbol | Replicates | Species | Organ | Tissue | Adj P-value | Log2FC | Malignancy |
| 150763 | GPAT2 | HCC2_Meng | Human | Liver | HCC | 5.01e-07 | 7.63e-02 | 0.0107 |
| 150763 | GPAT2 | S014 | Human | Liver | HCC | 1.07e-25 | 7.91e-01 | 0.2254 |
| 150763 | GPAT2 | S015 | Human | Liver | HCC | 2.41e-32 | 1.14e+00 | 0.2375 |
| 150763 | GPAT2 | S016 | Human | Liver | HCC | 3.73e-38 | 1.15e+00 | 0.2243 |
| Page: 1 |
| Tissue | Expression Dynamics | Abbreviation |
| Liver | 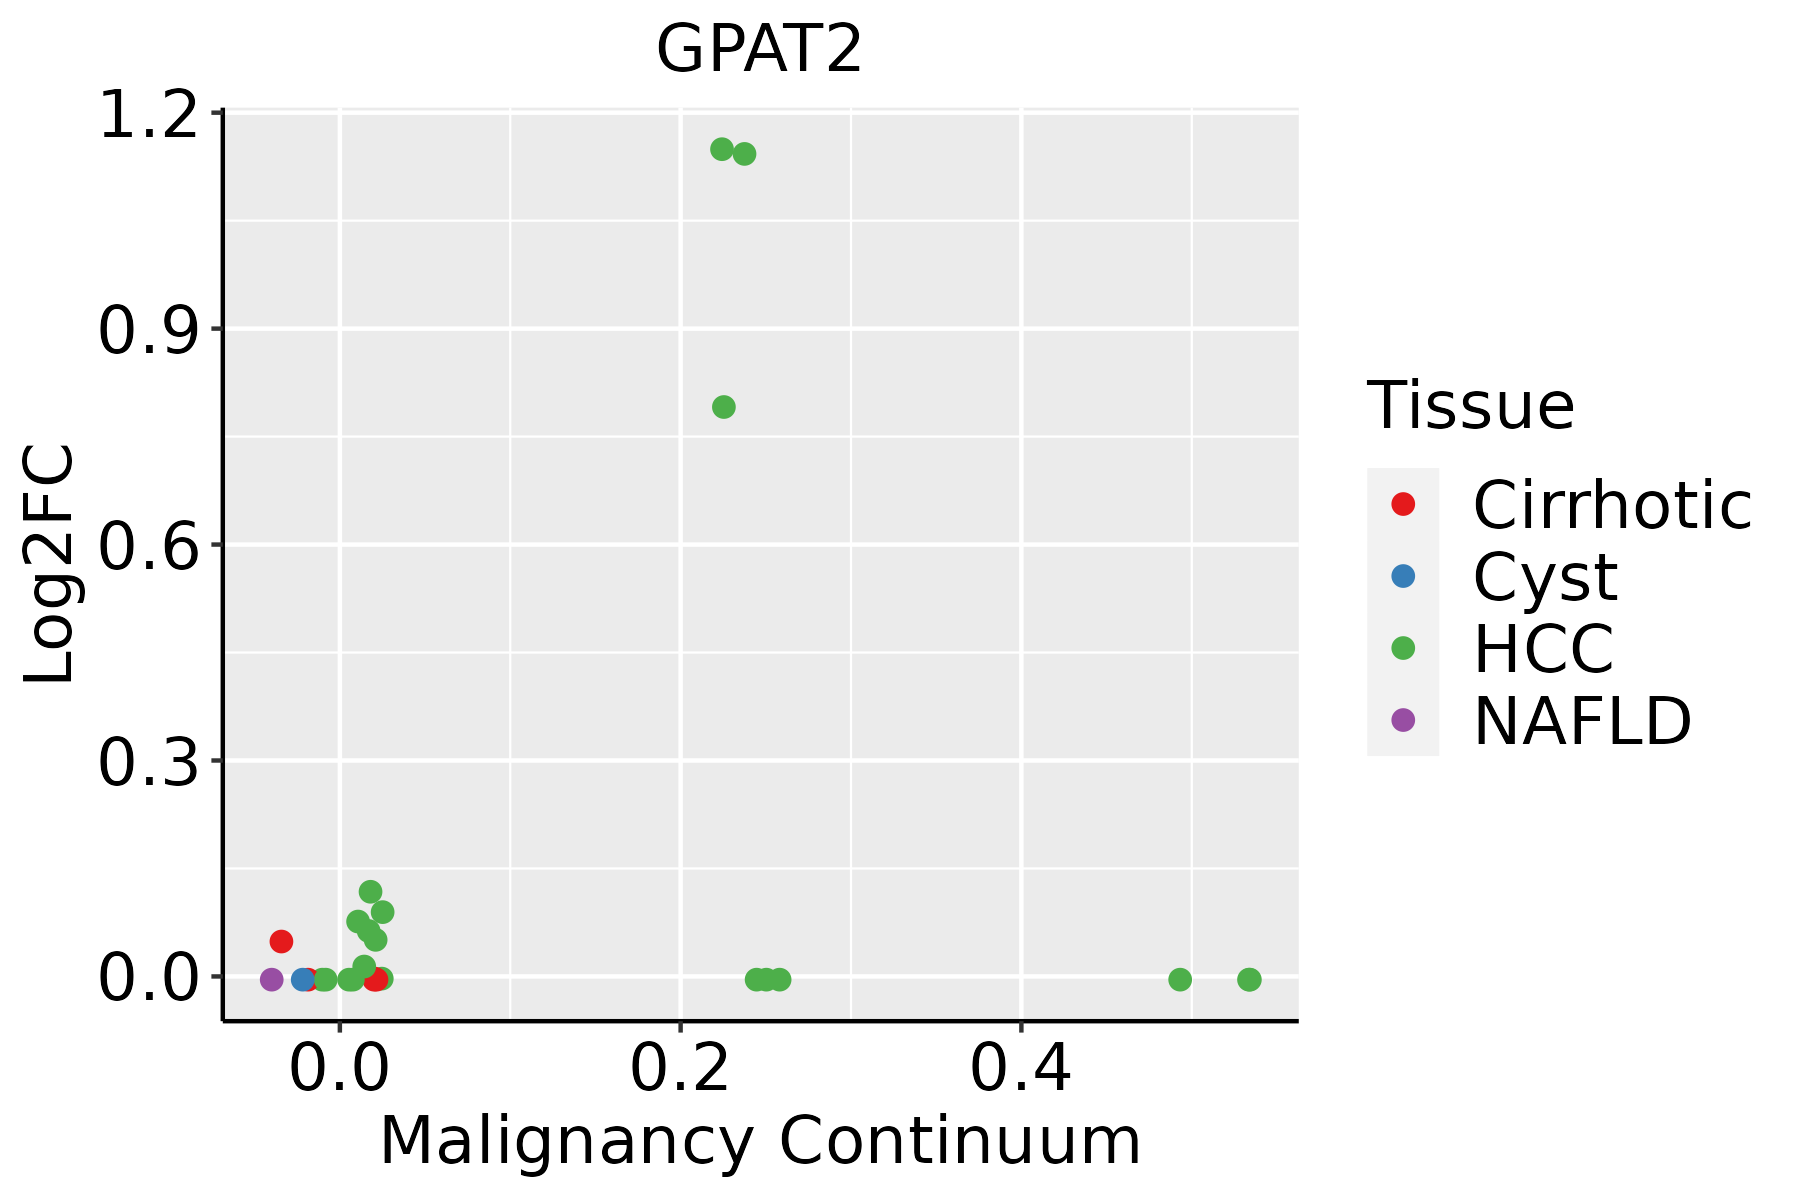 | HCC: Hepatocellular carcinoma |
| NAFLD: Non-alcoholic fatty liver disease |
| ∗log2FC in expression of this searched gene in stem-like cells from each diseased tissue sample relative to stem-like cells in normal samples in each tissue plotted against the malignancy continuum. Samples are colored based on if they are from different disease stage. |
Top |
Malignant transformation related pathway analysis |
| Find out the enriched GO biological processes and KEGG pathways involved in transition from healthy to precancer to cancer |
| Tissue | Disease Stage | Enriched GO biological Processes |
| Colorectum | AD |  |
| Colorectum | SER |  |
| Colorectum | MSS |  |
| Colorectum | MSI-H |  |
| Colorectum | FAP |  |
| ∗Top 15 enriched GO BP terms are showed in the bar plot of each disease state in each tissue. Each row represents a significant GO biological process which is colored according to the -log10(p.adjust). |
| Page: 1 2 3 4 5 6 7 8 9 |
| GO ID | Tissue | Disease Stage | Description | Gene Ratio | Bg Ratio | pvalue | p.adjust | Count |
| GO:00018196 | Breast | Precancer | positive regulation of cytokine production | 52/1080 | 467/18723 | 4.18e-06 | 1.29e-04 | 52 |
| GO:00085445 | Breast | Precancer | epidermis development | 35/1080 | 324/18723 | 2.71e-04 | 3.96e-03 | 35 |
| GO:00094108 | Breast | Precancer | response to xenobiotic stimulus | 45/1080 | 462/18723 | 4.17e-04 | 5.56e-03 | 45 |
| GO:000941013 | Breast | IDC | response to xenobiotic stimulus | 62/1434 | 462/18723 | 1.05e-05 | 2.88e-04 | 62 |
| GO:000181911 | Breast | IDC | positive regulation of cytokine production | 61/1434 | 467/18723 | 2.81e-05 | 6.58e-04 | 61 |
| GO:000854412 | Breast | IDC | epidermis development | 41/1434 | 324/18723 | 1.03e-03 | 1.14e-02 | 41 |
| GO:000181921 | Breast | DCIS | positive regulation of cytokine production | 63/1390 | 467/18723 | 2.76e-06 | 9.42e-05 | 63 |
| GO:000941023 | Breast | DCIS | response to xenobiotic stimulus | 59/1390 | 462/18723 | 3.00e-05 | 6.61e-04 | 59 |
| GO:000854422 | Breast | DCIS | epidermis development | 40/1390 | 324/18723 | 1.05e-03 | 1.16e-02 | 40 |
| GO:0009410 | Colorectum | AD | response to xenobiotic stimulus | 128/3918 | 462/18723 | 2.69e-04 | 3.31e-03 | 128 |
| GO:0006650 | Colorectum | AD | glycerophospholipid metabolic process | 83/3918 | 306/18723 | 5.40e-03 | 3.55e-02 | 83 |
| GO:0006644 | Colorectum | AD | phospholipid metabolic process | 101/3918 | 383/18723 | 5.80e-03 | 3.67e-02 | 101 |
| GO:0008544 | Colorectum | AD | epidermis development | 87/3918 | 324/18723 | 5.99e-03 | 3.76e-02 | 87 |
| GO:0045017 | Colorectum | AD | glycerolipid biosynthetic process | 69/3918 | 252/18723 | 8.33e-03 | 4.88e-02 | 69 |
| GO:0046486 | Colorectum | SER | glycerolipid metabolic process | 82/2897 | 392/18723 | 2.26e-03 | 2.17e-02 | 82 |
| GO:00066441 | Colorectum | SER | phospholipid metabolic process | 79/2897 | 383/18723 | 3.94e-03 | 3.24e-02 | 79 |
| GO:00450171 | Colorectum | SER | glycerolipid biosynthetic process | 55/2897 | 252/18723 | 4.47e-03 | 3.56e-02 | 55 |
| GO:00066501 | Colorectum | SER | glycerophospholipid metabolic process | 64/2897 | 306/18723 | 6.41e-03 | 4.60e-02 | 64 |
| GO:00094101 | Colorectum | MSS | response to xenobiotic stimulus | 110/3467 | 462/18723 | 2.36e-03 | 1.92e-02 | 110 |
| GO:0008654 | Colorectum | FAP | phospholipid biosynthetic process | 54/2622 | 253/18723 | 8.88e-04 | 9.08e-03 | 54 |
| Page: 1 2 3 4 5 6 |
| Pathway ID | Tissue | Disease Stage | Description | Gene Ratio | Bg Ratio | pvalue | p.adjust | qvalue | Count |
| hsa005615 | Liver | HCC | Glycerolipid metabolism | 41/4020 | 63/8465 | 3.59e-03 | 1.12e-02 | 6.22e-03 | 41 |
| hsa0056112 | Liver | HCC | Glycerolipid metabolism | 41/4020 | 63/8465 | 3.59e-03 | 1.12e-02 | 6.22e-03 | 41 |
| Page: 1 |
Top |
Cell-cell communication analysis |
| Identification of potential cell-cell interactions between two cell types and their ligand-receptor pairs for different disease states |
| Ligand | Receptor | LRpair | Pathway | Tissue | Disease Stage |
| Page: 1 |
Top |
Single-cell gene regulatory network inference analysis |
| Find out the significant the regulons (TFs) and the target genes of each regulon across cell types for different disease states |
| TF | Cell Type | Tissue | Disease Stage | Target Gene | RSS | Regulon Activity |
| ∗The dot plots of a searched regulon are shown for all cell subpopulations in each disease state of each tissue based on the regulon specific score inferred using pySCENIC and by calculating the average expression. |
| Page: 1 |
Top |
Somatic mutation of malignant transformation related genes |
| Annotation of somatic variants for genes involved in malignant transformation |
| Hugo Symbol | Variant Class | Variant Classification | dbSNP RS | HGVSc | HGVSp | HGVSp Short | SWISSPROT | BIOTYPE | SIFT | PolyPhen | Tumor Sample Barcode | Tissue | Histology | Sex | Age | Stage | Therapy Types | Drugs | Outcome |
| GPAT2 | SNV | Missense_Mutation | c.2005G>C | p.Glu669Gln | p.E669Q | Q6NUI2 | protein_coding | deleterious(0.01) | possibly_damaging(0.898) | TCGA-BH-A18T-01 | Breast | breast invasive carcinoma | Female | >=65 | I/II | Unknown | Unknown | PD | |
| GPAT2 | insertion | Frame_Shift_Ins | novel | c.1965_1966insCAAAATAATAAAAACATTAGGCATGGTGGTGC | p.Ser656GlnfsTer112 | p.S656Qfs*112 | Q6NUI2 | protein_coding | TCGA-E9-A1NC-01 | Breast | breast invasive carcinoma | Female | <65 | I/II | Chemotherapy | doxorubicin | CR | ||
| GPAT2 | SNV | Missense_Mutation | novel | c.1921G>A | p.Asp641Asn | p.D641N | Q6NUI2 | protein_coding | tolerated(0.06) | possibly_damaging(0.808) | TCGA-C5-A902-01 | Cervix | cervical & endocervical cancer | Female | <65 | I/II | Chemotherapy | cisplatin | SD |
| GPAT2 | SNV | Missense_Mutation | rs867174871 | c.1705C>T | p.Pro569Ser | p.P569S | Q6NUI2 | protein_coding | deleterious(0.03) | possibly_damaging(0.637) | TCGA-DS-A0VK-01 | Cervix | cervical & endocervical cancer | Female | <65 | I/II | Chemotherapy | carboplatin | PD |
| GPAT2 | SNV | Missense_Mutation | novel | c.2164G>A | p.Glu722Lys | p.E722K | Q6NUI2 | protein_coding | tolerated(0.05) | benign(0.001) | TCGA-AA-A00N-01 | Colorectum | colon adenocarcinoma | Male | >=65 | I/II | Unknown | Unknown | PD |
| GPAT2 | SNV | Missense_Mutation | c.2296N>A | p.Ala766Thr | p.A766T | Q6NUI2 | protein_coding | tolerated(0.48) | benign(0.001) | TCGA-G4-6588-01 | Colorectum | colon adenocarcinoma | Female | <65 | I/II | Unknown | Unknown | SD | |
| GPAT2 | SNV | Missense_Mutation | novel | c.2199N>T | p.Gln733His | p.Q733H | Q6NUI2 | protein_coding | deleterious(0.05) | benign(0.001) | TCGA-AG-A00Y-01 | Colorectum | rectum adenocarcinoma | Male | >=65 | I/II | Unknown | Unknown | PD |
| GPAT2 | SNV | Missense_Mutation | rs562806816 | c.1165N>A | p.Val389Ile | p.V389I | Q6NUI2 | protein_coding | tolerated(0.81) | benign(0) | TCGA-AG-A011-01 | Colorectum | rectum adenocarcinoma | Male | >=65 | I/II | Unknown | Unknown | SD |
| GPAT2 | SNV | Missense_Mutation | c.1403C>T | p.Thr468Met | p.T468M | Q6NUI2 | protein_coding | deleterious(0.02) | probably_damaging(0.95) | TCGA-DY-A0XA-01 | Colorectum | rectum adenocarcinoma | Female | <65 | I/II | Chemotherapy | mayo | CR | |
| GPAT2 | SNV | Missense_Mutation | novel | c.440N>A | p.Arg147His | p.R147H | Q6NUI2 | protein_coding | deleterious(0.04) | benign(0.019) | TCGA-EI-6508-01 | Colorectum | rectum adenocarcinoma | Female | <65 | III/IV | Chemotherapy | oxaliplatin | SD |
| Page: 1 2 3 4 5 |
Top |
Related drugs of malignant transformation related genes |
| Identification of chemicals and drugs interact with genes involved in malignant transfromation |
| (DGIdb 4.0) |
| Entrez ID | Symbol | Category | Interaction Types | Drug Claim Name | Drug Name | PMIDs |
| Page: 1 |

Copyright 2023-Present -The University of Texas Health Science Center at Houston |