
|
|||||
|
 | |
| |
| |
| |
| |
| |
|
Gene: GPALPP1 |
Gene summary for GPALPP1 |
| Gene information | Species | Human | Gene symbol | GPALPP1 | Gene ID | 55425 |
| Gene name | GPALPP motifs containing 1 | |
| Gene Alias | AD029 | |
| Cytomap | 13q14.12 | |
| Gene Type | protein-coding | GO ID | NA | UniProtAcc | A0A024RDS7 |
Top |
Malignant transformation analysis |
| Identification of the aberrant gene expression in precancerous and cancerous lesions by comparing the gene expression of stem-like cells in diseased tissues with normal stem cells |
| Entrez ID | Symbol | Replicates | Species | Organ | Tissue | Adj P-value | Log2FC | Malignancy |
| 55425 | GPALPP1 | LZE2T | Human | Esophagus | ESCC | 6.00e-04 | 3.24e-01 | 0.082 |
| 55425 | GPALPP1 | LZE4T | Human | Esophagus | ESCC | 4.15e-06 | 1.84e-01 | 0.0811 |
| 55425 | GPALPP1 | LZE5T | Human | Esophagus | ESCC | 9.46e-04 | 3.24e-01 | 0.0514 |
| 55425 | GPALPP1 | LZE20T | Human | Esophagus | ESCC | 3.15e-02 | 1.37e-01 | 0.0662 |
| 55425 | GPALPP1 | LZE24T | Human | Esophagus | ESCC | 2.89e-08 | 1.60e-01 | 0.0596 |
| 55425 | GPALPP1 | P1T-E | Human | Esophagus | ESCC | 9.84e-05 | 1.84e-01 | 0.0875 |
| 55425 | GPALPP1 | P2T-E | Human | Esophagus | ESCC | 3.40e-14 | 2.69e-01 | 0.1177 |
| 55425 | GPALPP1 | P4T-E | Human | Esophagus | ESCC | 5.32e-09 | 1.25e-01 | 0.1323 |
| 55425 | GPALPP1 | P5T-E | Human | Esophagus | ESCC | 9.58e-08 | 1.34e-01 | 0.1327 |
| 55425 | GPALPP1 | P8T-E | Human | Esophagus | ESCC | 2.35e-22 | 3.40e-01 | 0.0889 |
| 55425 | GPALPP1 | P9T-E | Human | Esophagus | ESCC | 3.75e-08 | 9.74e-02 | 0.1131 |
| 55425 | GPALPP1 | P10T-E | Human | Esophagus | ESCC | 5.20e-27 | 3.90e-01 | 0.116 |
| 55425 | GPALPP1 | P11T-E | Human | Esophagus | ESCC | 1.06e-02 | 1.70e-01 | 0.1426 |
| 55425 | GPALPP1 | P12T-E | Human | Esophagus | ESCC | 1.33e-12 | 7.45e-02 | 0.1122 |
| 55425 | GPALPP1 | P15T-E | Human | Esophagus | ESCC | 1.70e-12 | 1.87e-01 | 0.1149 |
| 55425 | GPALPP1 | P16T-E | Human | Esophagus | ESCC | 2.09e-12 | 3.11e-01 | 0.1153 |
| 55425 | GPALPP1 | P17T-E | Human | Esophagus | ESCC | 2.12e-03 | 1.68e-01 | 0.1278 |
| 55425 | GPALPP1 | P20T-E | Human | Esophagus | ESCC | 7.37e-19 | 2.24e-01 | 0.1124 |
| 55425 | GPALPP1 | P21T-E | Human | Esophagus | ESCC | 2.53e-09 | 1.11e-01 | 0.1617 |
| 55425 | GPALPP1 | P22T-E | Human | Esophagus | ESCC | 8.78e-15 | 2.53e-01 | 0.1236 |
| Page: 1 2 3 |
| Tissue | Expression Dynamics | Abbreviation |
| Esophagus | 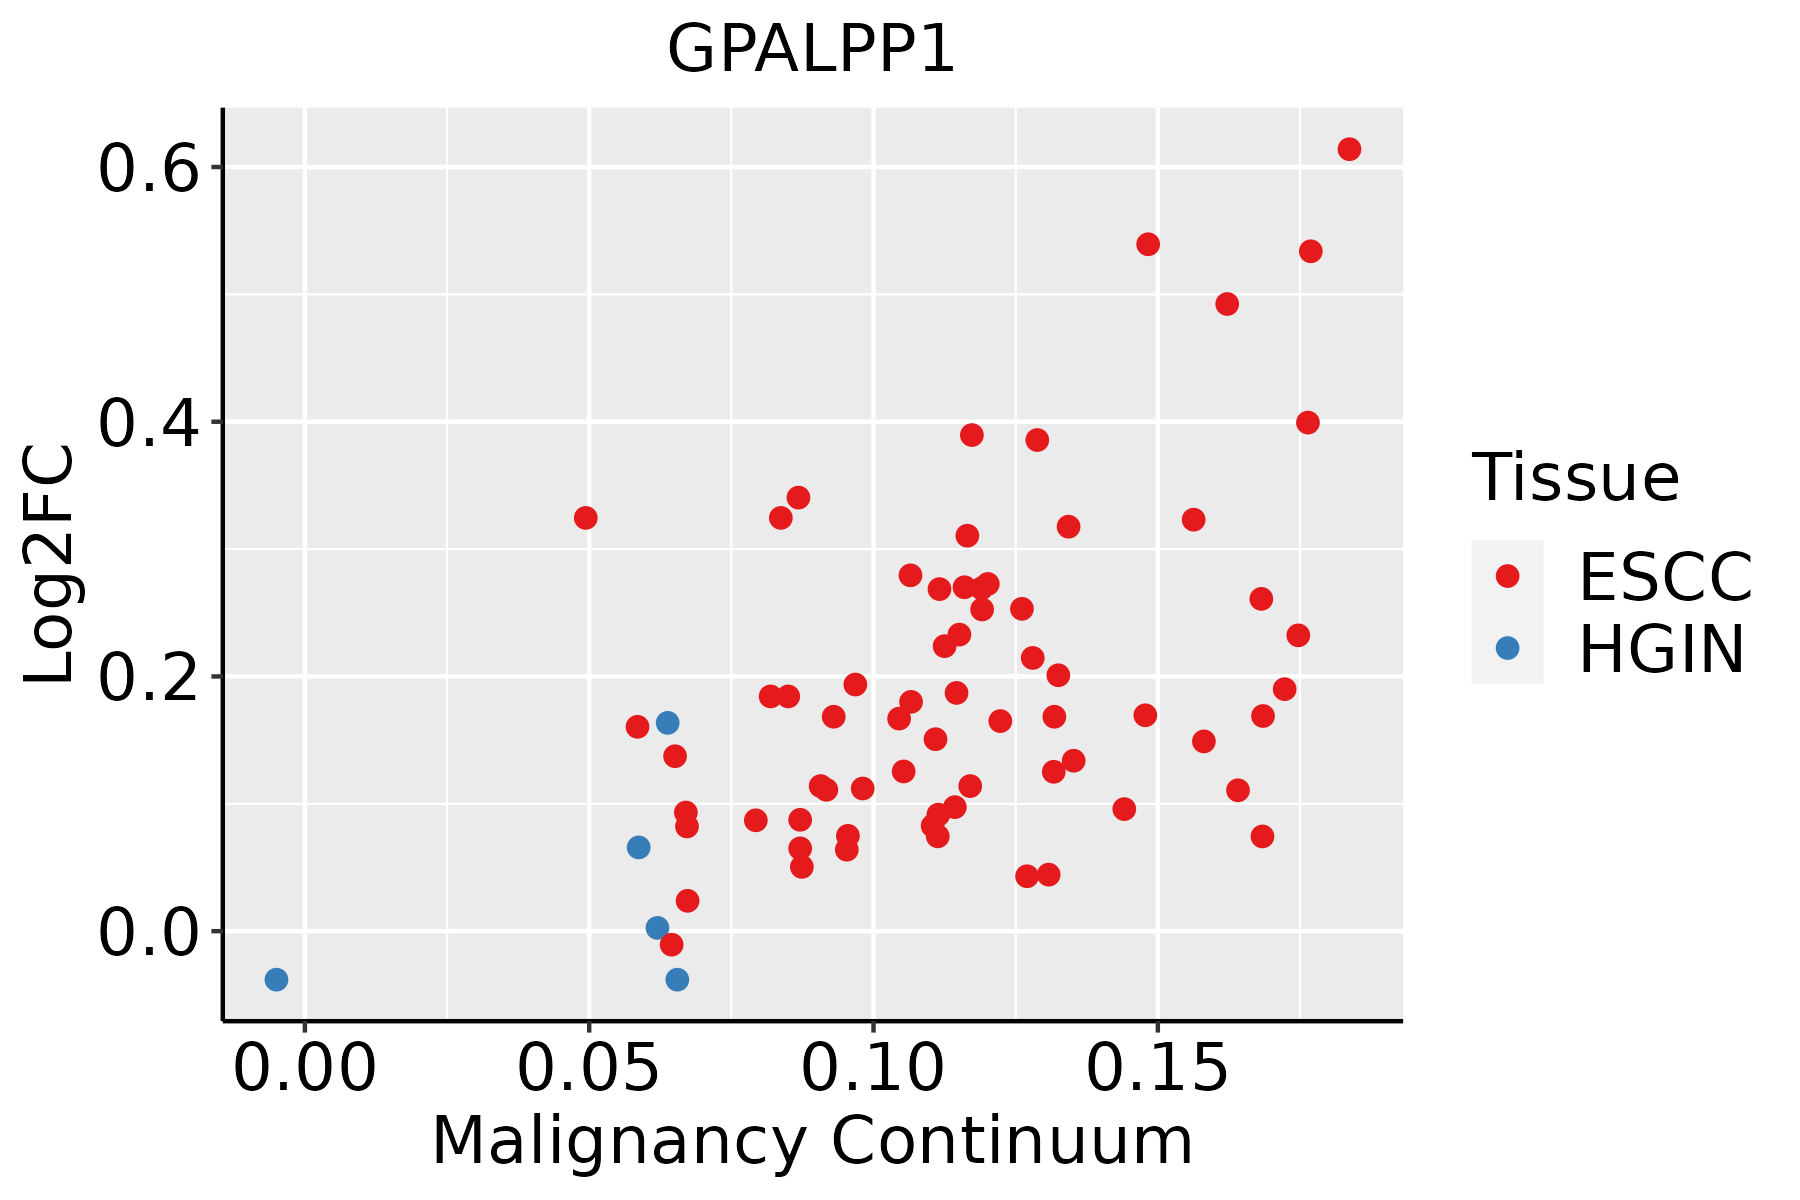 | ESCC: Esophageal squamous cell carcinoma |
| HGIN: High-grade intraepithelial neoplasias | ||
| LGIN: Low-grade intraepithelial neoplasias |
| ∗log2FC in expression of this searched gene in stem-like cells from each diseased tissue sample relative to stem-like cells in normal samples in each tissue plotted against the malignancy continuum. Samples are colored based on if they are from different disease stage. |
Top |
Malignant transformation related pathway analysis |
| Find out the enriched GO biological processes and KEGG pathways involved in transition from healthy to precancer to cancer |
| Tissue | Disease Stage | Enriched GO biological Processes |
| Colorectum | AD |  |
| Colorectum | SER |  |
| Colorectum | MSS |  |
| Colorectum | MSI-H |  |
| Colorectum | FAP |  |
| ∗Top 15 enriched GO BP terms are showed in the bar plot of each disease state in each tissue. Each row represents a significant GO biological process which is colored according to the -log10(p.adjust). |
| Page: 1 2 3 4 5 6 7 8 9 |
| GO ID | Tissue | Disease Stage | Description | Gene Ratio | Bg Ratio | pvalue | p.adjust | Count |
| Page: 1 |
| Pathway ID | Tissue | Disease Stage | Description | Gene Ratio | Bg Ratio | pvalue | p.adjust | qvalue | Count |
| Page: 1 |
Top |
Cell-cell communication analysis |
| Identification of potential cell-cell interactions between two cell types and their ligand-receptor pairs for different disease states |
| Ligand | Receptor | LRpair | Pathway | Tissue | Disease Stage |
| Page: 1 |
Top |
Single-cell gene regulatory network inference analysis |
| Find out the significant the regulons (TFs) and the target genes of each regulon across cell types for different disease states |
| TF | Cell Type | Tissue | Disease Stage | Target Gene | RSS | Regulon Activity |
| ∗The dot plots of a searched regulon are shown for all cell subpopulations in each disease state of each tissue based on the regulon specific score inferred using pySCENIC and by calculating the average expression. |
| Page: 1 |
Top |
Somatic mutation of malignant transformation related genes |
| Annotation of somatic variants for genes involved in malignant transformation |
| Hugo Symbol | Variant Class | Variant Classification | dbSNP RS | HGVSc | HGVSp | HGVSp Short | SWISSPROT | BIOTYPE | SIFT | PolyPhen | Tumor Sample Barcode | Tissue | Histology | Sex | Age | Stage | Therapy Types | Drugs | Outcome |
| GPALPP1 | SNV | Missense_Mutation | c.229N>G | p.Arg77Gly | p.R77G | Q8IXQ4 | protein_coding | tolerated(0.24) | benign(0.01) | TCGA-BH-A0BD-01 | Breast | breast invasive carcinoma | Female | <65 | I/II | Chemotherapy | doxorubicin | SD | |
| GPALPP1 | SNV | Missense_Mutation | c.67G>A | p.Glu23Lys | p.E23K | Q8IXQ4 | protein_coding | tolerated(0.57) | benign(0.001) | TCGA-BH-A1F8-01 | Breast | breast invasive carcinoma | Female | >=65 | III/IV | Unknown | Unknown | PD | |
| GPALPP1 | SNV | Missense_Mutation | c.696N>C | p.Arg232Ser | p.R232S | Q8IXQ4 | protein_coding | deleterious(0) | possibly_damaging(0.481) | TCGA-D8-A1XQ-01 | Breast | breast invasive carcinoma | Female | >=65 | I/II | Unknown | Unknown | SD | |
| GPALPP1 | SNV | Missense_Mutation | novel | c.307G>A | p.Asp103Asn | p.D103N | Q8IXQ4 | protein_coding | tolerated(0.19) | benign(0.031) | TCGA-OL-A66H-01 | Breast | breast invasive carcinoma | Female | >=65 | I/II | Unknown | Unknown | SD |
| GPALPP1 | SNV | Missense_Mutation | c.319N>T | p.Pro107Ser | p.P107S | Q8IXQ4 | protein_coding | tolerated(0.55) | benign(0.003) | TCGA-C5-A8XJ-01 | Cervix | cervical & endocervical cancer | Female | >=65 | I/II | Chemotherapy | cisplatin | SD | |
| GPALPP1 | SNV | Missense_Mutation | c.916N>C | p.Asp306His | p.D306H | Q8IXQ4 | protein_coding | deleterious(0) | probably_damaging(1) | TCGA-VS-A8QA-01 | Cervix | cervical & endocervical cancer | Female | <65 | I/II | Unknown | Unknown | SD | |
| GPALPP1 | SNV | Missense_Mutation | c.646A>G | p.Thr216Ala | p.T216A | Q8IXQ4 | protein_coding | tolerated(0.16) | benign(0.012) | TCGA-A6-6780-01 | Colorectum | colon adenocarcinoma | Male | >=65 | I/II | Unknown | Unknown | SD | |
| GPALPP1 | SNV | Missense_Mutation | c.499A>G | p.Arg167Gly | p.R167G | Q8IXQ4 | protein_coding | deleterious(0) | probably_damaging(0.993) | TCGA-D5-6927-01 | Colorectum | colon adenocarcinoma | Male | <65 | I/II | Unknown | Unknown | SD | |
| GPALPP1 | SNV | Missense_Mutation | novel | c.971C>A | p.Ser324Tyr | p.S324Y | Q8IXQ4 | protein_coding | deleterious(0) | probably_damaging(0.995) | TCGA-AG-A002-01 | Colorectum | rectum adenocarcinoma | Male | <65 | I/II | Unknown | Unknown | SD |
| GPALPP1 | SNV | Missense_Mutation | novel | c.632N>T | p.Arg211Ile | p.R211I | Q8IXQ4 | protein_coding | deleterious(0) | possibly_damaging(0.859) | TCGA-A5-A0G2-01 | Endometrium | uterine corpus endometrioid carcinoma | Female | <65 | III/IV | Unknown | Unknown | SD |
| Page: 1 2 3 4 |
Top |
Related drugs of malignant transformation related genes |
| Identification of chemicals and drugs interact with genes involved in malignant transfromation |
| (DGIdb 4.0) |
| Entrez ID | Symbol | Category | Interaction Types | Drug Claim Name | Drug Name | PMIDs |
| Page: 1 |

Copyright 2023-Present -The University of Texas Health Science Center at Houston |