
|
|||||
|
 | |
| |
| |
| |
| |
| |
|
Gene: GPAA1 |
Gene summary for GPAA1 |
| Gene information | Species | Human | Gene symbol | GPAA1 | Gene ID | 8733 |
| Gene name | glycosylphosphatidylinositol anchor attachment 1 | |
| Gene Alias | GAA1 | |
| Cytomap | 8q24.3 | |
| Gene Type | protein-coding | GO ID | GO:0006464 | UniProtAcc | O43292 |
Top |
Malignant transformation analysis |
| Identification of the aberrant gene expression in precancerous and cancerous lesions by comparing the gene expression of stem-like cells in diseased tissues with normal stem cells |
| Entrez ID | Symbol | Replicates | Species | Organ | Tissue | Adj P-value | Log2FC | Malignancy |
| 8733 | GPAA1 | GSM4909281 | Human | Breast | IDC | 8.16e-23 | 5.45e-01 | 0.21 |
| 8733 | GPAA1 | GSM4909285 | Human | Breast | IDC | 6.71e-19 | 4.61e-01 | 0.21 |
| 8733 | GPAA1 | GSM4909304 | Human | Breast | IDC | 9.87e-07 | 2.72e-01 | 0.1636 |
| 8733 | GPAA1 | GSM4909306 | Human | Breast | IDC | 3.76e-18 | 5.24e-01 | 0.1564 |
| 8733 | GPAA1 | GSM4909311 | Human | Breast | IDC | 7.53e-12 | 5.44e-02 | 0.1534 |
| 8733 | GPAA1 | GSM4909312 | Human | Breast | IDC | 3.72e-16 | 4.75e-01 | 0.1552 |
| 8733 | GPAA1 | GSM4909317 | Human | Breast | IDC | 7.08e-07 | 3.95e-01 | 0.1355 |
| 8733 | GPAA1 | GSM4909319 | Human | Breast | IDC | 5.67e-14 | 2.73e-02 | 0.1563 |
| 8733 | GPAA1 | GSM4909320 | Human | Breast | IDC | 2.41e-03 | -2.10e-01 | 0.1575 |
| 8733 | GPAA1 | GSM4909321 | Human | Breast | IDC | 6.36e-04 | 3.63e-02 | 0.1559 |
| 8733 | GPAA1 | brca2 | Human | Breast | Precancer | 2.61e-06 | 2.50e-01 | -0.024 |
| 8733 | GPAA1 | brca3 | Human | Breast | Precancer | 2.69e-07 | 1.92e-01 | -0.0263 |
| 8733 | GPAA1 | NCCBC14 | Human | Breast | DCIS | 7.59e-06 | -1.68e-01 | 0.2021 |
| 8733 | GPAA1 | NCCBC5 | Human | Breast | DCIS | 2.89e-04 | -3.25e-02 | 0.2046 |
| 8733 | GPAA1 | P1 | Human | Breast | IDC | 1.80e-07 | -1.33e-01 | 0.1527 |
| 8733 | GPAA1 | DCIS2 | Human | Breast | DCIS | 3.87e-42 | 8.82e-02 | 0.0085 |
| 8733 | GPAA1 | HTA11_3410_2000001011 | Human | Colorectum | AD | 1.01e-08 | 3.32e-01 | 0.0155 |
| 8733 | GPAA1 | HTA11_2487_2000001011 | Human | Colorectum | SER | 1.54e-10 | 4.82e-01 | -0.1808 |
| 8733 | GPAA1 | HTA11_1938_2000001011 | Human | Colorectum | AD | 6.23e-08 | 4.04e-01 | -0.0811 |
| 8733 | GPAA1 | HTA11_78_2000001011 | Human | Colorectum | AD | 4.25e-02 | 2.66e-01 | -0.1088 |
| Page: 1 2 3 4 5 6 7 8 9 |
| Tissue | Expression Dynamics | Abbreviation |
| Breast | 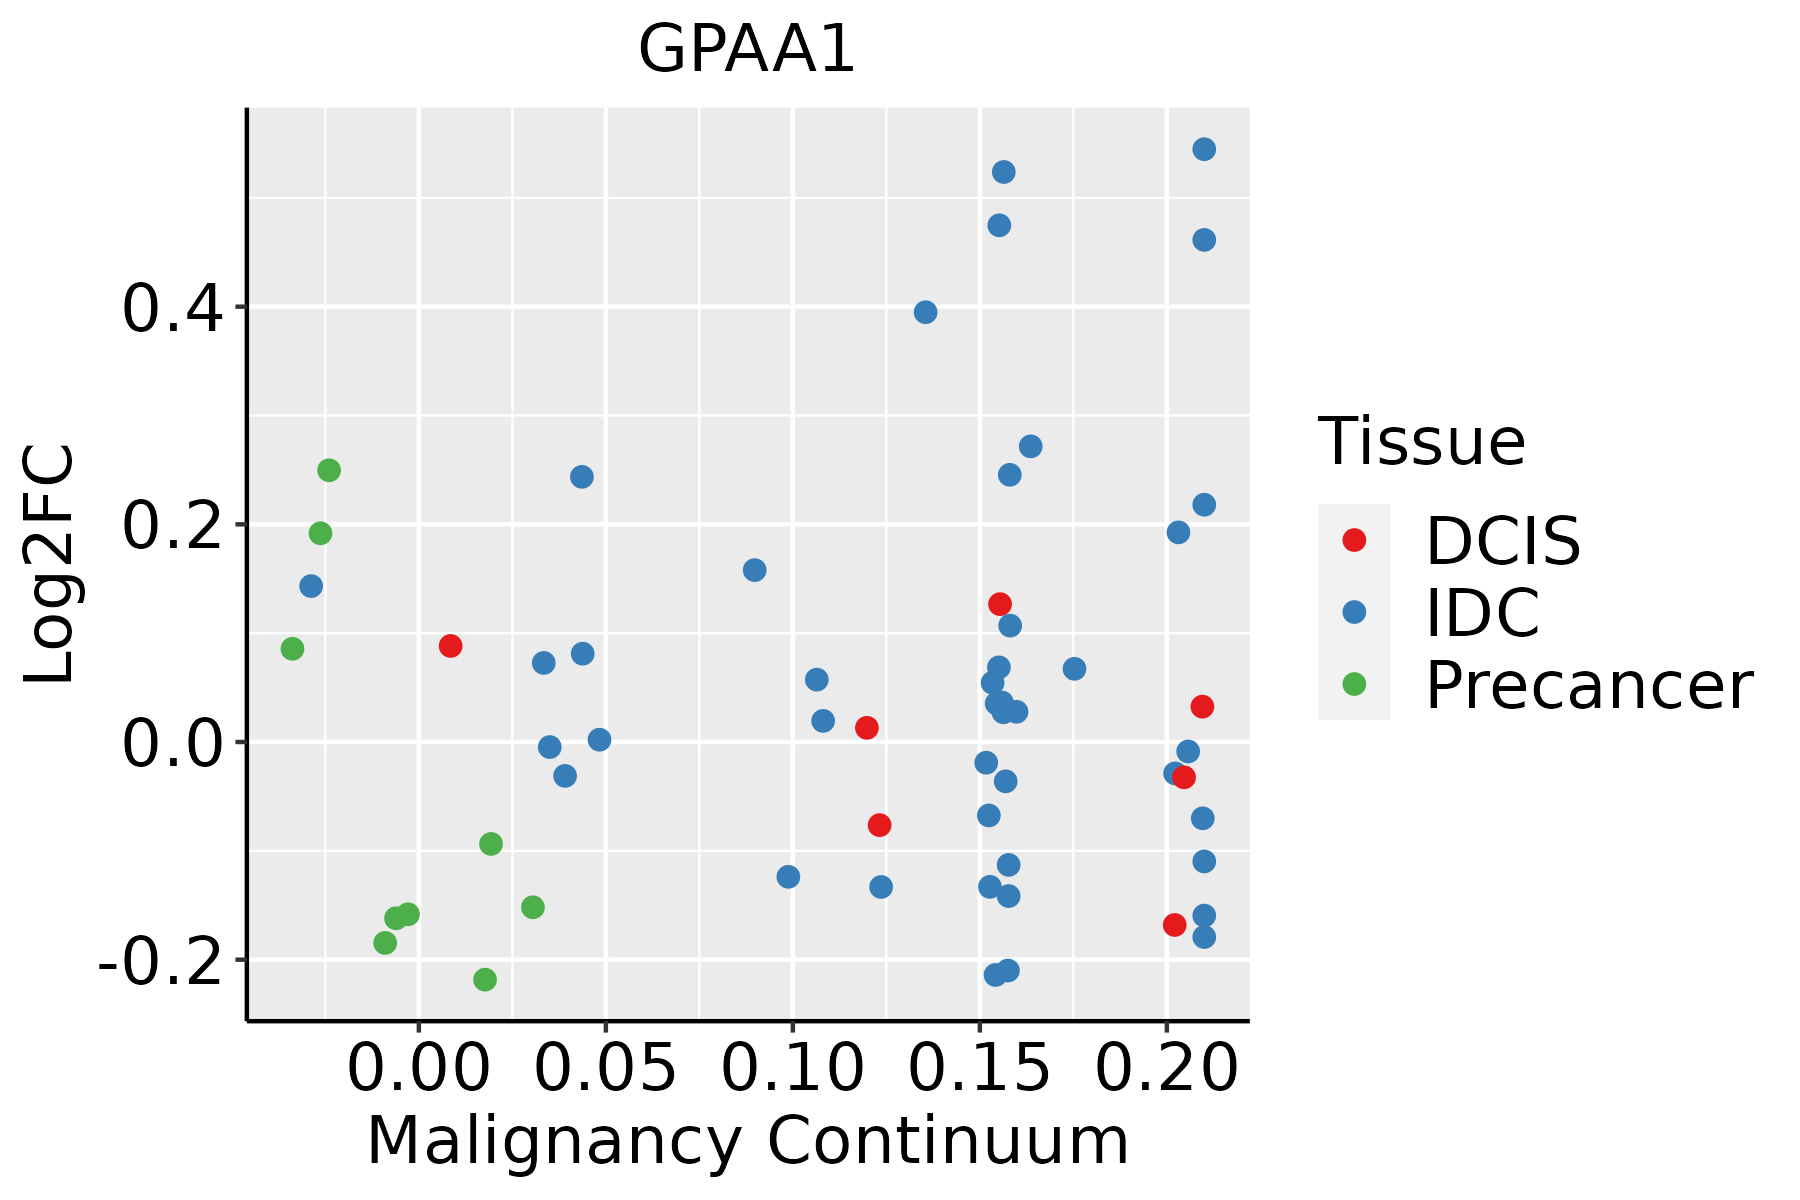 | IDC: Invasive ductal carcinoma |
| DCIS: Ductal carcinoma in situ | ||
| Precancer(BRCA1-mut): Precancerous lesion from BRCA1 mutation carriers | ||
| Colorectum (GSE201348) |  | FAP: Familial adenomatous polyposis |
| CRC: Colorectal cancer | ||
| Colorectum (HTA11) |  | AD: Adenomas |
| SER: Sessile serrated lesions | ||
| MSI-H: Microsatellite-high colorectal cancer | ||
| MSS: Microsatellite stable colorectal cancer | ||
| Esophagus |  | ESCC: Esophageal squamous cell carcinoma |
| HGIN: High-grade intraepithelial neoplasias | ||
| LGIN: Low-grade intraepithelial neoplasias | ||
| Liver | 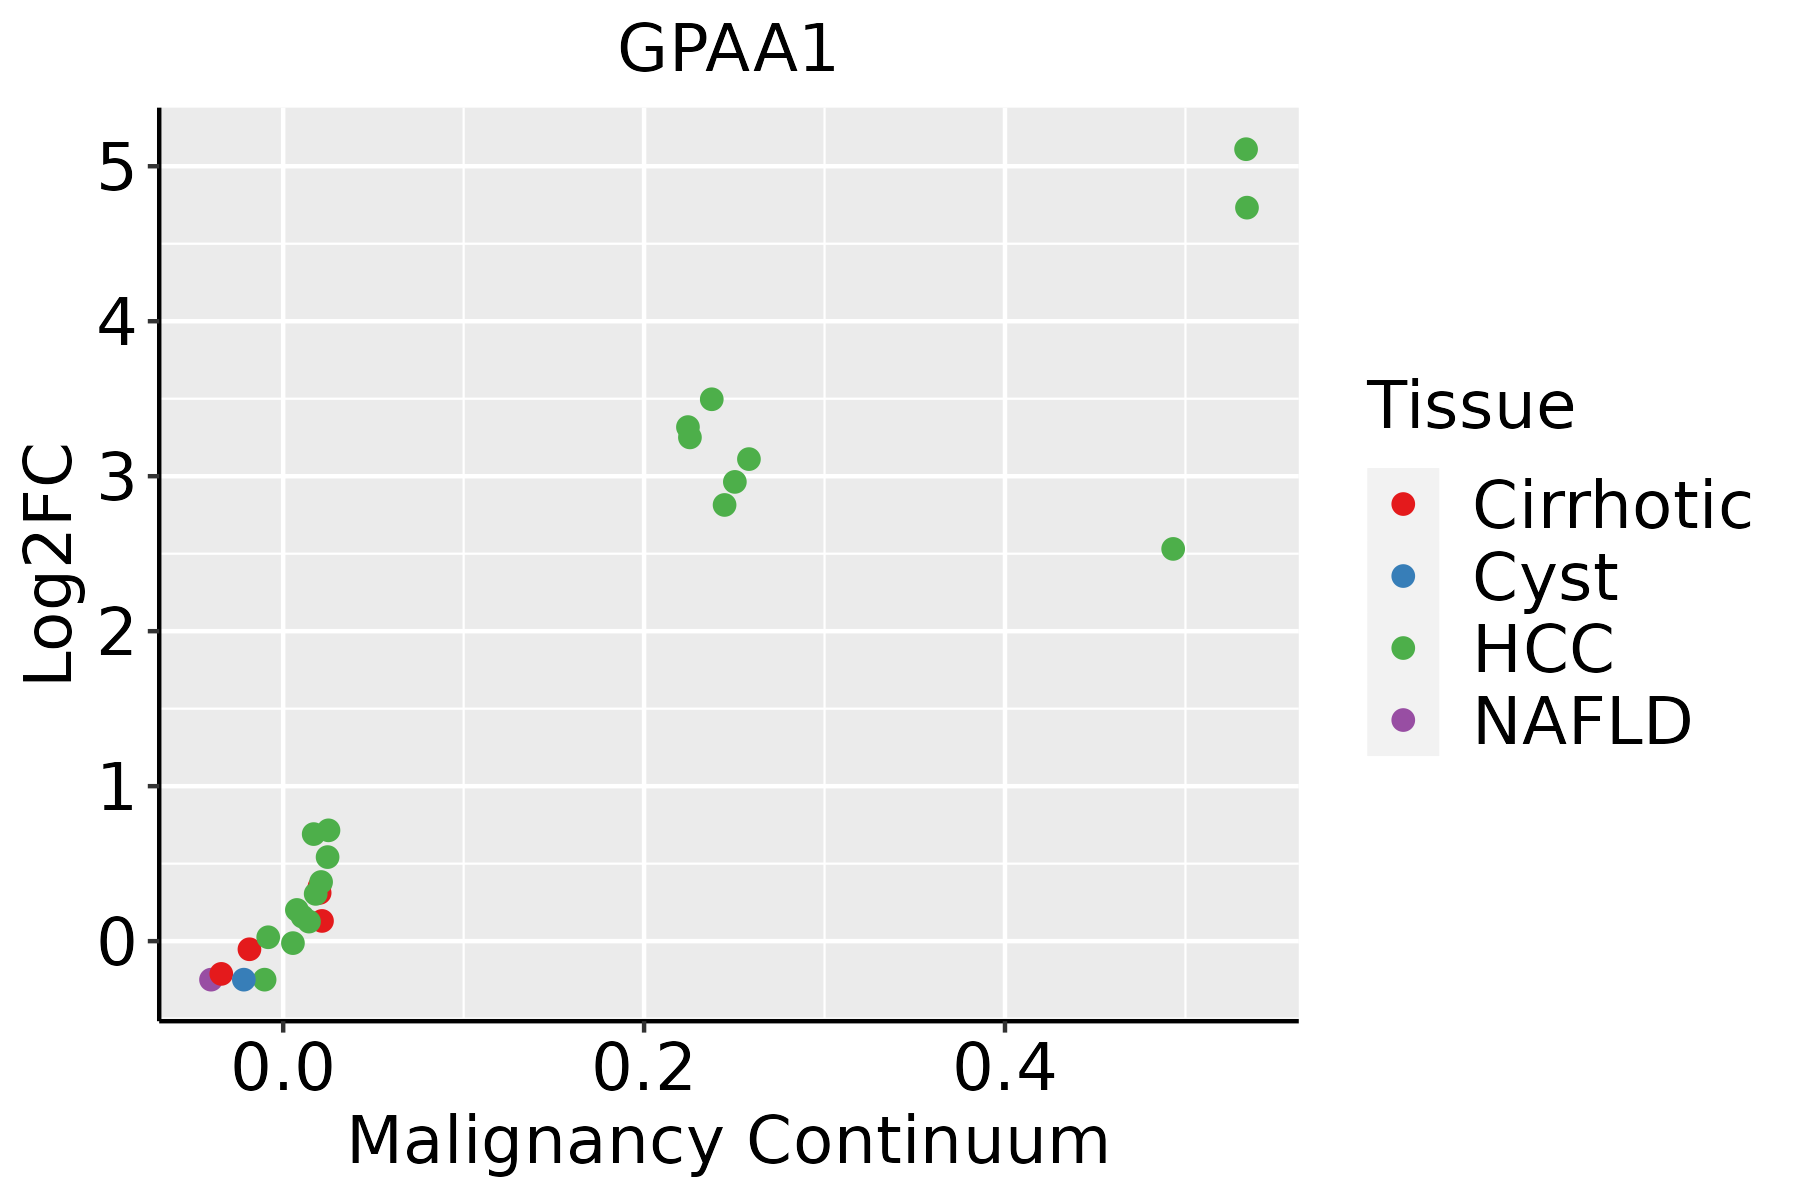 | HCC: Hepatocellular carcinoma |
| NAFLD: Non-alcoholic fatty liver disease | ||
| Oral Cavity | 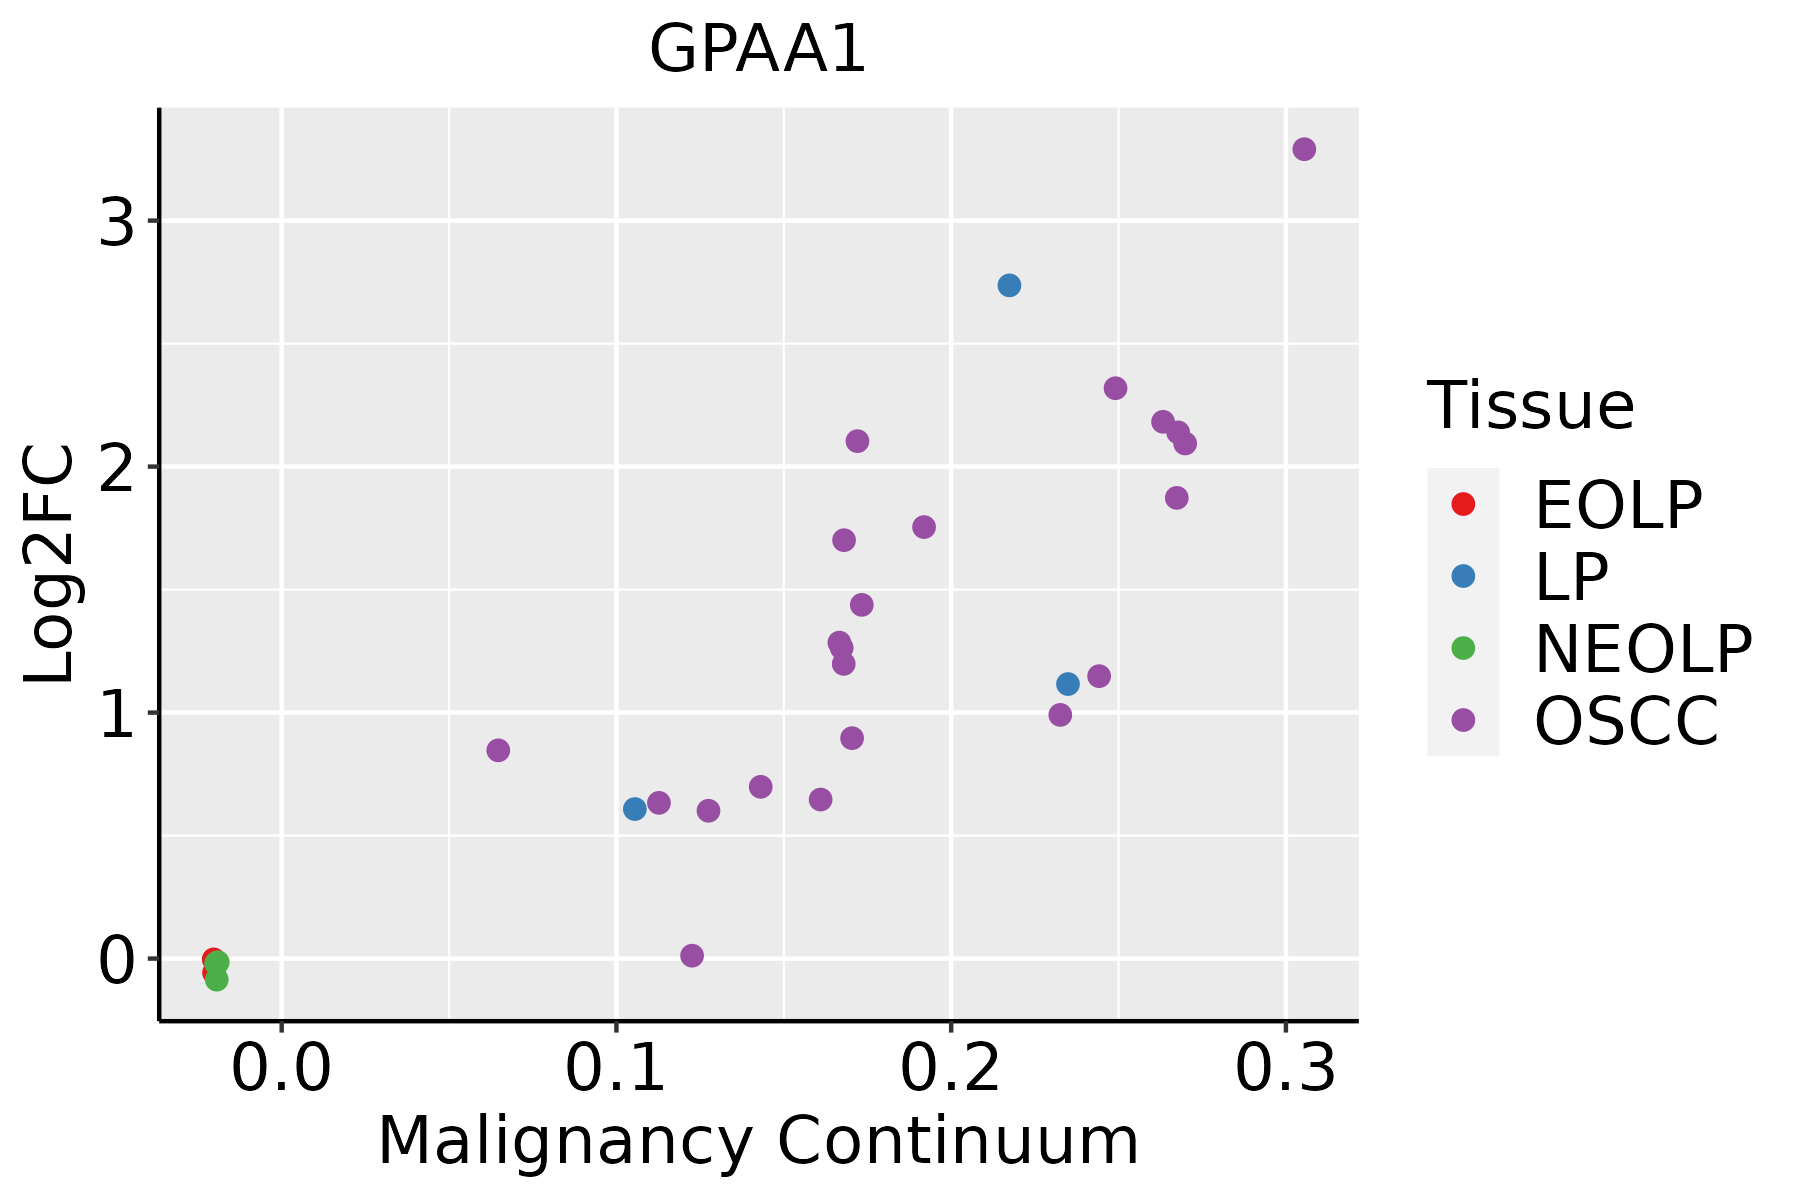 | EOLP: Erosive Oral lichen planus |
| LP: leukoplakia | ||
| NEOLP: Non-erosive oral lichen planus | ||
| OSCC: Oral squamous cell carcinoma | ||
| Prostate | 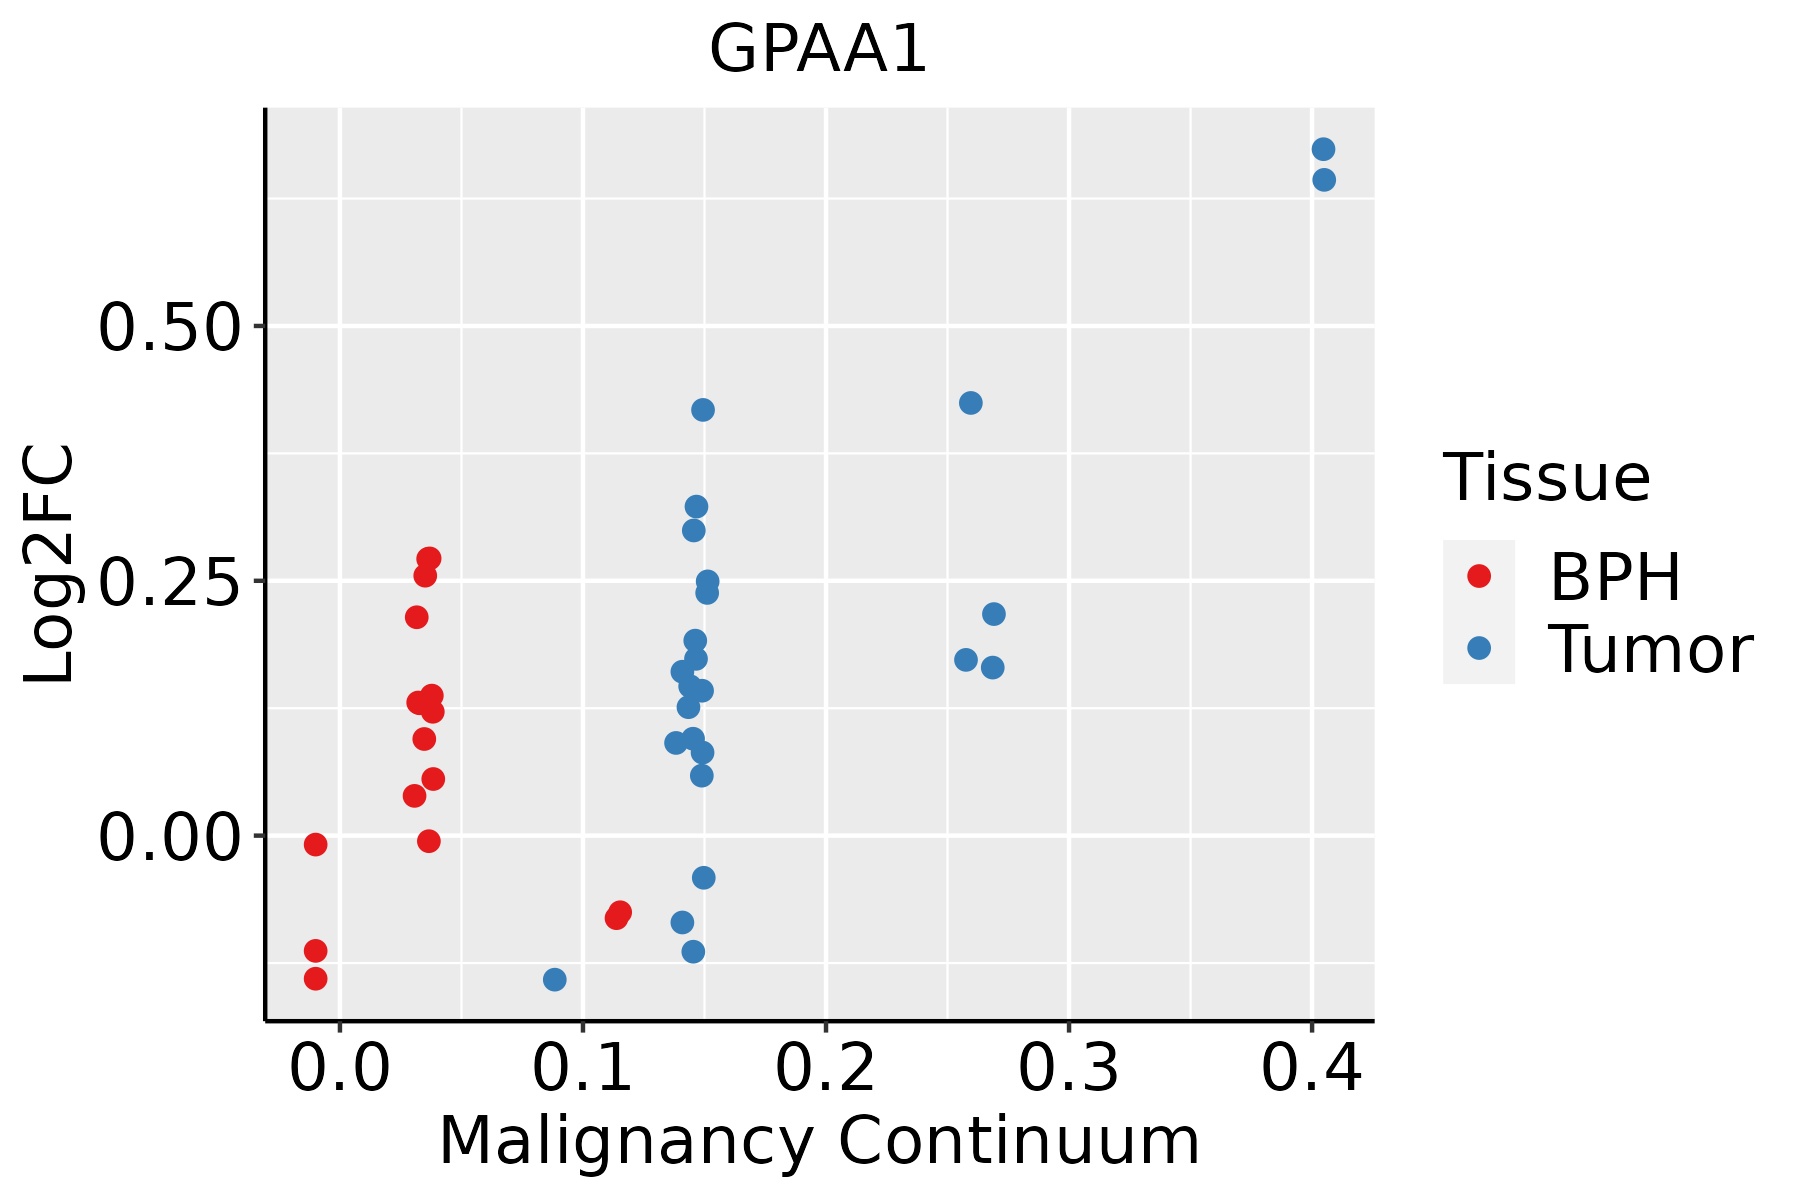 | BPH: Benign Prostatic Hyperplasia |
| Skin |  | AK: Actinic keratosis |
| cSCC: Cutaneous squamous cell carcinoma | ||
| SCCIS:squamous cell carcinoma in situ | ||
| Thyroid | 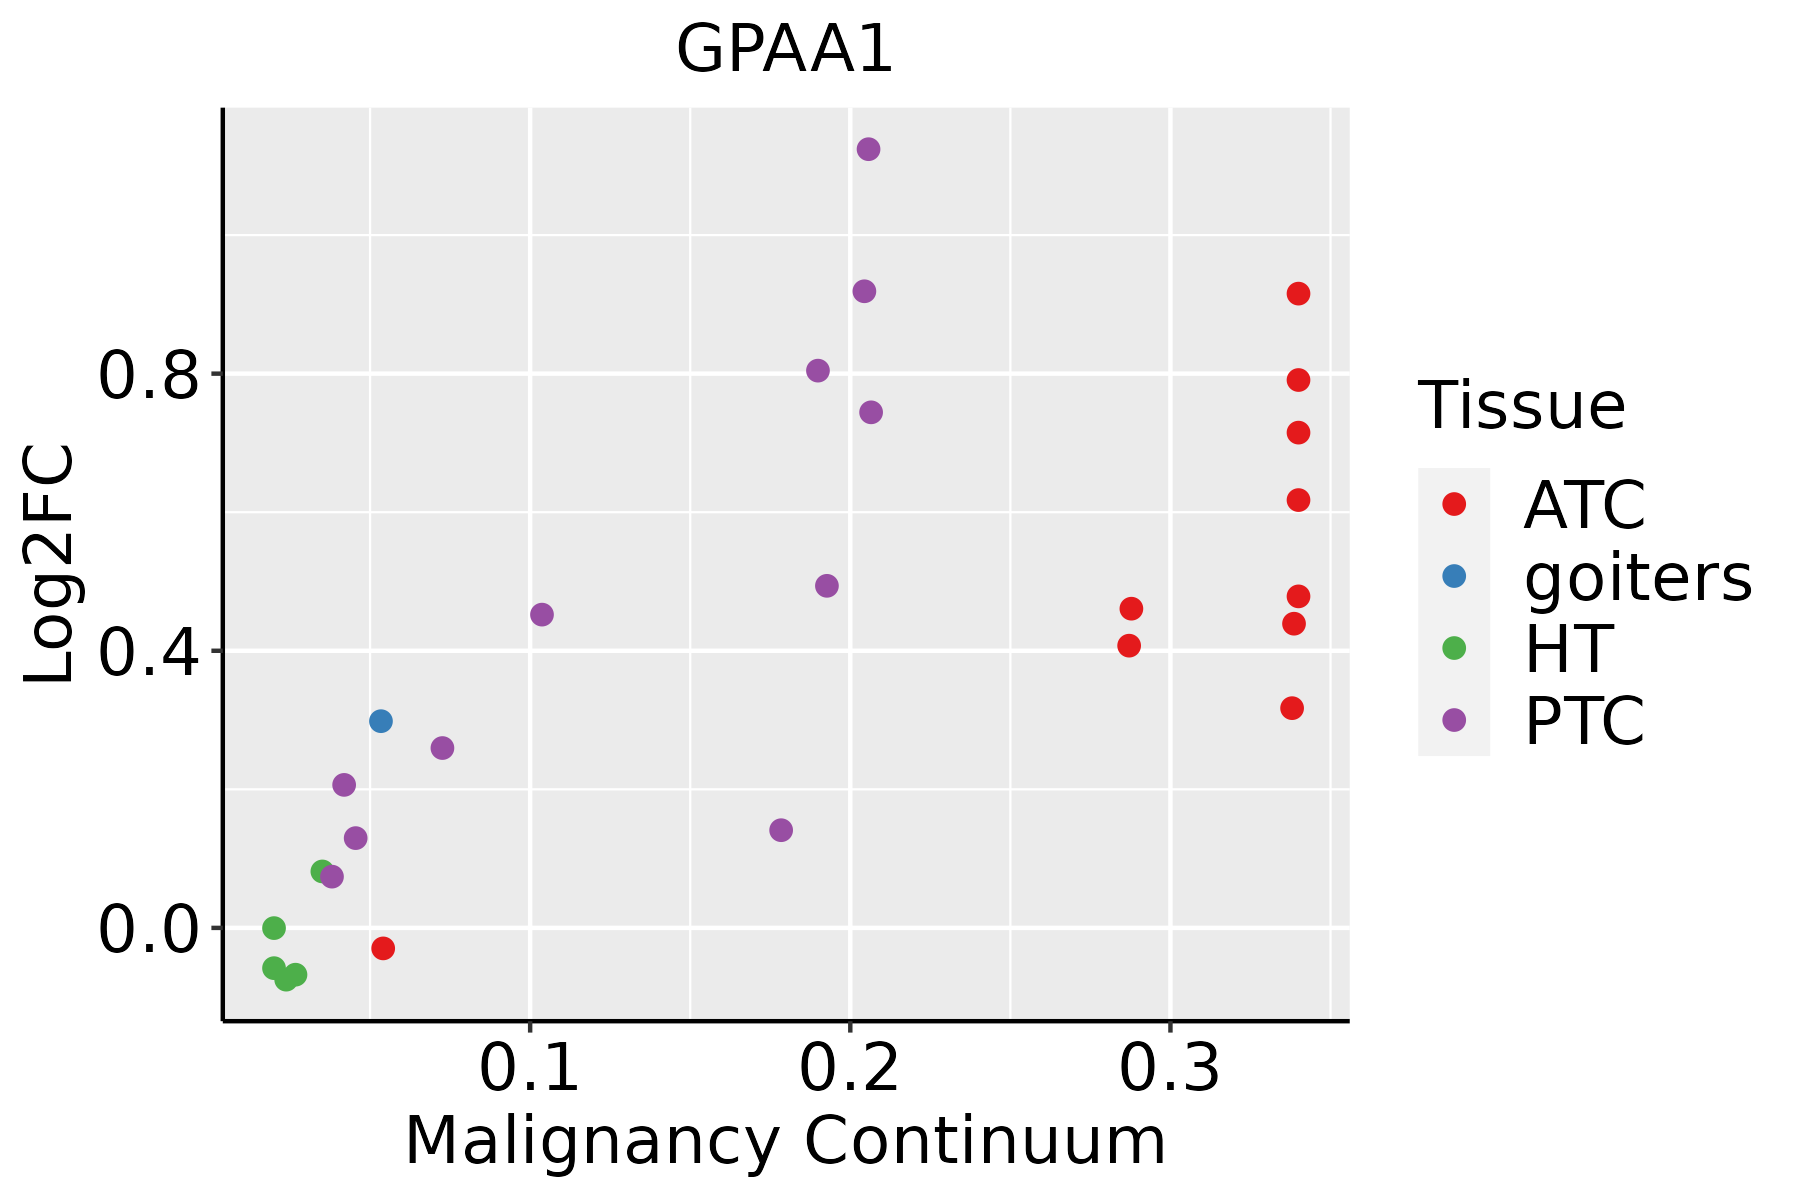 | ATC: Anaplastic thyroid cancer |
| HT: Hashimoto's thyroiditis | ||
| PTC: Papillary thyroid cancer |
| ∗log2FC in expression of this searched gene in stem-like cells from each diseased tissue sample relative to stem-like cells in normal samples in each tissue plotted against the malignancy continuum. Samples are colored based on if they are from different disease stage. |
Top |
Malignant transformation related pathway analysis |
| Find out the enriched GO biological processes and KEGG pathways involved in transition from healthy to precancer to cancer |
| Tissue | Disease Stage | Enriched GO biological Processes |
| Colorectum | AD |  |
| Colorectum | SER |  |
| Colorectum | MSS |  |
| Colorectum | MSI-H |  |
| Colorectum | FAP |  |
| ∗Top 15 enriched GO BP terms are showed in the bar plot of each disease state in each tissue. Each row represents a significant GO biological process which is colored according to the -log10(p.adjust). |
| Page: 1 2 3 4 5 6 7 8 9 |
| GO ID | Tissue | Disease Stage | Description | Gene Ratio | Bg Ratio | pvalue | p.adjust | Count |
| GO:00451859 | Breast | Precancer | maintenance of protein location | 19/1080 | 94/18723 | 1.43e-06 | 5.35e-05 | 19 |
| GO:00512358 | Breast | Precancer | maintenance of location | 40/1080 | 327/18723 | 5.85e-06 | 1.71e-04 | 40 |
| GO:00516519 | Breast | Precancer | maintenance of location in cell | 30/1080 | 214/18723 | 5.91e-06 | 1.71e-04 | 30 |
| GO:00325076 | Breast | Precancer | maintenance of protein location in cell | 14/1080 | 65/18723 | 1.59e-05 | 3.89e-04 | 14 |
| GO:00709725 | Breast | Precancer | protein localization to endoplasmic reticulum | 15/1080 | 74/18723 | 1.74e-05 | 4.17e-04 | 15 |
| GO:00725954 | Breast | Precancer | maintenance of protein localization in organelle | 10/1080 | 42/18723 | 1.06e-04 | 1.93e-03 | 10 |
| GO:00354373 | Breast | Precancer | maintenance of protein localization in endoplasmic reticulum | 4/1080 | 14/18723 | 6.92e-03 | 4.67e-02 | 4 |
| GO:005165114 | Breast | IDC | maintenance of location in cell | 37/1434 | 214/18723 | 2.39e-06 | 9.35e-05 | 37 |
| GO:004518514 | Breast | IDC | maintenance of protein location | 21/1434 | 94/18723 | 6.69e-06 | 2.05e-04 | 21 |
| GO:007097213 | Breast | IDC | protein localization to endoplasmic reticulum | 18/1434 | 74/18723 | 8.58e-06 | 2.47e-04 | 18 |
| GO:005123513 | Breast | IDC | maintenance of location | 48/1434 | 327/18723 | 9.90e-06 | 2.77e-04 | 48 |
| GO:003250714 | Breast | IDC | maintenance of protein location in cell | 16/1434 | 65/18723 | 2.29e-05 | 5.51e-04 | 16 |
| GO:007259512 | Breast | IDC | maintenance of protein localization in organelle | 12/1434 | 42/18723 | 4.94e-05 | 1.08e-03 | 12 |
| GO:00354371 | Breast | IDC | maintenance of protein localization in endoplasmic reticulum | 6/1434 | 14/18723 | 3.50e-04 | 5.13e-03 | 6 |
| GO:005165123 | Breast | DCIS | maintenance of location in cell | 36/1390 | 214/18723 | 3.07e-06 | 1.02e-04 | 36 |
| GO:004518521 | Breast | DCIS | maintenance of protein location | 21/1390 | 94/18723 | 4.12e-06 | 1.24e-04 | 21 |
| GO:007097222 | Breast | DCIS | protein localization to endoplasmic reticulum | 18/1390 | 74/18723 | 5.57e-06 | 1.60e-04 | 18 |
| GO:005123523 | Breast | DCIS | maintenance of location | 47/1390 | 327/18723 | 9.55e-06 | 2.56e-04 | 47 |
| GO:003250722 | Breast | DCIS | maintenance of protein location in cell | 16/1390 | 65/18723 | 1.56e-05 | 3.79e-04 | 16 |
| GO:007259521 | Breast | DCIS | maintenance of protein localization in organelle | 12/1390 | 42/18723 | 3.64e-05 | 7.86e-04 | 12 |
| Page: 1 2 3 4 5 6 7 8 9 |
| Pathway ID | Tissue | Disease Stage | Description | Gene Ratio | Bg Ratio | pvalue | p.adjust | qvalue | Count |
| hsa005632 | Esophagus | ESCC | Glycosylphosphatidylinositol (GPI)-anchor biosynthesis | 21/4205 | 26/8465 | 1.10e-03 | 3.42e-03 | 1.75e-03 | 21 |
| hsa0056311 | Esophagus | ESCC | Glycosylphosphatidylinositol (GPI)-anchor biosynthesis | 21/4205 | 26/8465 | 1.10e-03 | 3.42e-03 | 1.75e-03 | 21 |
| hsa00563 | Liver | HCC | Glycosylphosphatidylinositol (GPI)-anchor biosynthesis | 18/4020 | 26/8465 | 2.08e-02 | 4.81e-02 | 2.68e-02 | 18 |
| hsa005631 | Liver | HCC | Glycosylphosphatidylinositol (GPI)-anchor biosynthesis | 18/4020 | 26/8465 | 2.08e-02 | 4.81e-02 | 2.68e-02 | 18 |
| Page: 1 |
Top |
Cell-cell communication analysis |
| Identification of potential cell-cell interactions between two cell types and their ligand-receptor pairs for different disease states |
| Ligand | Receptor | LRpair | Pathway | Tissue | Disease Stage |
| Page: 1 |
Top |
Single-cell gene regulatory network inference analysis |
| Find out the significant the regulons (TFs) and the target genes of each regulon across cell types for different disease states |
| TF | Cell Type | Tissue | Disease Stage | Target Gene | RSS | Regulon Activity |
| ∗The dot plots of a searched regulon are shown for all cell subpopulations in each disease state of each tissue based on the regulon specific score inferred using pySCENIC and by calculating the average expression. |
| Page: 1 |
Top |
Somatic mutation of malignant transformation related genes |
| Annotation of somatic variants for genes involved in malignant transformation |
| Hugo Symbol | Variant Class | Variant Classification | dbSNP RS | HGVSc | HGVSp | HGVSp Short | SWISSPROT | BIOTYPE | SIFT | PolyPhen | Tumor Sample Barcode | Tissue | Histology | Sex | Age | Stage | Therapy Types | Drugs | Outcome |
| GPAA1 | SNV | Missense_Mutation | novel | c.1550A>C | p.Asn517Thr | p.N517T | O43292 | protein_coding | deleterious(0) | probably_damaging(0.997) | TCGA-A8-A09I-01 | Breast | breast invasive carcinoma | Female | >=65 | I/II | Hormone Therapy | anastrozole | SD |
| GPAA1 | SNV | Missense_Mutation | rs781828534 | c.442N>A | p.Val148Met | p.V148M | O43292 | protein_coding | deleterious(0.01) | possibly_damaging(0.903) | TCGA-2W-A8YY-01 | Cervix | cervical & endocervical cancer | Female | <65 | I/II | Chemotherapy | cisplatin | CR |
| GPAA1 | SNV | Missense_Mutation | c.246N>T | p.Lys82Asn | p.K82N | O43292 | protein_coding | tolerated(0.14) | benign(0.046) | TCGA-C5-A7UH-01 | Cervix | cervical & endocervical cancer | Female | <65 | III/IV | Chemotherapy | cisplatin | SD | |
| GPAA1 | SNV | Missense_Mutation | c.577N>A | p.Glu193Lys | p.E193K | O43292 | protein_coding | deleterious(0.02) | possibly_damaging(0.626) | TCGA-C5-A7UH-01 | Cervix | cervical & endocervical cancer | Female | <65 | III/IV | Chemotherapy | cisplatin | SD | |
| GPAA1 | SNV | Missense_Mutation | rs369617537 | c.958C>T | p.Arg320Cys | p.R320C | O43292 | protein_coding | deleterious(0) | probably_damaging(0.926) | TCGA-AA-3966-01 | Colorectum | colon adenocarcinoma | Female | >=65 | I/II | Unknown | Unknown | SD |
| GPAA1 | SNV | Missense_Mutation | c.535G>T | p.Asp179Tyr | p.D179Y | O43292 | protein_coding | deleterious(0) | probably_damaging(1) | TCGA-AA-A010-01 | Colorectum | colon adenocarcinoma | Female | <65 | I/II | Chemotherapy | folinic | CR | |
| GPAA1 | SNV | Missense_Mutation | c.857G>T | p.Gly286Val | p.G286V | O43292 | protein_coding | deleterious(0.03) | benign(0.081) | TCGA-CM-5864-01 | Colorectum | colon adenocarcinoma | Male | <65 | I/II | Unknown | Unknown | SD | |
| GPAA1 | SNV | Missense_Mutation | c.156N>C | p.Glu52Asp | p.E52D | O43292 | protein_coding | deleterious(0.01) | probably_damaging(0.978) | TCGA-G4-6295-01 | Colorectum | colon adenocarcinoma | Female | >=65 | I/II | Unknown | Unknown | SD | |
| GPAA1 | SNV | Missense_Mutation | rs782263637 | c.898N>A | p.Gly300Ser | p.G300S | O43292 | protein_coding | deleterious(0) | probably_damaging(1) | TCGA-EI-6507-01 | Colorectum | rectum adenocarcinoma | Male | <65 | I/II | Unknown | Unknown | SD |
| GPAA1 | SNV | Missense_Mutation | novel | c.1522N>A | p.Leu508Met | p.L508M | O43292 | protein_coding | tolerated(0.17) | benign(0.081) | TCGA-A5-A0G1-01 | Endometrium | uterine corpus endometrioid carcinoma | Female | >=65 | I/II | Unknown | Unknown | SD |
| Page: 1 2 3 4 5 |
Top |
Related drugs of malignant transformation related genes |
| Identification of chemicals and drugs interact with genes involved in malignant transfromation |
| (DGIdb 4.0) |
| Entrez ID | Symbol | Category | Interaction Types | Drug Claim Name | Drug Name | PMIDs |
| Page: 1 |

Copyright 2023-Present -The University of Texas Health Science Center at Houston |