
|
|||||
|
 | |
| |
| |
| |
| |
| |
|
Gene: GON4L |
Gene summary for GON4L |
| Gene information | Species | Human | Gene symbol | GON4L | Gene ID | 54856 |
| Gene name | gon-4 like | |
| Gene Alias | GON-4 | |
| Cytomap | 1q22 | |
| Gene Type | protein-coding | GO ID | GO:0001775 | UniProtAcc | Q3T8J9 |
Top |
Malignant transformation analysis |
| Identification of the aberrant gene expression in precancerous and cancerous lesions by comparing the gene expression of stem-like cells in diseased tissues with normal stem cells |
| Entrez ID | Symbol | Replicates | Species | Organ | Tissue | Adj P-value | Log2FC | Malignancy |
| 54856 | GON4L | CA_HPV_1 | Human | Cervix | CC | 1.09e-02 | 1.13e-02 | 0.0264 |
| 54856 | GON4L | CCI_1 | Human | Cervix | CC | 1.41e-08 | 7.93e-01 | 0.528 |
| 54856 | GON4L | CCI_2 | Human | Cervix | CC | 2.04e-02 | 4.15e-01 | 0.5249 |
| 54856 | GON4L | CCI_3 | Human | Cervix | CC | 1.41e-10 | 7.04e-01 | 0.516 |
| 54856 | GON4L | AEH-subject2 | Human | Endometrium | AEH | 1.35e-08 | 1.07e-01 | -0.2525 |
| 54856 | GON4L | AEH-subject3 | Human | Endometrium | AEH | 4.95e-05 | 2.08e-01 | -0.2576 |
| 54856 | GON4L | EEC-subject2 | Human | Endometrium | EEC | 1.28e-04 | 2.43e-01 | -0.2607 |
| 54856 | GON4L | EEC-subject3 | Human | Endometrium | EEC | 2.63e-07 | 4.05e-02 | -0.2525 |
| 54856 | GON4L | GSM5276935 | Human | Endometrium | EEC | 1.17e-03 | 3.00e-01 | -0.123 |
| 54856 | GON4L | GSM6177620_NYU_UCEC1_lib1_lib1 | Human | Endometrium | EEC | 3.71e-21 | -1.54e-01 | -0.1869 |
| 54856 | GON4L | GSM6177620_NYU_UCEC1_lib2_lib2 | Human | Endometrium | EEC | 6.39e-17 | -2.12e-01 | -0.1875 |
| 54856 | GON4L | GSM6177620_NYU_UCEC1_lib3_lib3 | Human | Endometrium | EEC | 3.29e-19 | -2.19e-01 | -0.1883 |
| 54856 | GON4L | GSM6177621_NYU_UCEC2_lib1_lib1 | Human | Endometrium | EEC | 9.33e-16 | 2.88e-02 | -0.1934 |
| 54856 | GON4L | GSM6177622_NYU_UCEC3_lib1_lib1 | Human | Endometrium | EEC | 3.44e-27 | -1.33e-01 | -0.1917 |
| 54856 | GON4L | GSM6177622_NYU_UCEC3_lib2_lib2 | Human | Endometrium | EEC | 2.96e-25 | -1.37e-01 | -0.1916 |
| 54856 | GON4L | GSM6177623_NYU_UCEC3_Vis | Human | Endometrium | EEC | 1.04e-02 | -8.27e-02 | -0.1269 |
| 54856 | GON4L | LZE2D | Human | Esophagus | HGIN | 1.80e-02 | 5.79e-01 | 0.0642 |
| 54856 | GON4L | LZE2T | Human | Esophagus | ESCC | 4.44e-04 | 6.84e-01 | 0.082 |
| 54856 | GON4L | LZE3D | Human | Esophagus | HGIN | 1.45e-02 | 4.32e-01 | 0.0668 |
| 54856 | GON4L | LZE4T | Human | Esophagus | ESCC | 2.53e-20 | 5.24e-01 | 0.0811 |
| Page: 1 2 3 4 5 6 7 8 |
| Tissue | Expression Dynamics | Abbreviation |
| Cervix | 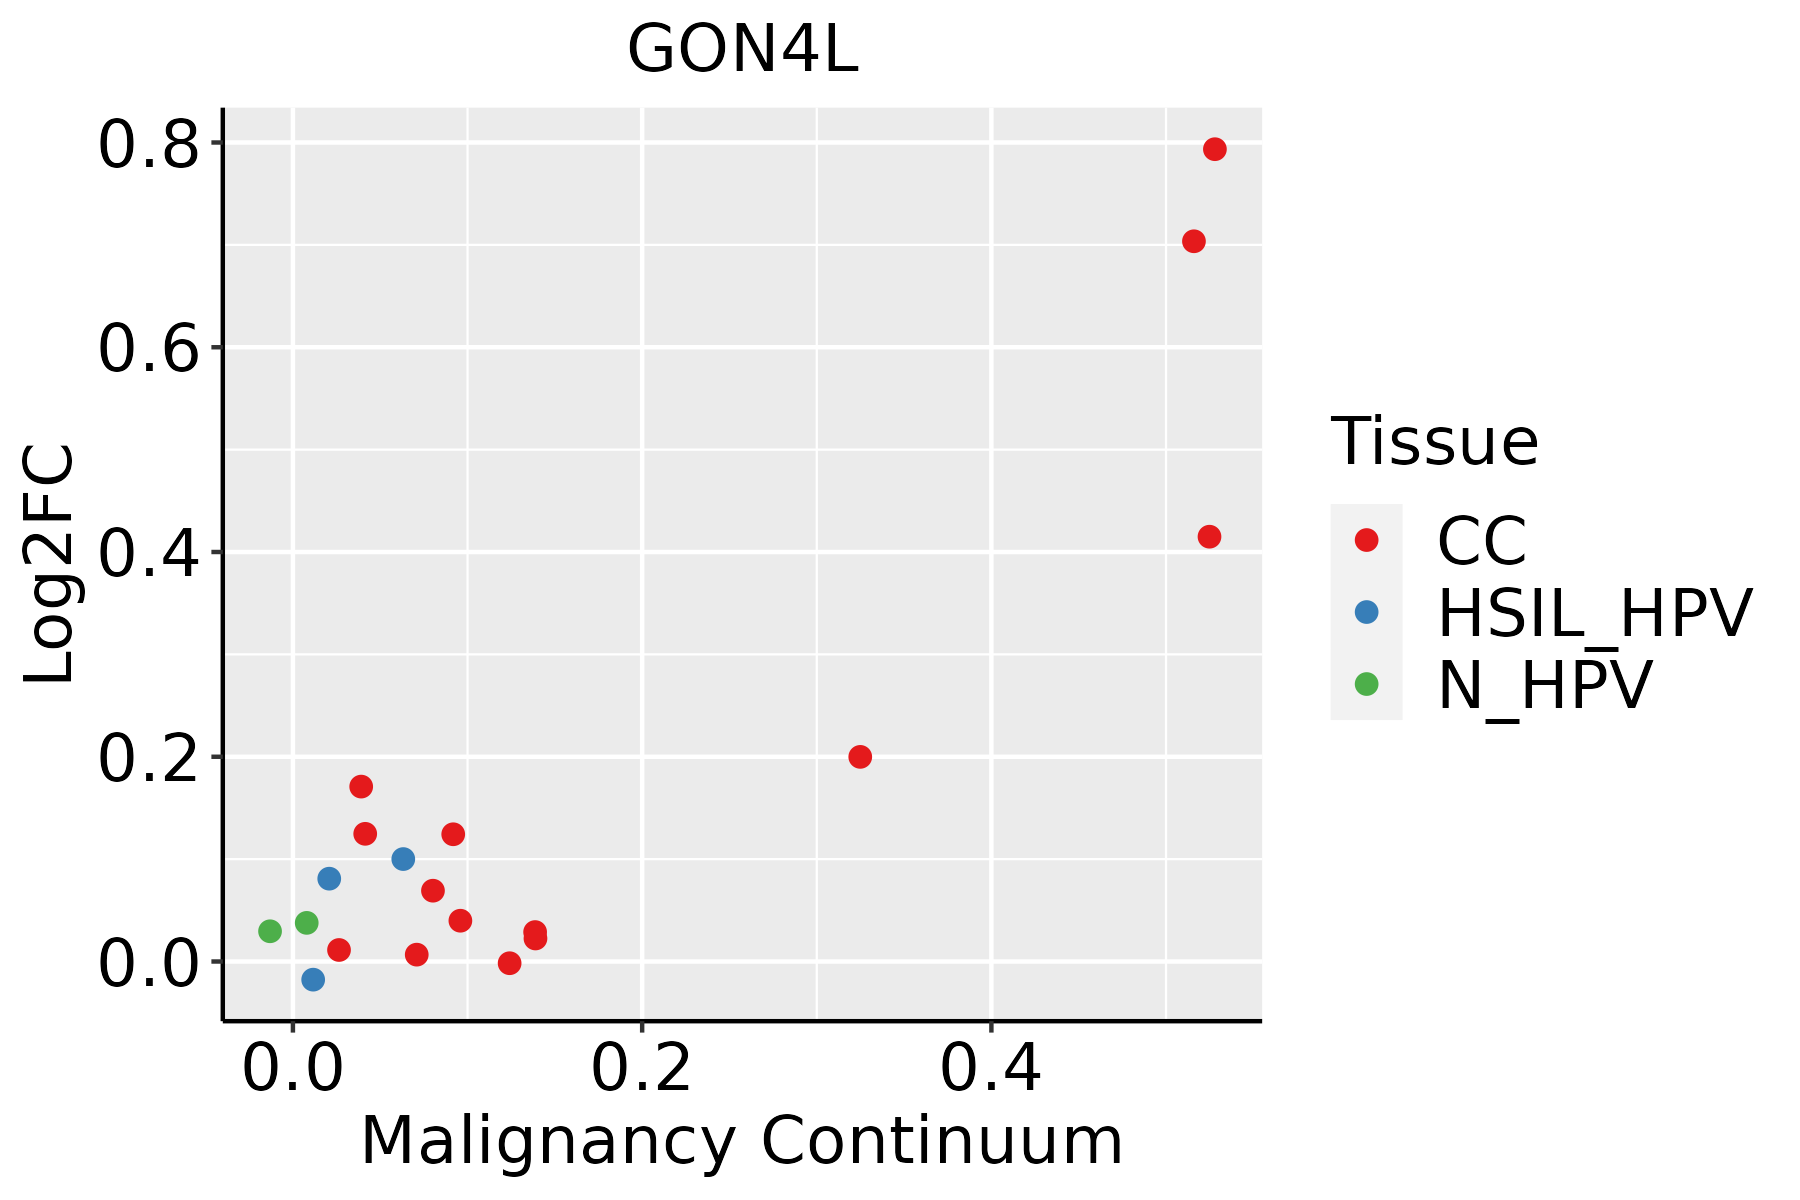 | CC: Cervix cancer |
| HSIL_HPV: HPV-infected high-grade squamous intraepithelial lesions | ||
| N_HPV: HPV-infected normal cervix | ||
| Endometrium | 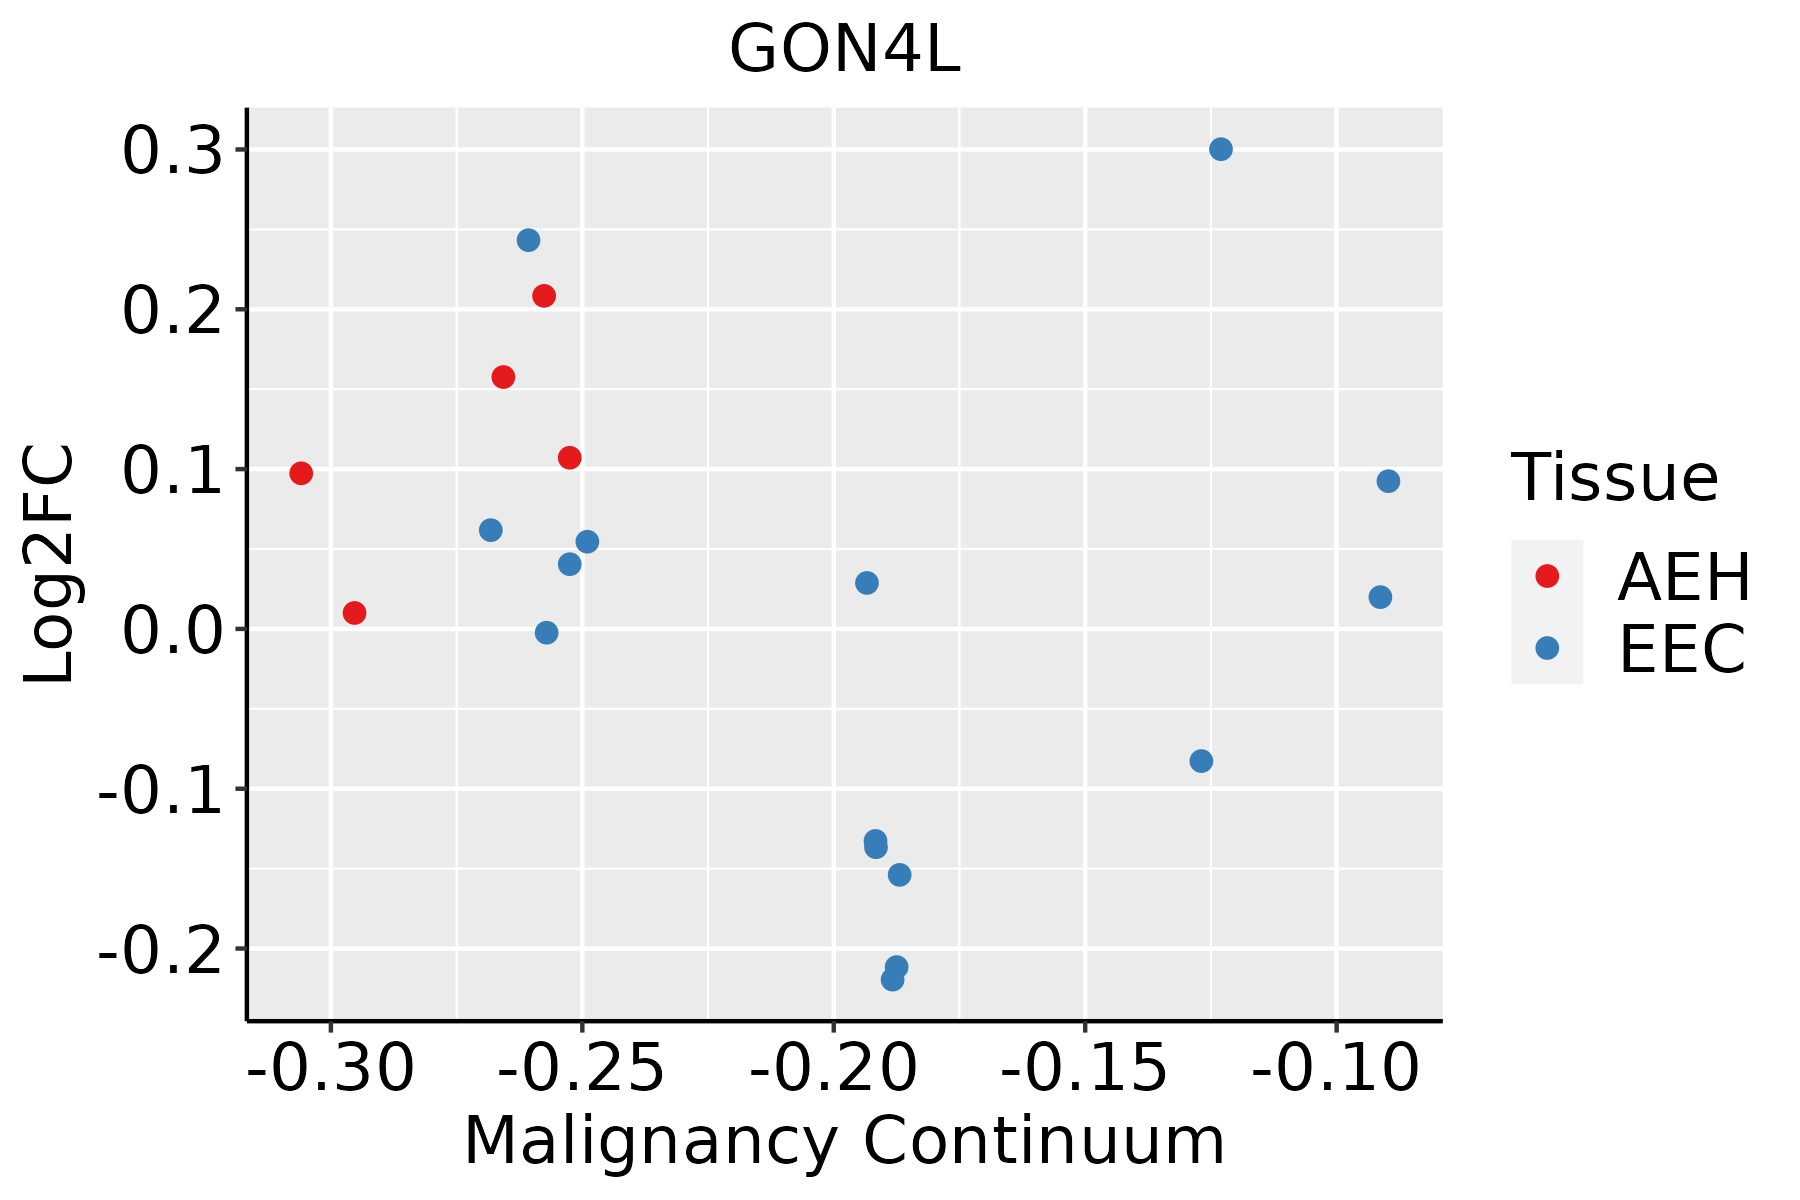 | AEH: Atypical endometrial hyperplasia |
| EEC: Endometrioid Cancer | ||
| Esophagus |  | ESCC: Esophageal squamous cell carcinoma |
| HGIN: High-grade intraepithelial neoplasias | ||
| LGIN: Low-grade intraepithelial neoplasias | ||
| Liver | 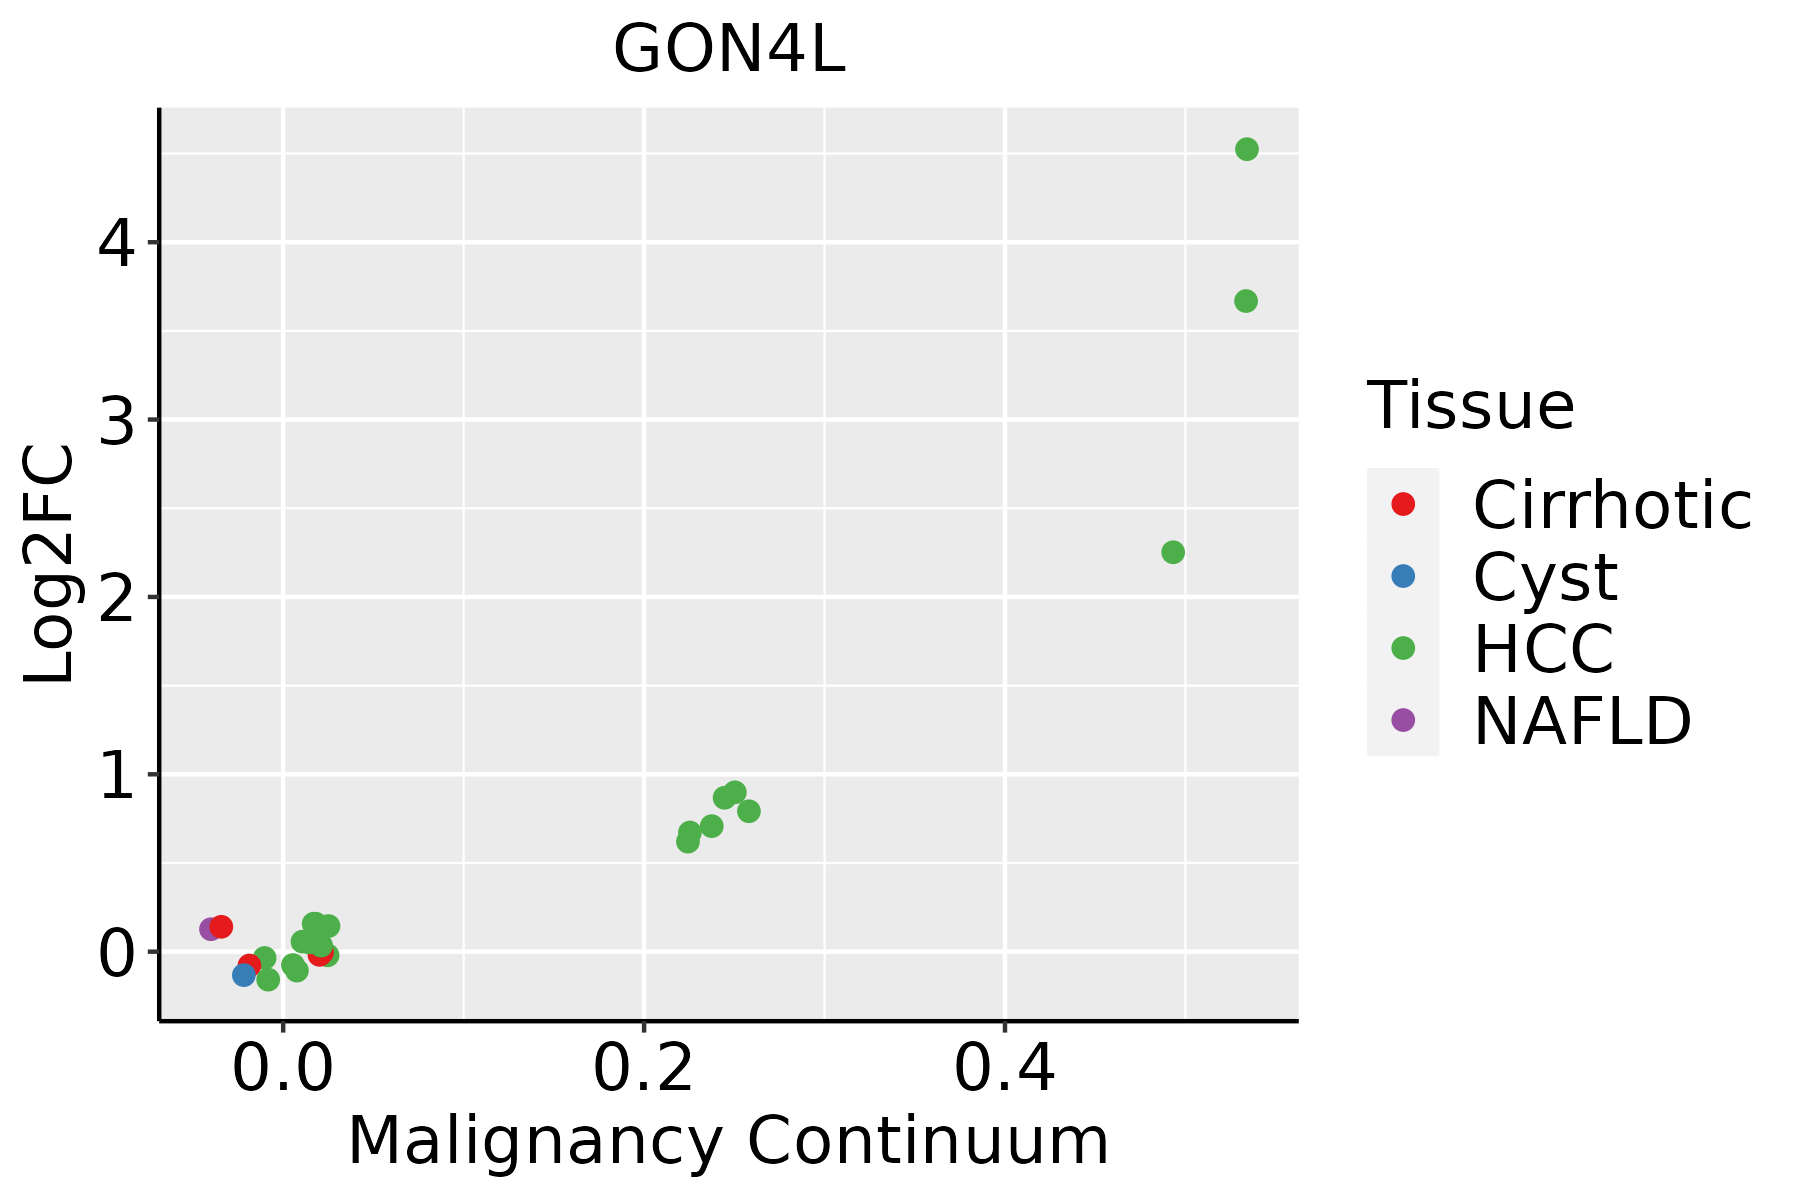 | HCC: Hepatocellular carcinoma |
| NAFLD: Non-alcoholic fatty liver disease | ||
| Lung |  | AAH: Atypical adenomatous hyperplasia |
| AIS: Adenocarcinoma in situ | ||
| IAC: Invasive lung adenocarcinoma | ||
| MIA: Minimally invasive adenocarcinoma | ||
| Oral Cavity | 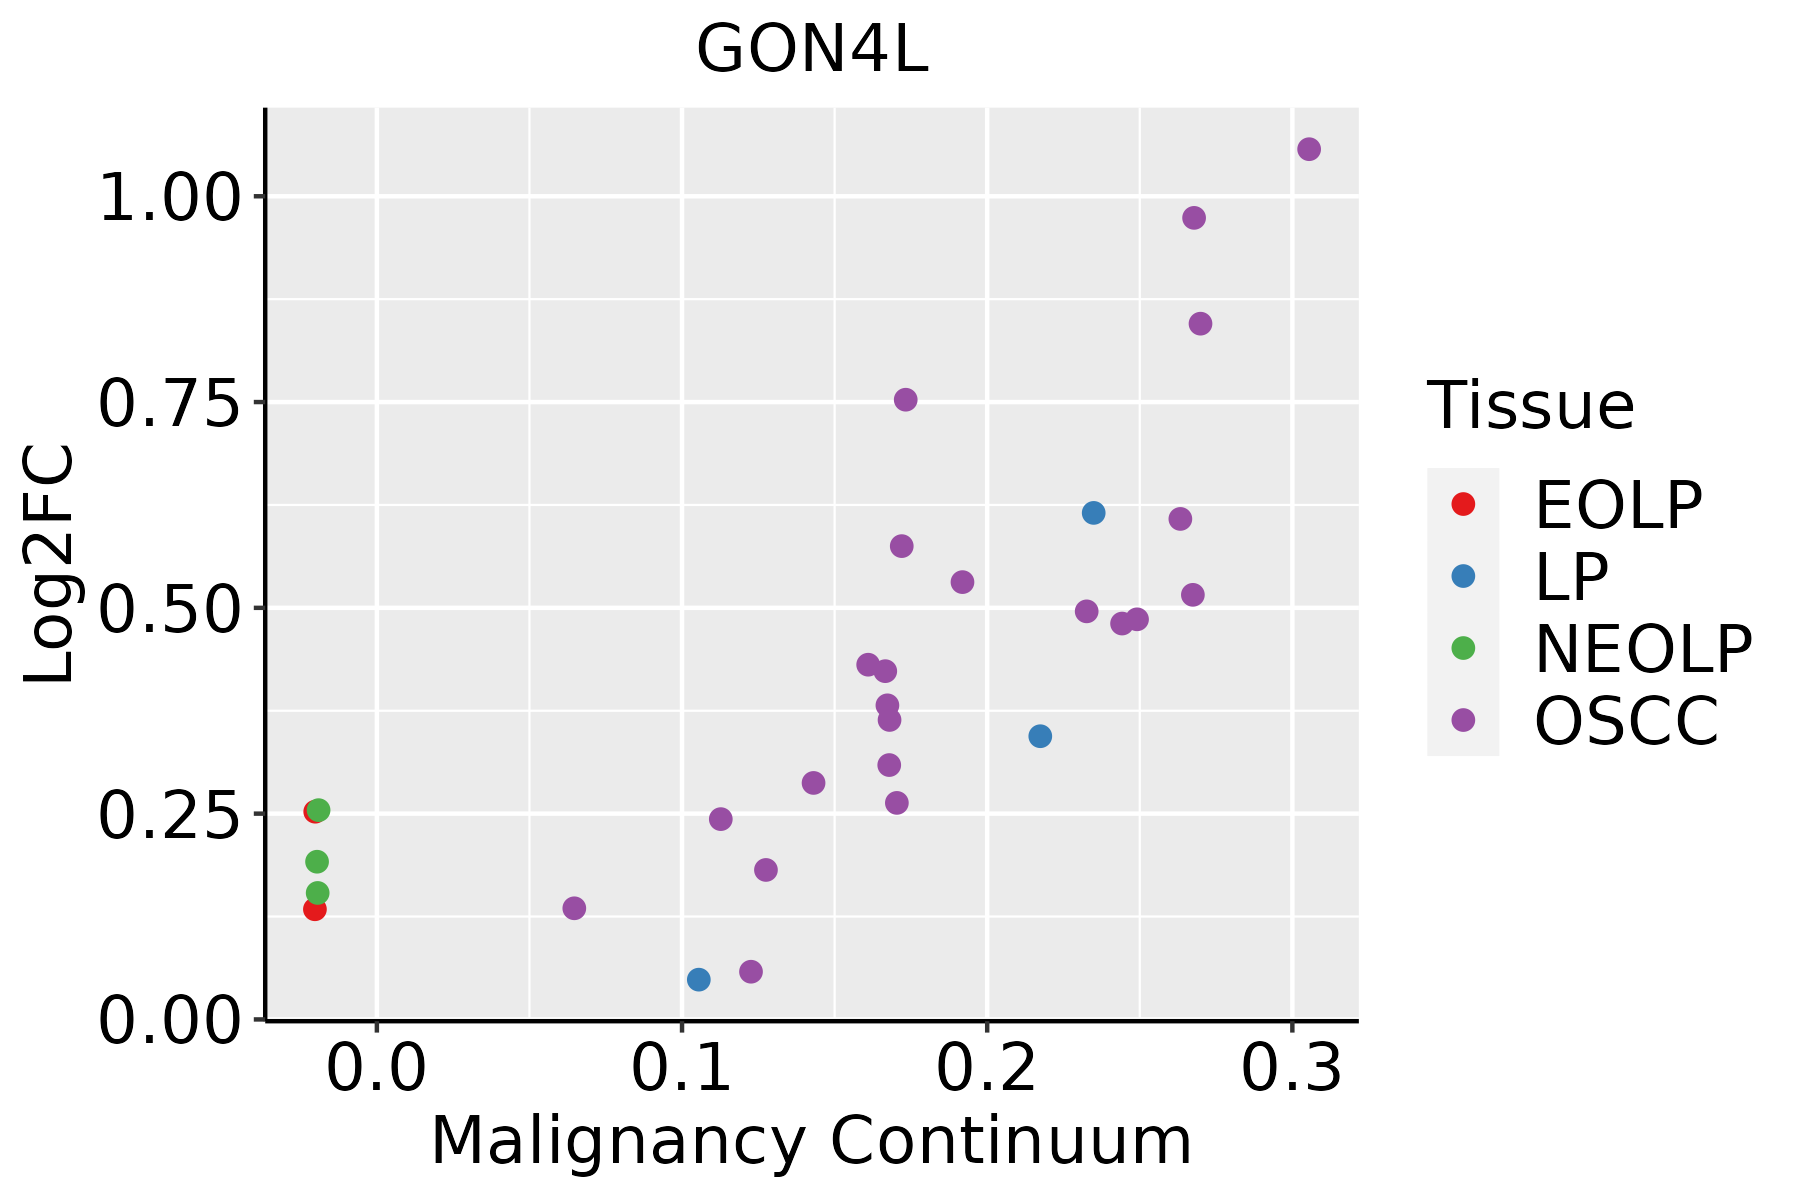 | EOLP: Erosive Oral lichen planus |
| LP: leukoplakia | ||
| NEOLP: Non-erosive oral lichen planus | ||
| OSCC: Oral squamous cell carcinoma | ||
| Thyroid |  | ATC: Anaplastic thyroid cancer |
| HT: Hashimoto's thyroiditis | ||
| PTC: Papillary thyroid cancer |
| ∗log2FC in expression of this searched gene in stem-like cells from each diseased tissue sample relative to stem-like cells in normal samples in each tissue plotted against the malignancy continuum. Samples are colored based on if they are from different disease stage. |
Top |
Malignant transformation related pathway analysis |
| Find out the enriched GO biological processes and KEGG pathways involved in transition from healthy to precancer to cancer |
| Tissue | Disease Stage | Enriched GO biological Processes |
| Colorectum | AD |  |
| Colorectum | SER |  |
| Colorectum | MSS |  |
| Colorectum | MSI-H |  |
| Colorectum | FAP |  |
| ∗Top 15 enriched GO BP terms are showed in the bar plot of each disease state in each tissue. Each row represents a significant GO biological process which is colored according to the -log10(p.adjust). |
| Page: 1 2 3 4 5 6 7 8 9 |
| GO ID | Tissue | Disease Stage | Description | Gene Ratio | Bg Ratio | pvalue | p.adjust | Count |
| GO:19031314 | Cervix | CC | mononuclear cell differentiation | 76/2311 | 426/18723 | 5.66e-04 | 5.42e-03 | 76 |
| GO:00300981 | Cervix | CC | lymphocyte differentiation | 63/2311 | 374/18723 | 6.21e-03 | 3.52e-02 | 63 |
| GO:19031317 | Esophagus | ESCC | mononuclear cell differentiation | 226/8552 | 426/18723 | 1.20e-03 | 5.88e-03 | 226 |
| GO:00300984 | Esophagus | ESCC | lymphocyte differentiation | 192/8552 | 374/18723 | 1.52e-02 | 4.93e-02 | 192 |
| GO:19031311 | Lung | IAC | mononuclear cell differentiation | 66/2061 | 426/18723 | 2.63e-03 | 2.44e-02 | 66 |
| GO:19031316 | Oral cavity | OSCC | mononuclear cell differentiation | 210/7305 | 426/18723 | 8.44e-06 | 9.02e-05 | 210 |
| GO:00300983 | Oral cavity | OSCC | lymphocyte differentiation | 179/7305 | 374/18723 | 2.74e-04 | 1.74e-03 | 179 |
| GO:190313114 | Oral cavity | EOLP | mononuclear cell differentiation | 88/2218 | 426/18723 | 1.07e-07 | 3.61e-06 | 88 |
| GO:003009812 | Oral cavity | EOLP | lymphocyte differentiation | 76/2218 | 374/18723 | 1.50e-06 | 3.55e-05 | 76 |
| GO:00421132 | Oral cavity | EOLP | B cell activation | 61/2218 | 334/18723 | 3.68e-04 | 3.35e-03 | 61 |
| GO:190313122 | Oral cavity | NEOLP | mononuclear cell differentiation | 77/2005 | 426/18723 | 2.80e-06 | 6.41e-05 | 77 |
| GO:003009821 | Oral cavity | NEOLP | lymphocyte differentiation | 66/2005 | 374/18723 | 3.08e-05 | 4.67e-04 | 66 |
| GO:0030183 | Oral cavity | NEOLP | B cell differentiation | 25/2005 | 141/18723 | 7.85e-03 | 3.90e-02 | 25 |
| Page: 1 |
| Pathway ID | Tissue | Disease Stage | Description | Gene Ratio | Bg Ratio | pvalue | p.adjust | qvalue | Count |
| Page: 1 |
Top |
Cell-cell communication analysis |
| Identification of potential cell-cell interactions between two cell types and their ligand-receptor pairs for different disease states |
| Ligand | Receptor | LRpair | Pathway | Tissue | Disease Stage |
| Page: 1 |
Top |
Single-cell gene regulatory network inference analysis |
| Find out the significant the regulons (TFs) and the target genes of each regulon across cell types for different disease states |
| TF | Cell Type | Tissue | Disease Stage | Target Gene | RSS | Regulon Activity |
| ∗The dot plots of a searched regulon are shown for all cell subpopulations in each disease state of each tissue based on the regulon specific score inferred using pySCENIC and by calculating the average expression. |
| Page: 1 |
Top |
Somatic mutation of malignant transformation related genes |
| Annotation of somatic variants for genes involved in malignant transformation |
| Hugo Symbol | Variant Class | Variant Classification | dbSNP RS | HGVSc | HGVSp | HGVSp Short | SWISSPROT | BIOTYPE | SIFT | PolyPhen | Tumor Sample Barcode | Tissue | Histology | Sex | Age | Stage | Therapy Types | Drugs | Outcome |
| GON4L | SNV | Missense_Mutation | novel | c.1753N>A | p.Glu585Lys | p.E585K | Q3T8J9 | protein_coding | deleterious(0) | possibly_damaging(0.844) | TCGA-3C-AALI-01 | Breast | breast invasive carcinoma | Female | <65 | I/II | Unspecific | Poly E | Complete Response |
| GON4L | SNV | Missense_Mutation | novel | c.1822N>C | p.Asp608His | p.D608H | Q3T8J9 | protein_coding | deleterious(0) | probably_damaging(0.991) | TCGA-5L-AAT1-01 | Breast | breast invasive carcinoma | Female | <65 | III/IV | Hormone Therapy | letrozol | SD |
| GON4L | SNV | Missense_Mutation | c.4558N>C | p.Glu1520Gln | p.E1520Q | Q3T8J9 | protein_coding | deleterious(0) | probably_damaging(0.995) | TCGA-A7-A26H-01 | Breast | breast invasive carcinoma | Female | >=65 | I/II | Hormone Therapy | anastrozole | PD | |
| GON4L | SNV | Missense_Mutation | novel | c.1093G>C | p.Glu365Gln | p.E365Q | Q3T8J9 | protein_coding | tolerated(0.09) | probably_damaging(0.994) | TCGA-A8-A09G-01 | Breast | breast invasive carcinoma | Female | >=65 | III/IV | Unknown | Unknown | SD |
| GON4L | SNV | Missense_Mutation | c.1694N>C | p.Leu565Pro | p.L565P | Q3T8J9 | protein_coding | deleterious(0.03) | possibly_damaging(0.873) | TCGA-A8-A09Z-01 | Breast | breast invasive carcinoma | Female | >=65 | I/II | Unknown | Unknown | SD | |
| GON4L | SNV | Missense_Mutation | c.1897G>C | p.Glu633Gln | p.E633Q | Q3T8J9 | protein_coding | deleterious(0.04) | probably_damaging(0.972) | TCGA-AC-A23H-01 | Breast | breast invasive carcinoma | Female | >=65 | I/II | Unknown | Unknown | PD | |
| GON4L | SNV | Missense_Mutation | novel | c.1630N>A | p.Asp544Asn | p.D544N | Q3T8J9 | protein_coding | deleterious(0.04) | probably_damaging(0.936) | TCGA-AC-A5XS-01 | Breast | breast invasive carcinoma | Female | >=65 | I/II | Hormone Therapy | femara | SD |
| GON4L | SNV | Missense_Mutation | novel | c.4106G>A | p.Gly1369Glu | p.G1369E | Q3T8J9 | protein_coding | tolerated_low_confidence(0.23) | benign(0.007) | TCGA-AN-A046-01 | Breast | breast invasive carcinoma | Female | >=65 | I/II | Unknown | Unknown | SD |
| GON4L | SNV | Missense_Mutation | c.2348C>G | p.Thr783Ser | p.T783S | Q3T8J9 | protein_coding | tolerated(0.56) | benign(0.012) | TCGA-AN-A04D-01 | Breast | breast invasive carcinoma | Female | <65 | I/II | Unknown | Unknown | SD | |
| GON4L | SNV | Missense_Mutation | c.2877N>G | p.Asp959Glu | p.D959E | Q3T8J9 | protein_coding | tolerated(0.5) | benign(0) | TCGA-AN-A0XO-01 | Breast | breast invasive carcinoma | Female | <65 | III/IV | Unknown | Unknown | SD |
| Page: 1 2 3 4 5 6 7 8 9 10 11 12 13 14 15 16 17 18 19 20 |
Top |
Related drugs of malignant transformation related genes |
| Identification of chemicals and drugs interact with genes involved in malignant transfromation |
| (DGIdb 4.0) |
| Entrez ID | Symbol | Category | Interaction Types | Drug Claim Name | Drug Name | PMIDs |
| Page: 1 |

Copyright 2023-Present -The University of Texas Health Science Center at Houston |