| Tissue | Expression Dynamics | Abbreviation |
| Cervix | 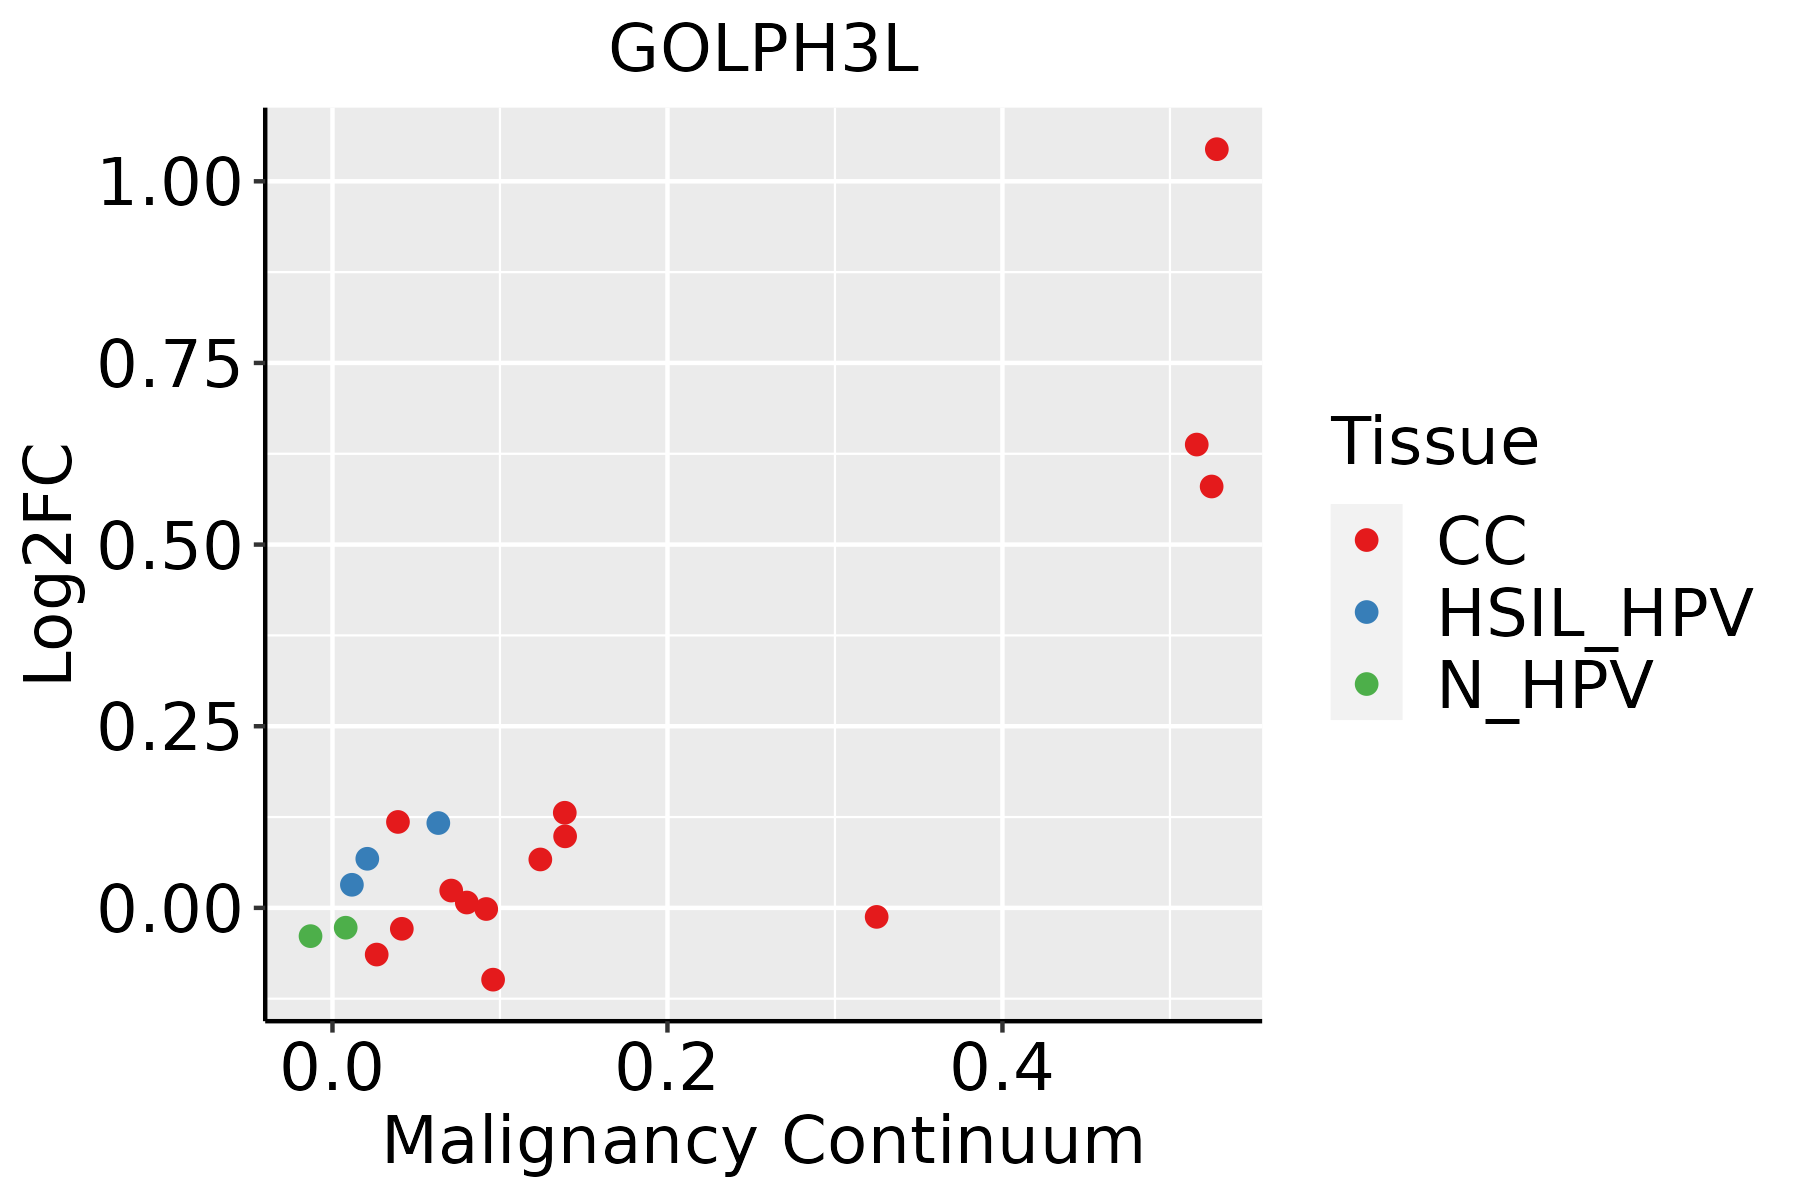 | CC: Cervix cancer |
| HSIL_HPV: HPV-infected high-grade squamous intraepithelial lesions |
| N_HPV: HPV-infected normal cervix |
| Colorectum (GSE201348) |  | FAP: Familial adenomatous polyposis |
| CRC: Colorectal cancer |
| Colorectum (HTA11) |  | AD: Adenomas |
| SER: Sessile serrated lesions |
| MSI-H: Microsatellite-high colorectal cancer |
| MSS: Microsatellite stable colorectal cancer |
| Esophagus |  | ESCC: Esophageal squamous cell carcinoma |
| HGIN: High-grade intraepithelial neoplasias |
| LGIN: Low-grade intraepithelial neoplasias |
| Oral Cavity | 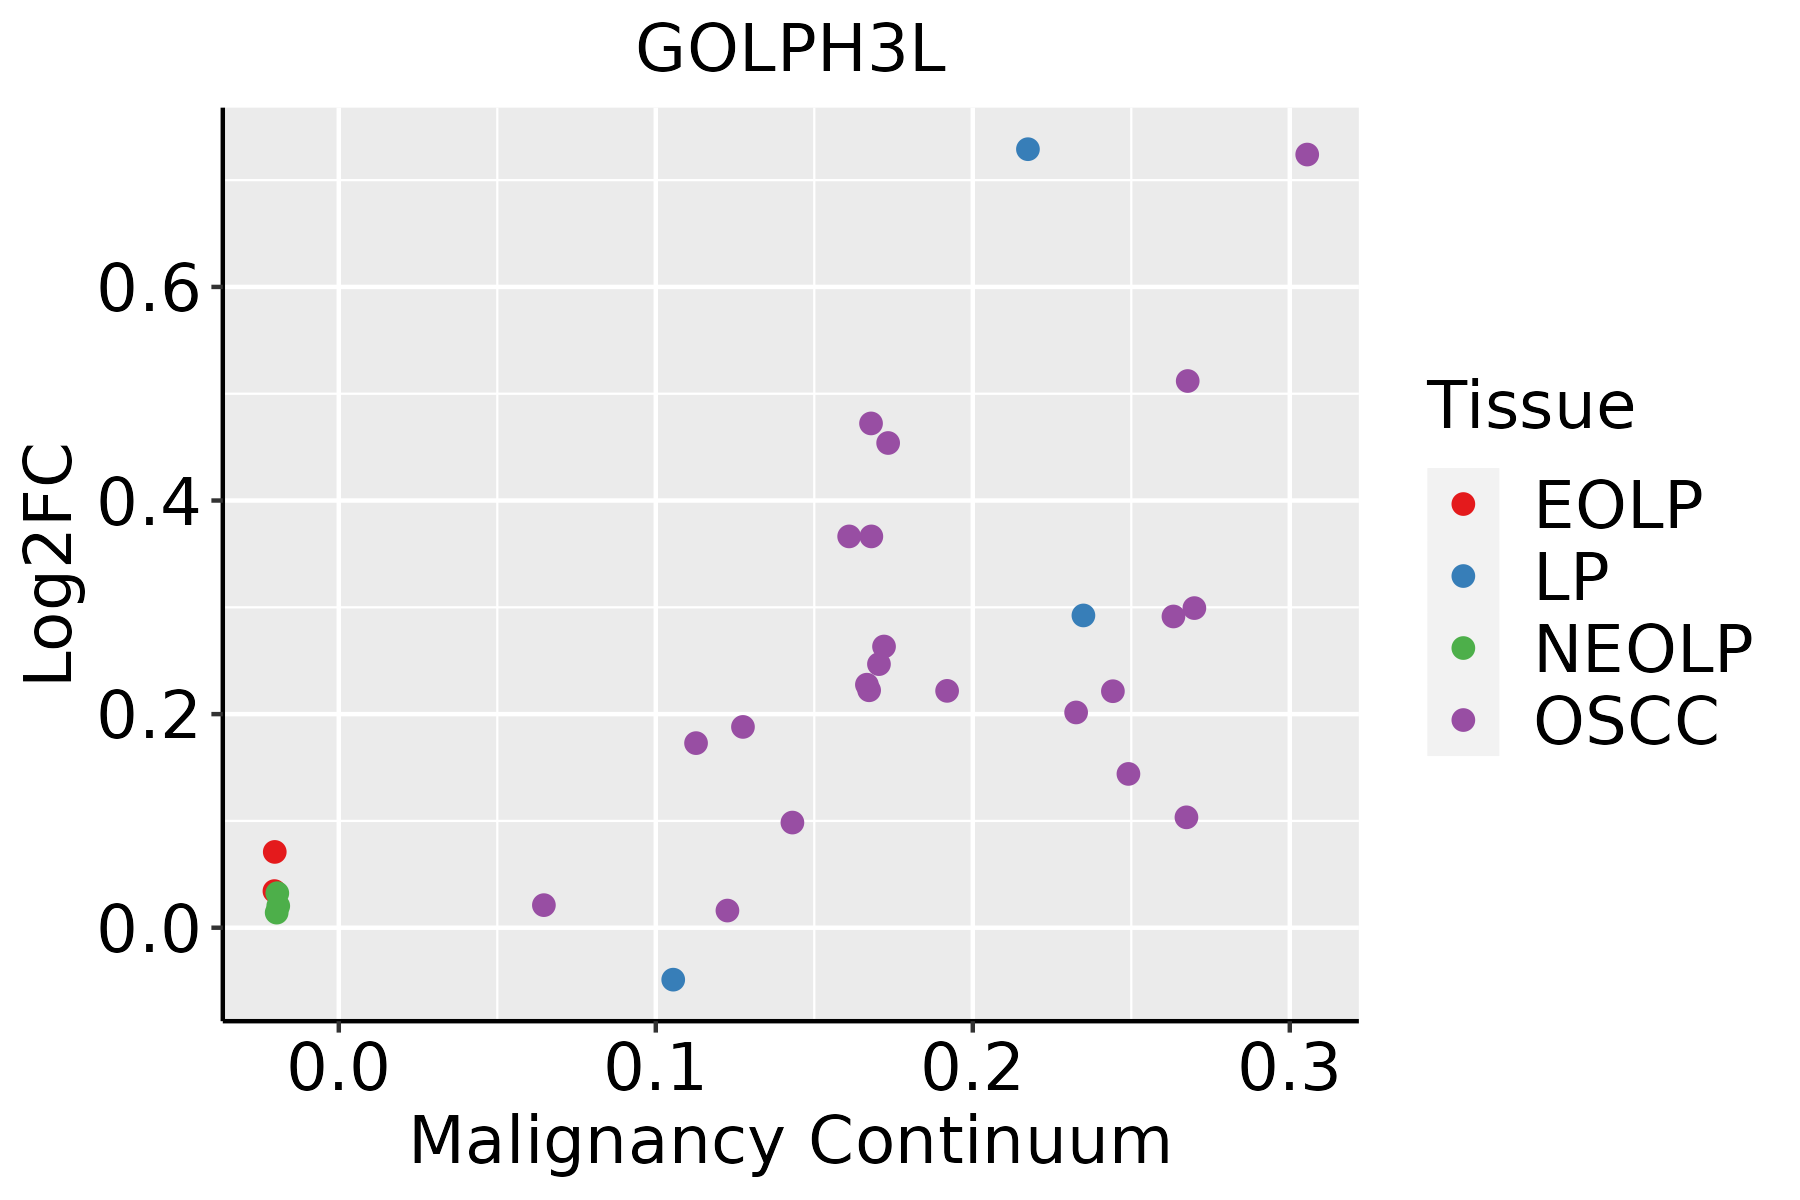 | EOLP: Erosive Oral lichen planus |
| LP: leukoplakia |
| NEOLP: Non-erosive oral lichen planus |
| OSCC: Oral squamous cell carcinoma |
| GO ID | Tissue | Disease Stage | Description | Gene Ratio | Bg Ratio | pvalue | p.adjust | Count |
| GO:007265910 | Cervix | CC | protein localization to plasma membrane | 73/2311 | 284/18723 | 4.95e-10 | 6.73e-08 | 73 |
| GO:19907788 | Cervix | CC | protein localization to cell periphery | 78/2311 | 333/18723 | 1.22e-08 | 9.73e-07 | 78 |
| GO:005122210 | Cervix | CC | positive regulation of protein transport | 72/2311 | 303/18723 | 2.36e-08 | 1.70e-06 | 72 |
| GO:190495110 | Cervix | CC | positive regulation of establishment of protein localization | 73/2311 | 319/18723 | 9.69e-08 | 5.25e-06 | 73 |
| GO:000690010 | Cervix | CC | vesicle budding from membrane | 20/2311 | 61/18723 | 2.50e-05 | 4.28e-04 | 20 |
| GO:00988767 | Cervix | CC | vesicle-mediated transport to the plasma membrane | 34/2311 | 136/18723 | 3.75e-05 | 5.91e-04 | 34 |
| GO:00068927 | Cervix | CC | post-Golgi vesicle-mediated transport | 28/2311 | 104/18723 | 4.31e-05 | 6.61e-04 | 28 |
| GO:00901509 | Cervix | CC | establishment of protein localization to membrane | 54/2311 | 260/18723 | 7.67e-05 | 1.05e-03 | 54 |
| GO:00481938 | Cervix | CC | Golgi vesicle transport | 58/2311 | 296/18723 | 2.24e-04 | 2.54e-03 | 58 |
| GO:00068907 | Cervix | CC | retrograde vesicle-mediated transport, Golgi to endoplasmic reticulum | 15/2311 | 52/18723 | 1.15e-03 | 9.39e-03 | 15 |
| GO:00068936 | Cervix | CC | Golgi to plasma membrane transport | 16/2311 | 60/18723 | 2.00e-03 | 1.46e-02 | 16 |
| GO:00619516 | Cervix | CC | establishment of protein localization to plasma membrane | 16/2311 | 60/18723 | 2.00e-03 | 1.46e-02 | 16 |
| GO:00507148 | Cervix | CC | positive regulation of protein secretion | 29/2311 | 137/18723 | 2.40e-03 | 1.70e-02 | 29 |
| GO:00430016 | Cervix | CC | Golgi to plasma membrane protein transport | 12/2311 | 40/18723 | 2.44e-03 | 1.71e-02 | 12 |
| GO:00160506 | Cervix | CC | vesicle organization | 54/2311 | 300/18723 | 2.71e-03 | 1.85e-02 | 54 |
| GO:00070304 | Cervix | CC | Golgi organization | 32/2311 | 157/18723 | 2.78e-03 | 1.87e-02 | 32 |
| GO:00481944 | Cervix | CC | Golgi vesicle budding | 5/2311 | 10/18723 | 4.20e-03 | 2.58e-02 | 5 |
| GO:0072659 | Colorectum | AD | protein localization to plasma membrane | 122/3918 | 284/18723 | 2.86e-17 | 1.49e-14 | 122 |
| GO:1990778 | Colorectum | AD | protein localization to cell periphery | 129/3918 | 333/18723 | 5.51e-14 | 1.15e-11 | 129 |
| GO:0090150 | Colorectum | AD | establishment of protein localization to membrane | 100/3918 | 260/18723 | 6.01e-11 | 6.33e-09 | 100 |
| Hugo Symbol | Variant Class | Variant Classification | dbSNP RS | HGVSc | HGVSp | HGVSp Short | SWISSPROT | BIOTYPE | SIFT | PolyPhen | Tumor Sample Barcode | Tissue | Histology | Sex | Age | Stage | Therapy Types | Drugs | Outcome |
| GOLPH3L | SNV | Missense_Mutation | rs150623963 | c.263G>A | p.Arg88Gln | p.R88Q | Q9H4A5 | protein_coding | deleterious(0) | probably_damaging(0.987) | TCGA-AN-A046-01 | Breast | breast invasive carcinoma | Female | >=65 | I/II | Unknown | Unknown | SD |
| GOLPH3L | insertion | In_Frame_Ins | novel | c.643_644insACAAAA | p.Pro215delinsHisLysThr | p.P215delinsHKT | Q9H4A5 | protein_coding | | | TCGA-AR-A0U0-01 | Breast | breast invasive carcinoma | Female | >=65 | I/II | Unknown | Unknown | SD |
| GOLPH3L | insertion | In_Frame_Ins | novel | c.368_369insATTCACAATACCCAAAATGTG | p.Leu123_Lys124insPheThrIleProLysMetTrp | p.L123_K124insFTIPKMW | Q9H4A5 | protein_coding | | | TCGA-AR-A0U0-01 | Breast | breast invasive carcinoma | Female | >=65 | I/II | Unknown | Unknown | SD |
| GOLPH3L | SNV | Missense_Mutation | | c.122N>G | p.Ser41Cys | p.S41C | Q9H4A5 | protein_coding | deleterious(0.03) | benign(0.003) | TCGA-EK-A2RJ-01 | Cervix | cervical & endocervical cancer | Female | <65 | I/II | Unknown | Unknown | SD |
| GOLPH3L | SNV | Missense_Mutation | novel | c.175G>T | p.Asp59Tyr | p.D59Y | Q9H4A5 | protein_coding | deleterious(0) | probably_damaging(0.998) | TCGA-AZ-4315-01 | Colorectum | colon adenocarcinoma | Male | <65 | I/II | Unknown | Unknown | SD |
| GOLPH3L | SNV | Missense_Mutation | novel | c.602A>C | p.Lys201Thr | p.K201T | Q9H4A5 | protein_coding | tolerated(0.06) | benign(0.301) | TCGA-AG-A002-01 | Colorectum | rectum adenocarcinoma | Male | <65 | I/II | Unknown | Unknown | SD |
| GOLPH3L | SNV | Missense_Mutation | novel | c.760N>A | p.Ala254Thr | p.A254T | Q9H4A5 | protein_coding | tolerated(0.23) | benign(0.114) | TCGA-A5-A0G1-01 | Endometrium | uterine corpus endometrioid carcinoma | Female | >=65 | I/II | Unknown | Unknown | SD |
| GOLPH3L | SNV | Missense_Mutation | novel | c.335N>A | p.Ser112Asn | p.S112N | Q9H4A5 | protein_coding | tolerated(0.13) | benign(0.021) | TCGA-A5-A0G2-01 | Endometrium | uterine corpus endometrioid carcinoma | Female | <65 | III/IV | Unknown | Unknown | SD |
| GOLPH3L | SNV | Missense_Mutation | novel | c.812N>G | p.Ala271Gly | p.A271G | Q9H4A5 | protein_coding | tolerated(0.57) | benign(0.005) | TCGA-A5-A7WJ-01 | Endometrium | uterine corpus endometrioid carcinoma | Female | <65 | I/II | Unknown | Unknown | SD |
| GOLPH3L | SNV | Missense_Mutation | rs781403485 | c.485N>A | p.Arg162His | p.R162H | Q9H4A5 | protein_coding | deleterious(0.04) | possibly_damaging(0.802) | TCGA-AJ-A3EL-01 | Endometrium | uterine corpus endometrioid carcinoma | Female | <65 | I/II | Unknown | Unknown | SD |


