
|
|||||
|
 | |
| |
| |
| |
| |
| |
|
Gene: GOLPH3 |
Gene summary for GOLPH3 |
| Gene information | Species | Human | Gene symbol | GOLPH3 | Gene ID | 64083 |
| Gene name | golgi phosphoprotein 3 | |
| Gene Alias | GOPP1 | |
| Cytomap | 5p13.3 | |
| Gene Type | protein-coding | GO ID | GO:0002376 | UniProtAcc | Q9H4A6 |
Top |
Malignant transformation analysis |
| Identification of the aberrant gene expression in precancerous and cancerous lesions by comparing the gene expression of stem-like cells in diseased tissues with normal stem cells |
| Entrez ID | Symbol | Replicates | Species | Organ | Tissue | Adj P-value | Log2FC | Malignancy |
| 64083 | GOLPH3 | CCI_1 | Human | Cervix | CC | 4.95e-04 | 6.57e-01 | 0.528 |
| 64083 | GOLPH3 | CCI_3 | Human | Cervix | CC | 1.07e-06 | 6.50e-01 | 0.516 |
| 64083 | GOLPH3 | sample3 | Human | Cervix | CC | 1.15e-07 | 2.51e-01 | 0.1387 |
| 64083 | GOLPH3 | HTA11_3410_2000001011 | Human | Colorectum | AD | 2.71e-14 | -5.18e-01 | 0.0155 |
| 64083 | GOLPH3 | HTA11_696_2000001011 | Human | Colorectum | AD | 2.81e-03 | -2.31e-01 | -0.1464 |
| 64083 | GOLPH3 | HTA11_7696_3000711011 | Human | Colorectum | AD | 1.72e-07 | -3.28e-01 | 0.0674 |
| 64083 | GOLPH3 | HTA11_99999974143_84620 | Human | Colorectum | MSS | 5.28e-13 | -4.22e-01 | 0.3005 |
| 64083 | GOLPH3 | F007 | Human | Colorectum | FAP | 4.72e-03 | -3.21e-01 | 0.1176 |
| 64083 | GOLPH3 | A002-C-010 | Human | Colorectum | FAP | 1.15e-03 | -1.55e-01 | 0.242 |
| 64083 | GOLPH3 | A015-C-203 | Human | Colorectum | FAP | 9.00e-29 | -3.47e-01 | -0.1294 |
| 64083 | GOLPH3 | A015-C-204 | Human | Colorectum | FAP | 3.74e-05 | -2.24e-01 | -0.0228 |
| 64083 | GOLPH3 | A014-C-040 | Human | Colorectum | FAP | 1.10e-05 | -4.38e-01 | -0.1184 |
| 64083 | GOLPH3 | A002-C-201 | Human | Colorectum | FAP | 1.52e-13 | -2.97e-01 | 0.0324 |
| 64083 | GOLPH3 | A002-C-203 | Human | Colorectum | FAP | 1.93e-07 | -1.98e-01 | 0.2786 |
| 64083 | GOLPH3 | A001-C-119 | Human | Colorectum | FAP | 3.06e-08 | -2.82e-01 | -0.1557 |
| 64083 | GOLPH3 | A001-C-108 | Human | Colorectum | FAP | 7.58e-18 | -3.17e-01 | -0.0272 |
| 64083 | GOLPH3 | A002-C-205 | Human | Colorectum | FAP | 1.25e-19 | -2.78e-01 | -0.1236 |
| 64083 | GOLPH3 | A014-C-108 | Human | Colorectum | FAP | 1.38e-02 | -3.39e-01 | -0.124 |
| 64083 | GOLPH3 | A001-C-104 | Human | Colorectum | FAP | 1.06e-08 | -2.88e-01 | 0.0184 |
| 64083 | GOLPH3 | A015-C-006 | Human | Colorectum | FAP | 1.90e-14 | -4.55e-01 | -0.0994 |
| Page: 1 2 3 4 5 6 7 8 |
| Tissue | Expression Dynamics | Abbreviation |
| Cervix | 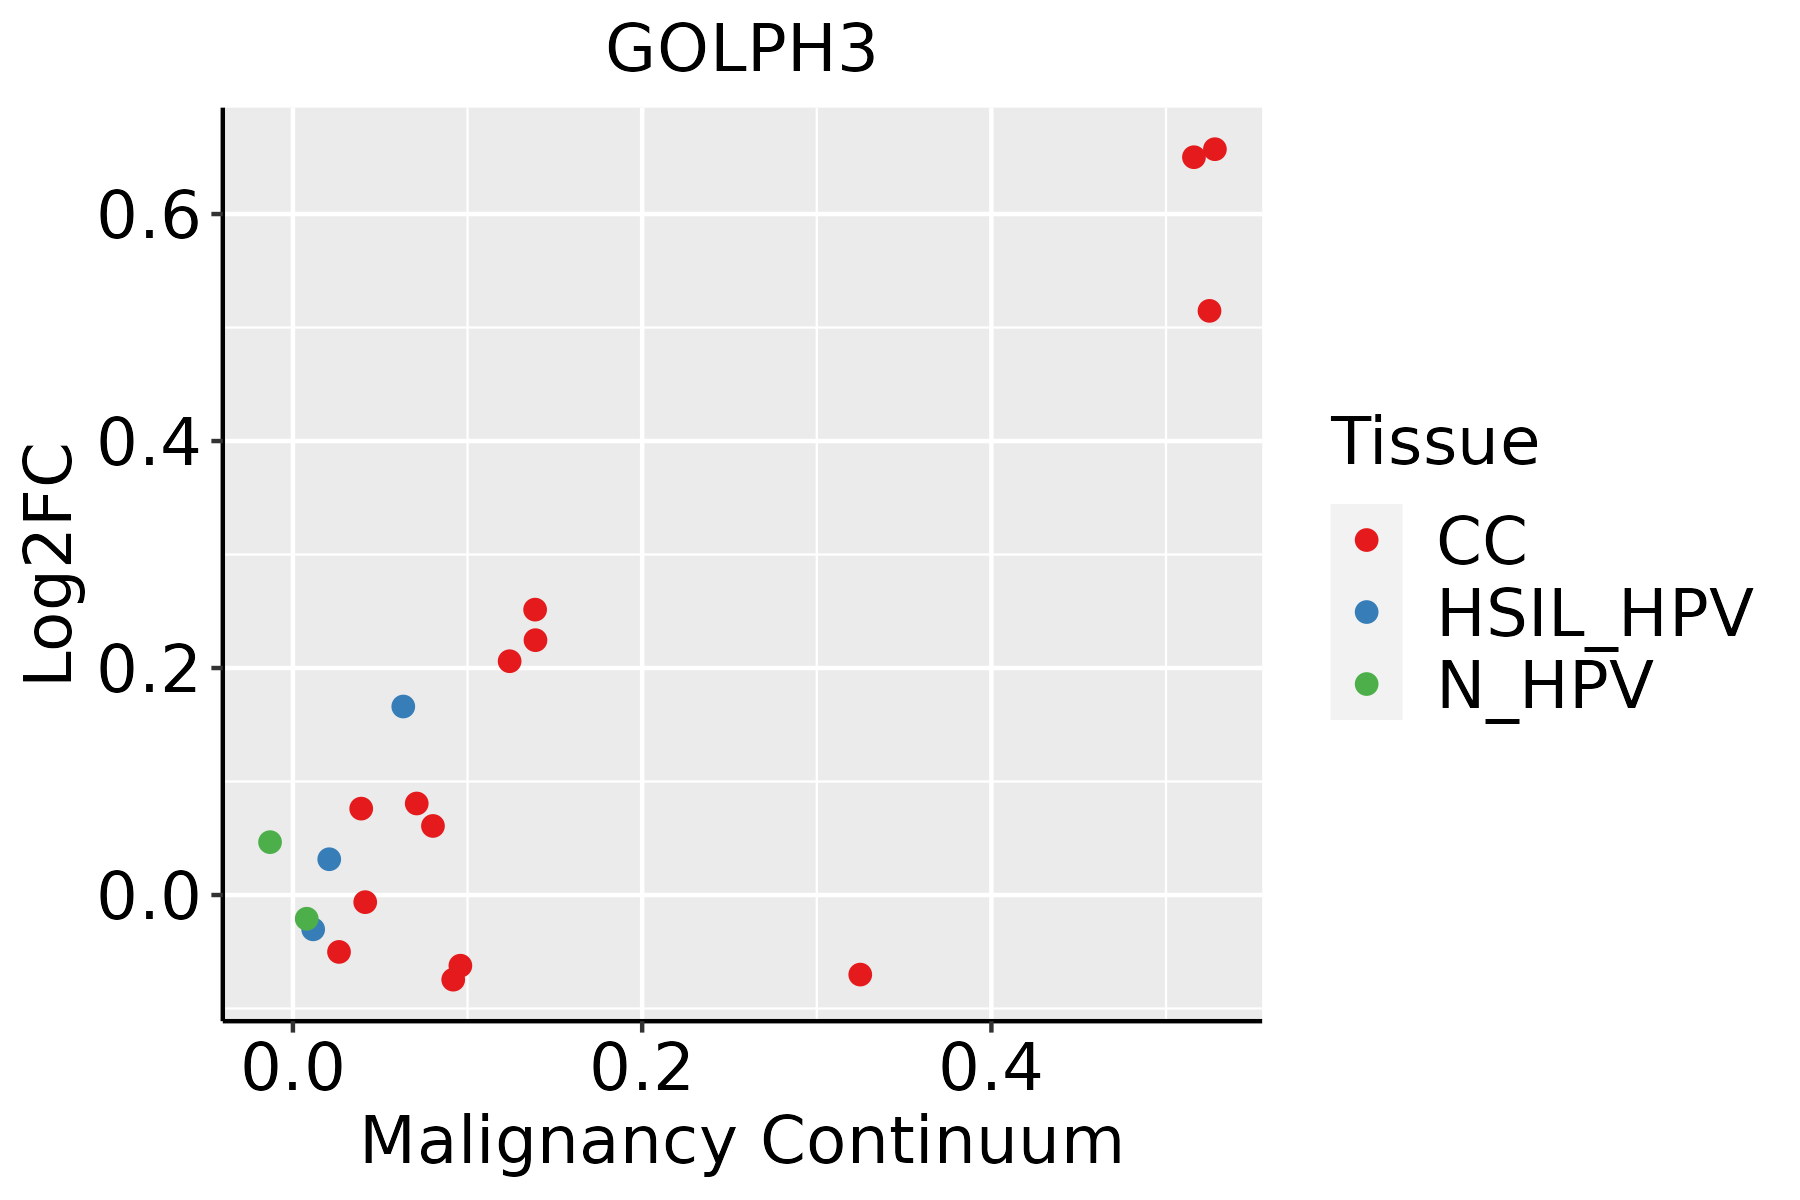 | CC: Cervix cancer |
| HSIL_HPV: HPV-infected high-grade squamous intraepithelial lesions | ||
| N_HPV: HPV-infected normal cervix | ||
| Colorectum (GSE201348) |  | FAP: Familial adenomatous polyposis |
| CRC: Colorectal cancer | ||
| Colorectum (HTA11) |  | AD: Adenomas |
| SER: Sessile serrated lesions | ||
| MSI-H: Microsatellite-high colorectal cancer | ||
| MSS: Microsatellite stable colorectal cancer | ||
| Esophagus |  | ESCC: Esophageal squamous cell carcinoma |
| HGIN: High-grade intraepithelial neoplasias | ||
| LGIN: Low-grade intraepithelial neoplasias | ||
| Liver |  | HCC: Hepatocellular carcinoma |
| NAFLD: Non-alcoholic fatty liver disease | ||
| Oral Cavity | 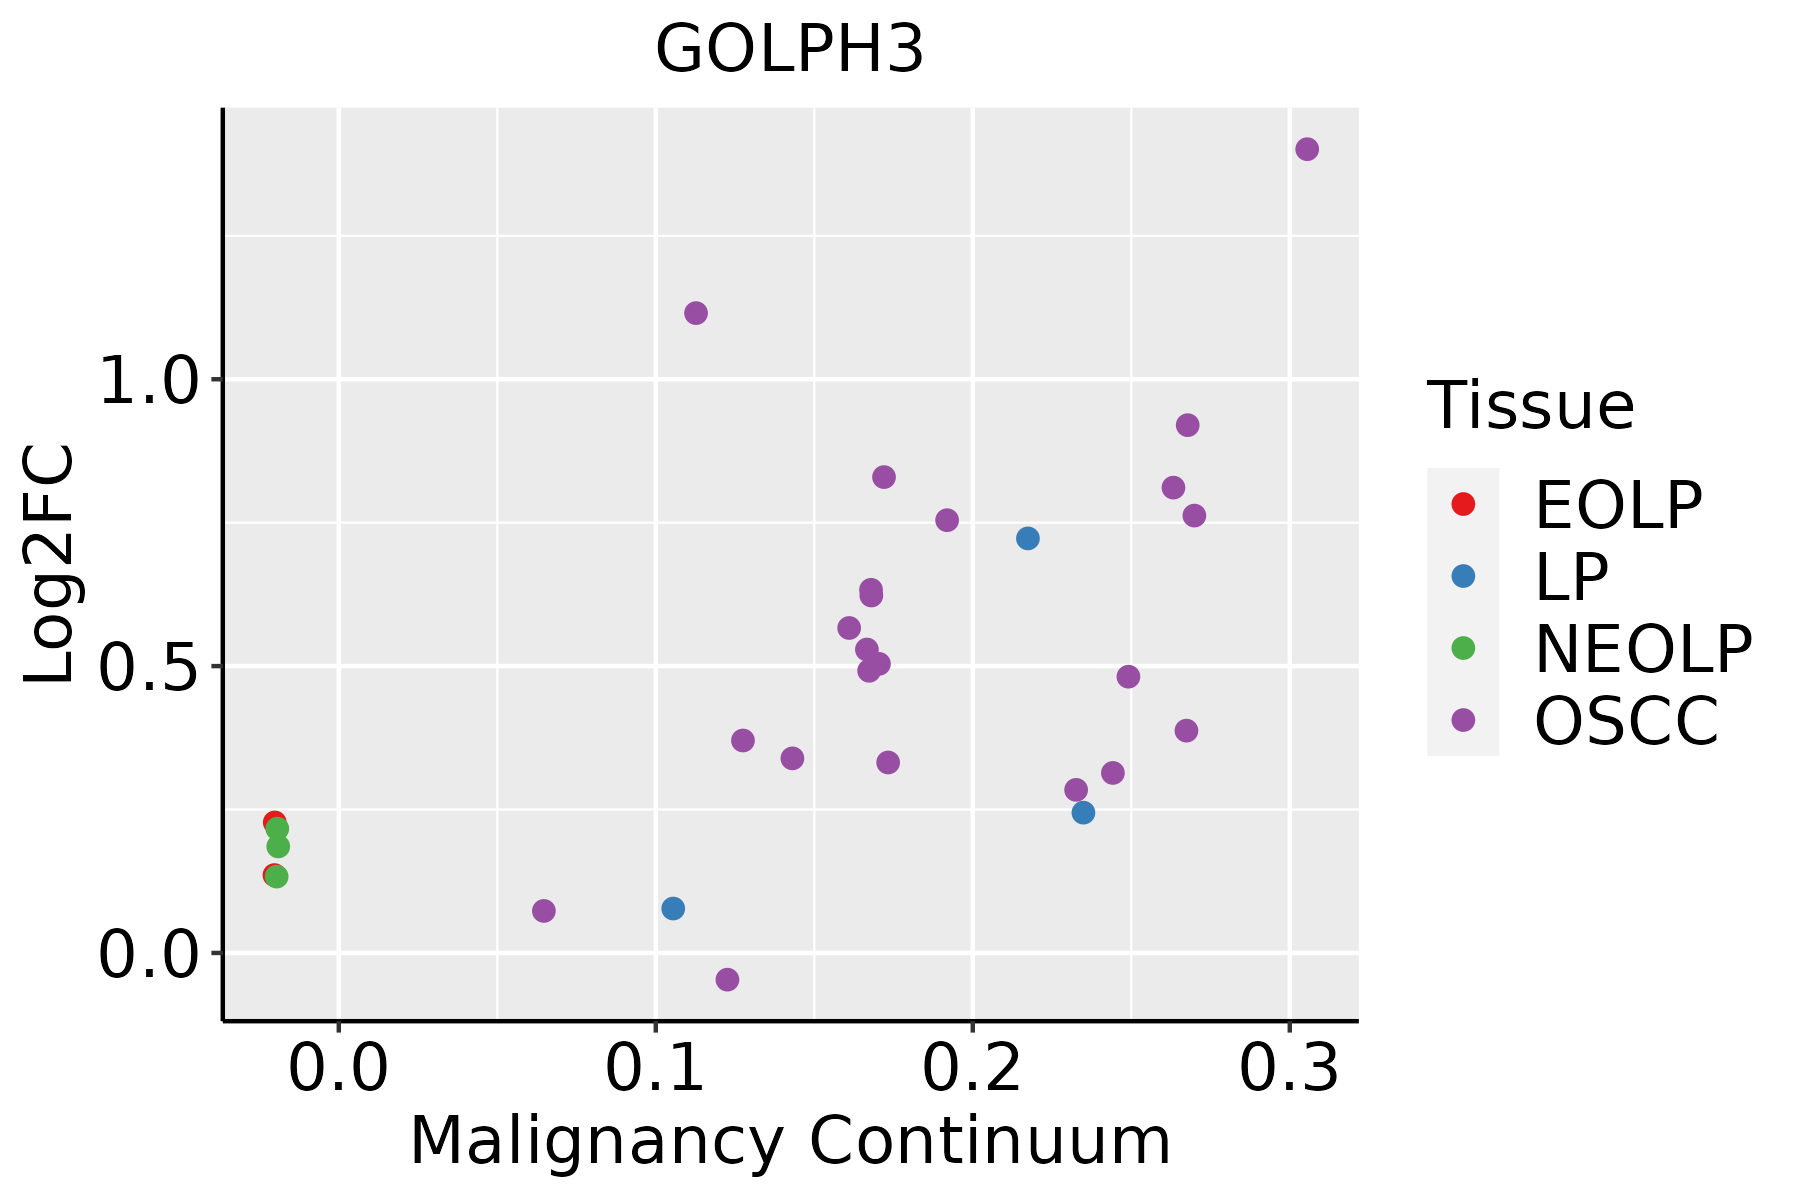 | EOLP: Erosive Oral lichen planus |
| LP: leukoplakia | ||
| NEOLP: Non-erosive oral lichen planus | ||
| OSCC: Oral squamous cell carcinoma | ||
| Prostate |  | BPH: Benign Prostatic Hyperplasia |
| Skin |  | AK: Actinic keratosis |
| cSCC: Cutaneous squamous cell carcinoma | ||
| SCCIS:squamous cell carcinoma in situ | ||
| Thyroid |  | ATC: Anaplastic thyroid cancer |
| HT: Hashimoto's thyroiditis | ||
| PTC: Papillary thyroid cancer |
| ∗log2FC in expression of this searched gene in stem-like cells from each diseased tissue sample relative to stem-like cells in normal samples in each tissue plotted against the malignancy continuum. Samples are colored based on if they are from different disease stage. |
Top |
Malignant transformation related pathway analysis |
| Find out the enriched GO biological processes and KEGG pathways involved in transition from healthy to precancer to cancer |
| Tissue | Disease Stage | Enriched GO biological Processes |
| Colorectum | AD |  |
| Colorectum | SER |  |
| Colorectum | MSS |  |
| Colorectum | MSI-H |  |
| Colorectum | FAP |  |
| ∗Top 15 enriched GO BP terms are showed in the bar plot of each disease state in each tissue. Each row represents a significant GO biological process which is colored according to the -log10(p.adjust). |
| Page: 1 2 3 4 5 6 7 8 9 |
| GO ID | Tissue | Disease Stage | Description | Gene Ratio | Bg Ratio | pvalue | p.adjust | Count |
| GO:00071639 | Cervix | CC | establishment or maintenance of cell polarity | 63/2311 | 218/18723 | 4.25e-11 | 8.76e-09 | 63 |
| GO:007265910 | Cervix | CC | protein localization to plasma membrane | 73/2311 | 284/18723 | 4.95e-10 | 6.73e-08 | 73 |
| GO:00512359 | Cervix | CC | maintenance of location | 78/2311 | 327/18723 | 5.18e-09 | 4.92e-07 | 78 |
| GO:00071598 | Cervix | CC | leukocyte cell-cell adhesion | 85/2311 | 371/18723 | 8.27e-09 | 7.07e-07 | 85 |
| GO:19907788 | Cervix | CC | protein localization to cell periphery | 78/2311 | 333/18723 | 1.22e-08 | 9.73e-07 | 78 |
| GO:005122210 | Cervix | CC | positive regulation of protein transport | 72/2311 | 303/18723 | 2.36e-08 | 1.70e-06 | 72 |
| GO:00300108 | Cervix | CC | establishment of cell polarity | 42/2311 | 143/18723 | 4.30e-08 | 2.62e-06 | 42 |
| GO:00975817 | Cervix | CC | lamellipodium organization | 31/2311 | 90/18723 | 4.57e-08 | 2.76e-06 | 31 |
| GO:005165110 | Cervix | CC | maintenance of location in cell | 55/2311 | 214/18723 | 6.63e-08 | 3.85e-06 | 55 |
| GO:190495110 | Cervix | CC | positive regulation of establishment of protein localization | 73/2311 | 319/18723 | 9.69e-08 | 5.25e-06 | 73 |
| GO:00300325 | Cervix | CC | lamellipodium assembly | 26/2311 | 72/18723 | 1.87e-07 | 8.48e-06 | 26 |
| GO:00509007 | Cervix | CC | leukocyte migration | 78/2311 | 369/18723 | 1.09e-06 | 3.80e-05 | 78 |
| GO:190165410 | Cervix | CC | response to ketone | 45/2311 | 194/18723 | 1.83e-05 | 3.44e-04 | 45 |
| GO:00325077 | Cervix | CC | maintenance of protein location in cell | 21/2311 | 65/18723 | 2.03e-05 | 3.71e-04 | 21 |
| GO:000690010 | Cervix | CC | vesicle budding from membrane | 20/2311 | 61/18723 | 2.50e-05 | 4.28e-04 | 20 |
| GO:00988767 | Cervix | CC | vesicle-mediated transport to the plasma membrane | 34/2311 | 136/18723 | 3.75e-05 | 5.91e-04 | 34 |
| GO:00068927 | Cervix | CC | post-Golgi vesicle-mediated transport | 28/2311 | 104/18723 | 4.31e-05 | 6.61e-04 | 28 |
| GO:004518510 | Cervix | CC | maintenance of protein location | 26/2311 | 94/18723 | 4.85e-05 | 7.34e-04 | 26 |
| GO:00901509 | Cervix | CC | establishment of protein localization to membrane | 54/2311 | 260/18723 | 7.67e-05 | 1.05e-03 | 54 |
| GO:00108218 | Cervix | CC | regulation of mitochondrion organization | 34/2311 | 144/18723 | 1.27e-04 | 1.58e-03 | 34 |
| Page: 1 2 3 4 5 6 7 8 9 10 11 12 13 14 15 16 17 18 19 20 21 22 23 24 25 26 27 28 29 30 31 32 33 |
| Pathway ID | Tissue | Disease Stage | Description | Gene Ratio | Bg Ratio | pvalue | p.adjust | qvalue | Count |
| Page: 1 |
Top |
Cell-cell communication analysis |
| Identification of potential cell-cell interactions between two cell types and their ligand-receptor pairs for different disease states |
| Ligand | Receptor | LRpair | Pathway | Tissue | Disease Stage |
| Page: 1 |
Top |
Single-cell gene regulatory network inference analysis |
| Find out the significant the regulons (TFs) and the target genes of each regulon across cell types for different disease states |
| TF | Cell Type | Tissue | Disease Stage | Target Gene | RSS | Regulon Activity |
| ∗The dot plots of a searched regulon are shown for all cell subpopulations in each disease state of each tissue based on the regulon specific score inferred using pySCENIC and by calculating the average expression. |
| Page: 1 |
Top |
Somatic mutation of malignant transformation related genes |
| Annotation of somatic variants for genes involved in malignant transformation |
| Hugo Symbol | Variant Class | Variant Classification | dbSNP RS | HGVSc | HGVSp | HGVSp Short | SWISSPROT | BIOTYPE | SIFT | PolyPhen | Tumor Sample Barcode | Tissue | Histology | Sex | Age | Stage | Therapy Types | Drugs | Outcome |
| GOLPH3 | SNV | Missense_Mutation | c.255N>G | p.Ile85Met | p.I85M | Q9H4A6 | protein_coding | deleterious(0) | probably_damaging(0.989) | TCGA-AR-A1AS-01 | Breast | breast invasive carcinoma | Female | <65 | I/II | Chemotherapy | doxorubicin | SD | |
| GOLPH3 | SNV | Missense_Mutation | c.769N>G | p.Leu257Val | p.L257V | Q9H4A6 | protein_coding | tolerated(0.29) | benign(0.033) | TCGA-BH-A0W7-01 | Breast | breast invasive carcinoma | Female | <65 | I/II | Chemotherapy | taxotere | CR | |
| GOLPH3 | insertion | Frame_Shift_Ins | novel | c.562_563insAACCAGAAGT | p.Thr188LysfsTer14 | p.T188Kfs*14 | Q9H4A6 | protein_coding | TCGA-BH-A0H0-01 | Breast | breast invasive carcinoma | Female | >=65 | I/II | Hormone Therapy | arimidex | SD | ||
| GOLPH3 | insertion | Frame_Shift_Ins | novel | c.573_574insTTCTC | p.Gln192PhefsTer10 | p.Q192Ffs*10 | Q9H4A6 | protein_coding | TCGA-DS-A1OD-01 | Cervix | cervical & endocervical cancer | Female | <65 | I/II | Chemotherapy | cisplatin | SD | ||
| GOLPH3 | SNV | Missense_Mutation | rs192633198 | c.704G>A | p.Arg235His | p.R235H | Q9H4A6 | protein_coding | deleterious(0) | probably_damaging(0.977) | TCGA-AA-3864-01 | Colorectum | colon adenocarcinoma | Male | >=65 | I/II | Unknown | Unknown | SD |
| GOLPH3 | SNV | Missense_Mutation | c.311N>C | p.Gln104Pro | p.Q104P | Q9H4A6 | protein_coding | tolerated(0.23) | benign(0.006) | TCGA-CM-6171-01 | Colorectum | colon adenocarcinoma | Female | >=65 | I/II | Unknown | Unknown | SD | |
| GOLPH3 | SNV | Missense_Mutation | c.394N>G | p.Leu132Val | p.L132V | Q9H4A6 | protein_coding | deleterious(0.02) | benign(0.193) | TCGA-DM-A28H-01 | Colorectum | colon adenocarcinoma | Male | <65 | III/IV | Unknown | Unknown | PD | |
| GOLPH3 | SNV | Missense_Mutation | rs773095936 | c.520N>T | p.Arg174Trp | p.R174W | Q9H4A6 | protein_coding | deleterious(0.02) | benign(0.214) | TCGA-G4-6588-01 | Colorectum | colon adenocarcinoma | Female | <65 | I/II | Unknown | Unknown | SD |
| GOLPH3 | SNV | Missense_Mutation | c.527N>A | p.Arg176Gln | p.R176Q | Q9H4A6 | protein_coding | deleterious(0) | benign(0.332) | TCGA-EI-6917-01 | Colorectum | rectum adenocarcinoma | Male | <65 | III/IV | Chemotherapy | 5fluorouracil+oxaciplatina+l-folinian | SD | |
| GOLPH3 | SNV | Missense_Mutation | novel | c.502T>C | p.Tyr168His | p.Y168H | Q9H4A6 | protein_coding | tolerated(0.06) | benign(0.251) | TCGA-A5-A2K3-01 | Endometrium | uterine corpus endometrioid carcinoma | Female | >=65 | I/II | Chemotherapy | carboplatin | SD |
| Page: 1 2 3 4 5 |
Top |
Related drugs of malignant transformation related genes |
| Identification of chemicals and drugs interact with genes involved in malignant transfromation |
| (DGIdb 4.0) |
| Entrez ID | Symbol | Category | Interaction Types | Drug Claim Name | Drug Name | PMIDs |
| Page: 1 |

Copyright 2023-Present -The University of Texas Health Science Center at Houston |