
|
|||||
|
 | |
| |
| |
| |
| |
| |
|
Gene: GOLM1 |
Gene summary for GOLM1 |
| Gene information | Species | Human | Gene symbol | GOLM1 | Gene ID | 51280 |
| Gene name | golgi membrane protein 1 | |
| Gene Alias | C9orf155 | |
| Cytomap | 9q21.33 | |
| Gene Type | protein-coding | GO ID | GO:0006629 | UniProtAcc | B3KNK9 |
Top |
Malignant transformation analysis |
| Identification of the aberrant gene expression in precancerous and cancerous lesions by comparing the gene expression of stem-like cells in diseased tissues with normal stem cells |
| Entrez ID | Symbol | Replicates | Species | Organ | Tissue | Adj P-value | Log2FC | Malignancy |
| 51280 | GOLM1 | HTA11_2487_2000001011 | Human | Colorectum | SER | 4.53e-08 | 6.83e-01 | -0.1808 |
| 51280 | GOLM1 | HTA11_1938_2000001011 | Human | Colorectum | AD | 2.21e-09 | 8.12e-01 | -0.0811 |
| 51280 | GOLM1 | HTA11_78_2000001011 | Human | Colorectum | AD | 6.96e-07 | 7.87e-01 | -0.1088 |
| 51280 | GOLM1 | HTA11_347_2000001011 | Human | Colorectum | AD | 5.05e-56 | 1.66e+00 | -0.1954 |
| 51280 | GOLM1 | HTA11_411_2000001011 | Human | Colorectum | SER | 5.86e-14 | 1.34e+00 | -0.2602 |
| 51280 | GOLM1 | HTA11_2112_2000001011 | Human | Colorectum | SER | 4.44e-03 | 6.39e-01 | -0.2196 |
| 51280 | GOLM1 | HTA11_83_2000001011 | Human | Colorectum | SER | 8.78e-19 | 1.25e+00 | -0.1526 |
| 51280 | GOLM1 | HTA11_696_2000001011 | Human | Colorectum | AD | 1.84e-08 | 8.18e-01 | -0.1464 |
| 51280 | GOLM1 | HTA11_1391_2000001011 | Human | Colorectum | AD | 7.96e-18 | 1.17e+00 | -0.059 |
| 51280 | GOLM1 | HTA11_5212_2000001011 | Human | Colorectum | AD | 3.62e-10 | 7.99e-01 | -0.2061 |
| 51280 | GOLM1 | HTA11_5216_2000001011 | Human | Colorectum | SER | 1.24e-07 | 8.85e-01 | -0.1462 |
| 51280 | GOLM1 | HTA11_546_2000001011 | Human | Colorectum | AD | 4.24e-06 | 7.06e-01 | -0.0842 |
| 51280 | GOLM1 | HTA11_7862_2000001011 | Human | Colorectum | AD | 1.06e-14 | 9.36e-01 | -0.0179 |
| 51280 | GOLM1 | HTA11_7663_2000001011 | Human | Colorectum | SER | 8.27e-08 | 8.37e-01 | 0.0131 |
| 51280 | GOLM1 | HTA11_10623_2000001011 | Human | Colorectum | AD | 3.88e-04 | 5.84e-01 | -0.0177 |
| 51280 | GOLM1 | HTA11_6801_2000001011 | Human | Colorectum | SER | 7.49e-08 | 1.05e+00 | 0.0171 |
| 51280 | GOLM1 | HTA11_7469_2000001011 | Human | Colorectum | AD | 1.85e-09 | 1.06e+00 | -0.0124 |
| 51280 | GOLM1 | HTA11_99999974143_84620 | Human | Colorectum | MSS | 1.32e-12 | -5.05e-01 | 0.3005 |
| 51280 | GOLM1 | A002-C-010 | Human | Colorectum | FAP | 9.06e-12 | -3.60e-01 | 0.242 |
| 51280 | GOLM1 | A015-C-203 | Human | Colorectum | FAP | 2.02e-35 | -4.70e-01 | -0.1294 |
| Page: 1 2 3 4 5 6 7 8 9 10 |
| Tissue | Expression Dynamics | Abbreviation |
| Colorectum (GSE201348) |  | FAP: Familial adenomatous polyposis |
| CRC: Colorectal cancer | ||
| Colorectum (HTA11) |  | AD: Adenomas |
| SER: Sessile serrated lesions | ||
| MSI-H: Microsatellite-high colorectal cancer | ||
| MSS: Microsatellite stable colorectal cancer | ||
| Endometrium | 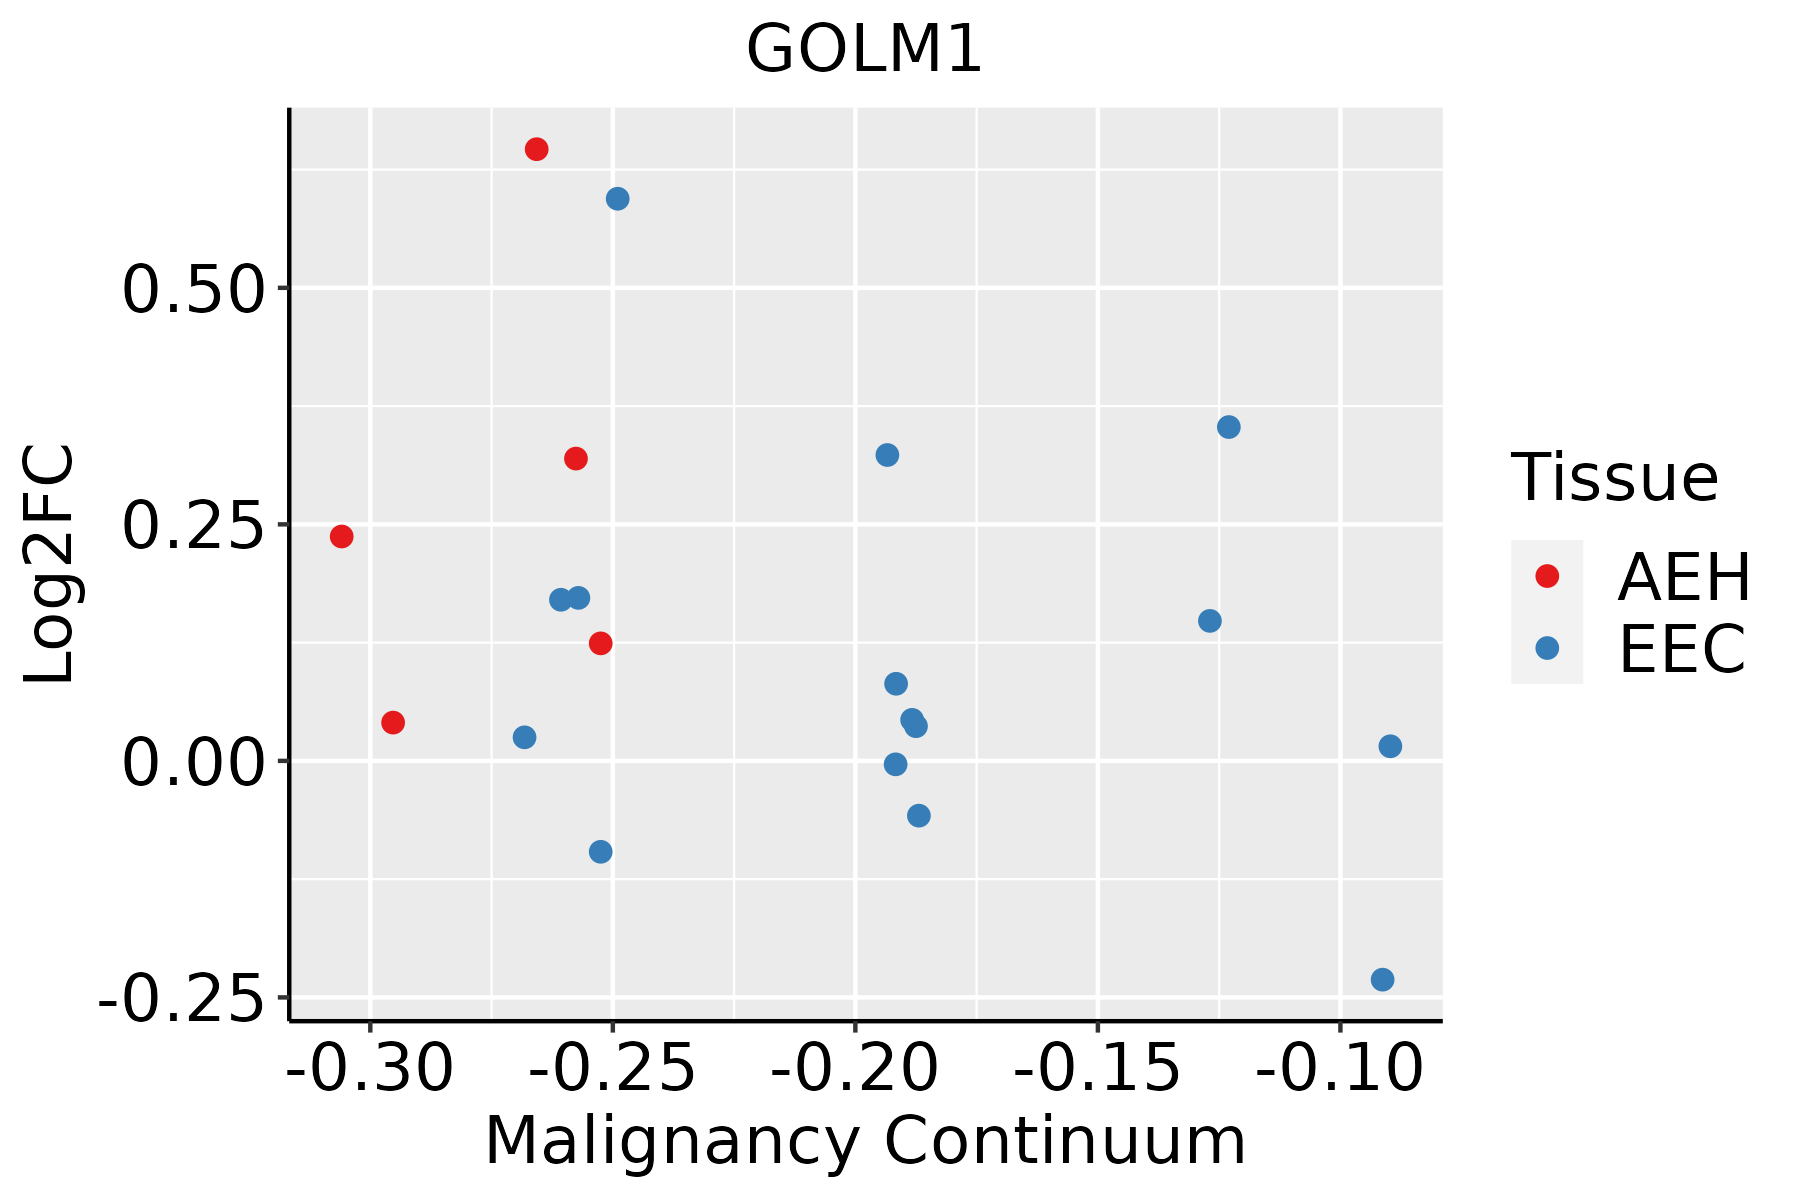 | AEH: Atypical endometrial hyperplasia |
| EEC: Endometrioid Cancer | ||
| Esophagus | 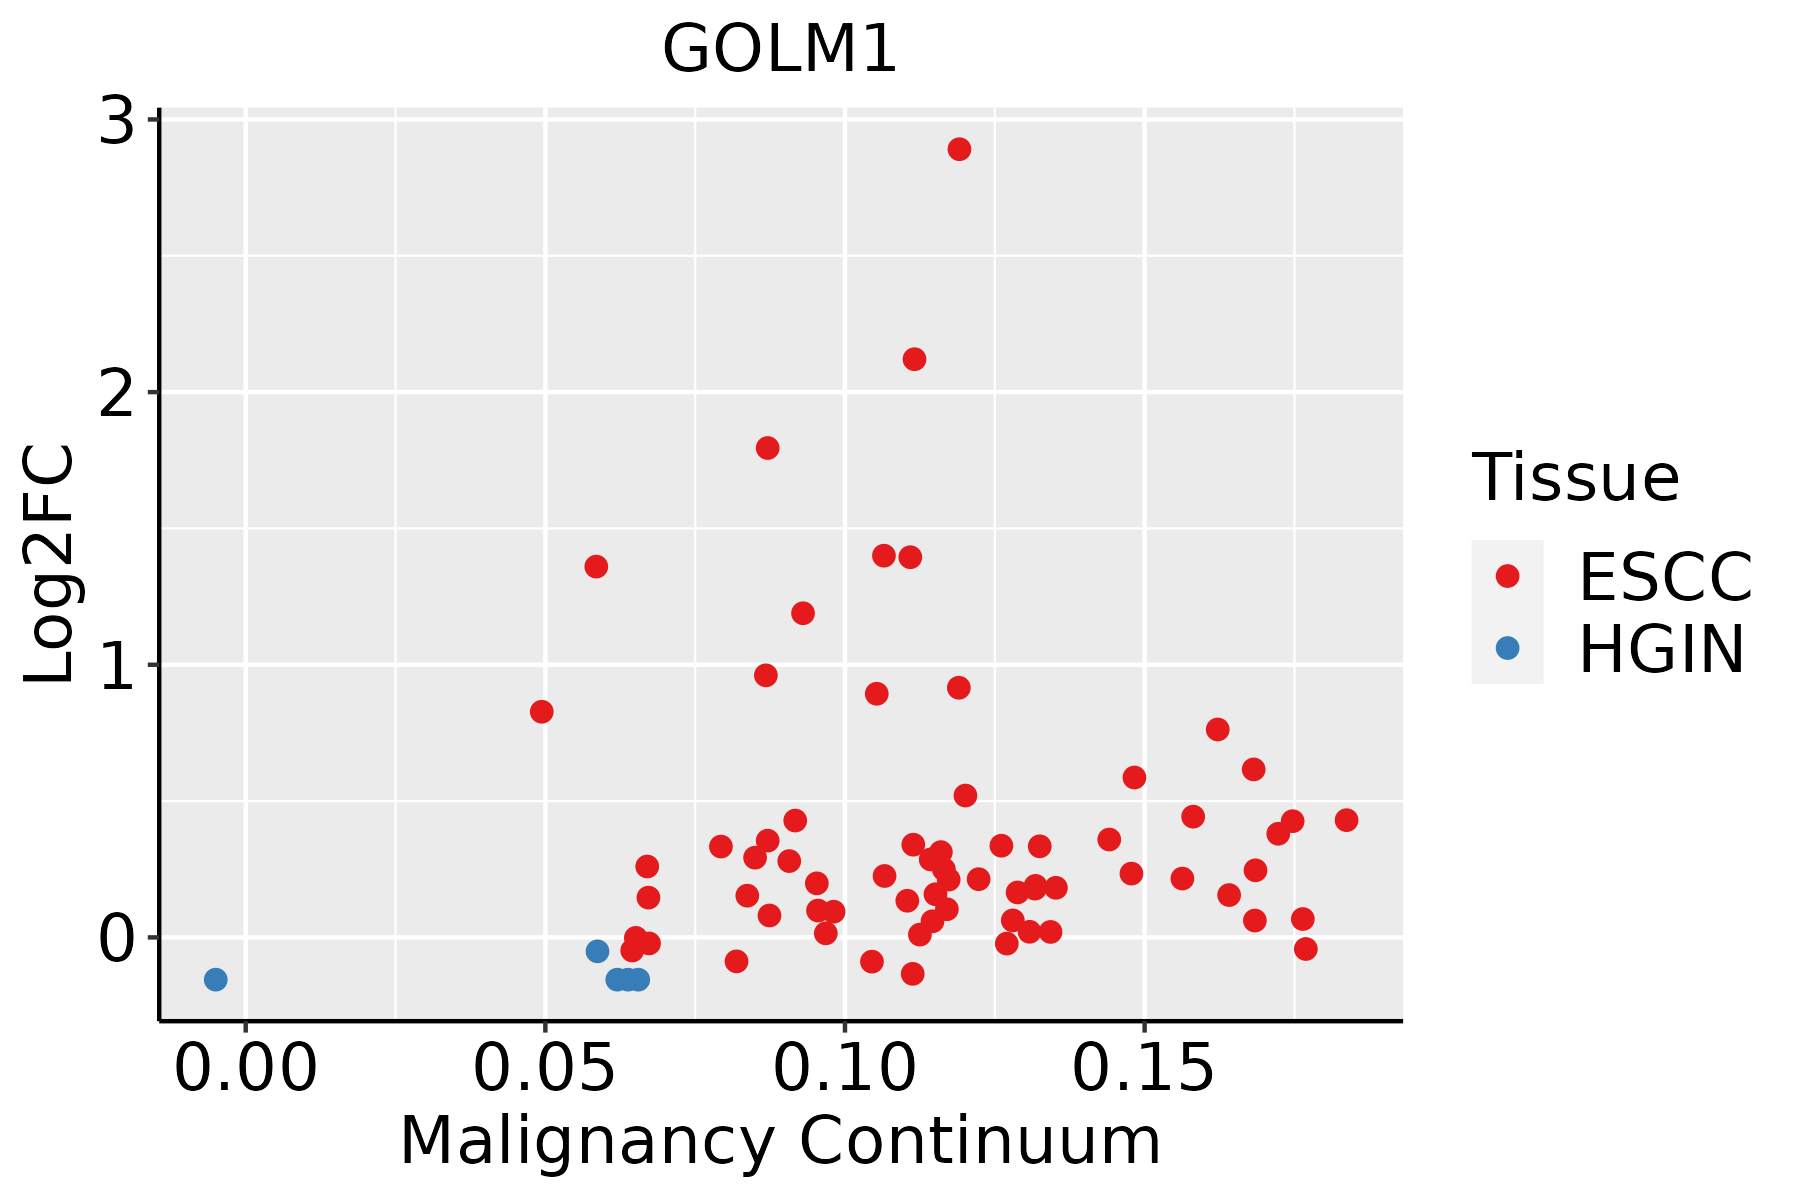 | ESCC: Esophageal squamous cell carcinoma |
| HGIN: High-grade intraepithelial neoplasias | ||
| LGIN: Low-grade intraepithelial neoplasias | ||
| GC | 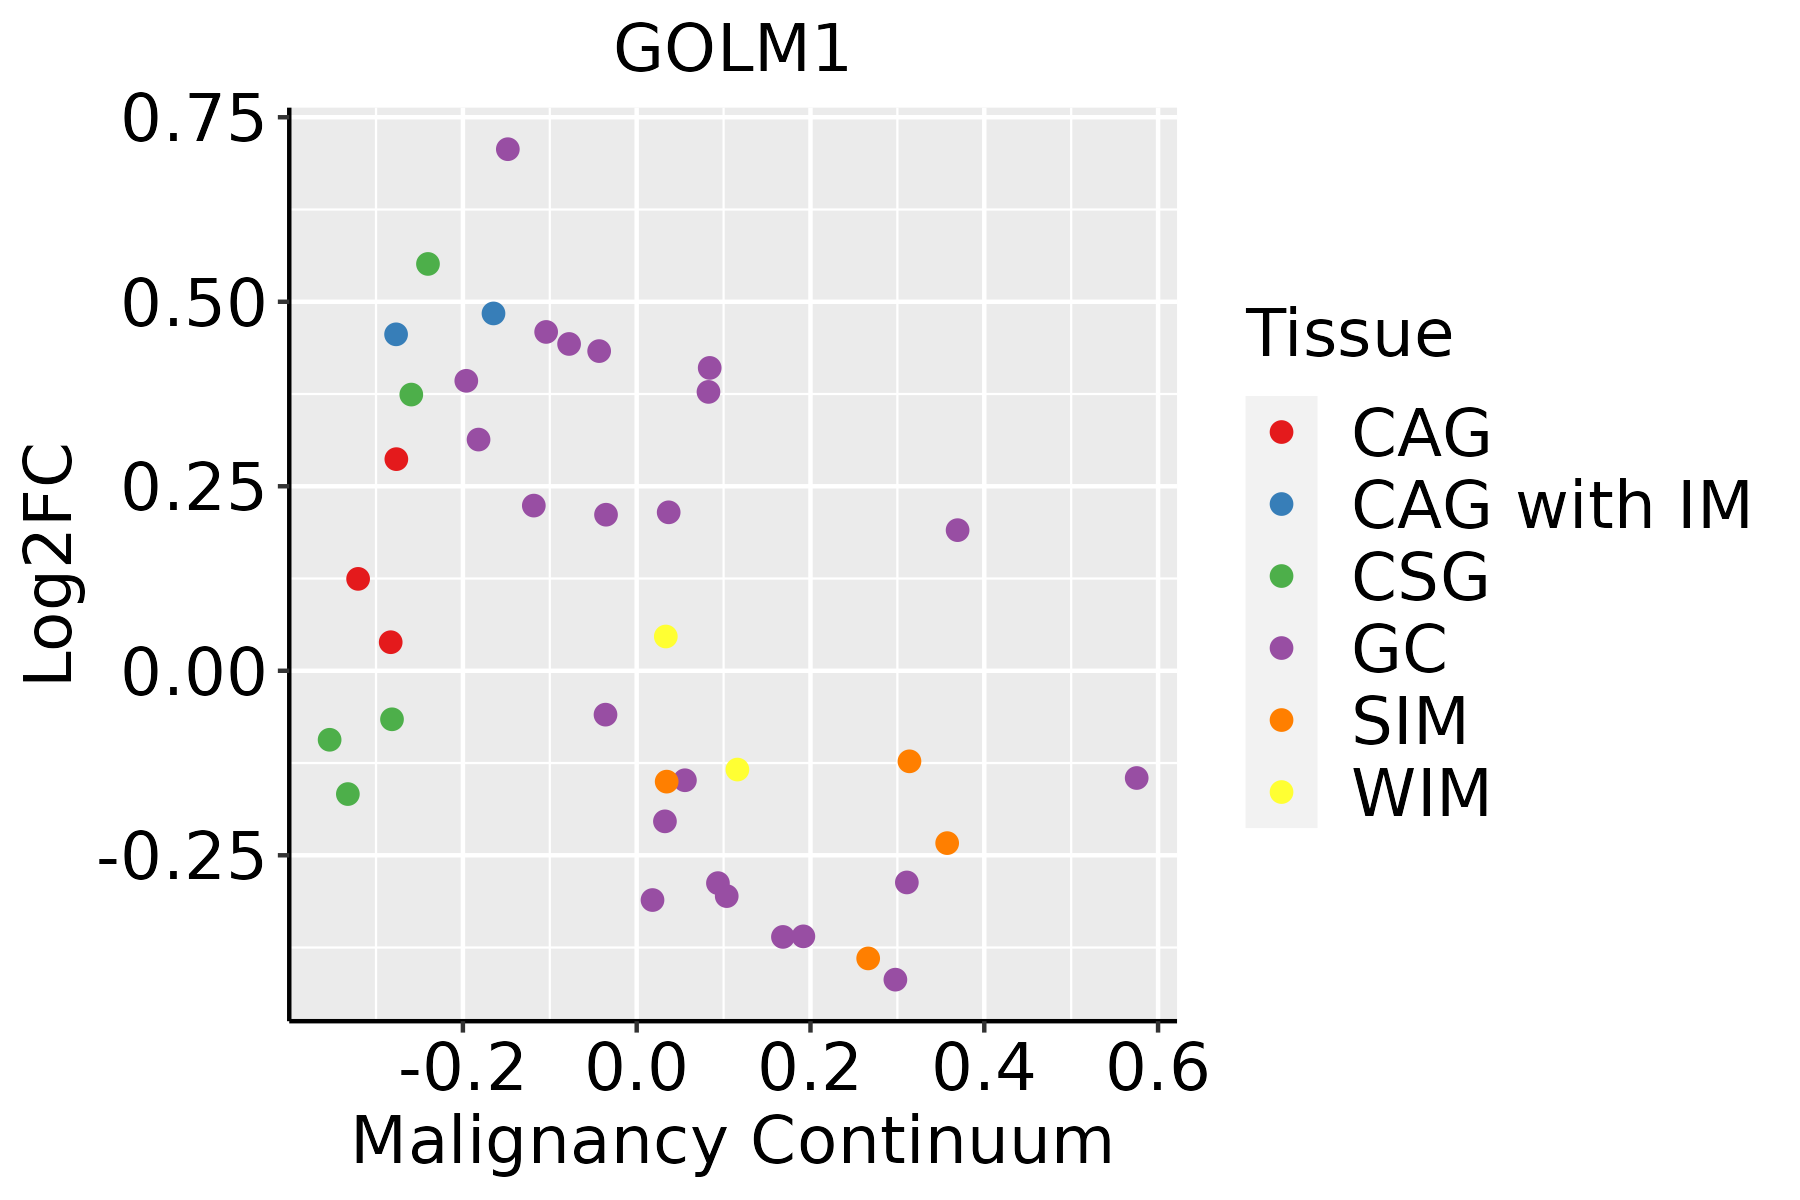 | CAG: Chronic atrophic gastritis |
| CAG with IM: Chronic atrophic gastritis with intestinal metaplasia | ||
| CSG: Chronic superficial gastritis | ||
| GC: Gastric cancer | ||
| SIM: Severe intestinal metaplasia | ||
| WIM: Wild intestinal metaplasia | ||
| Liver | 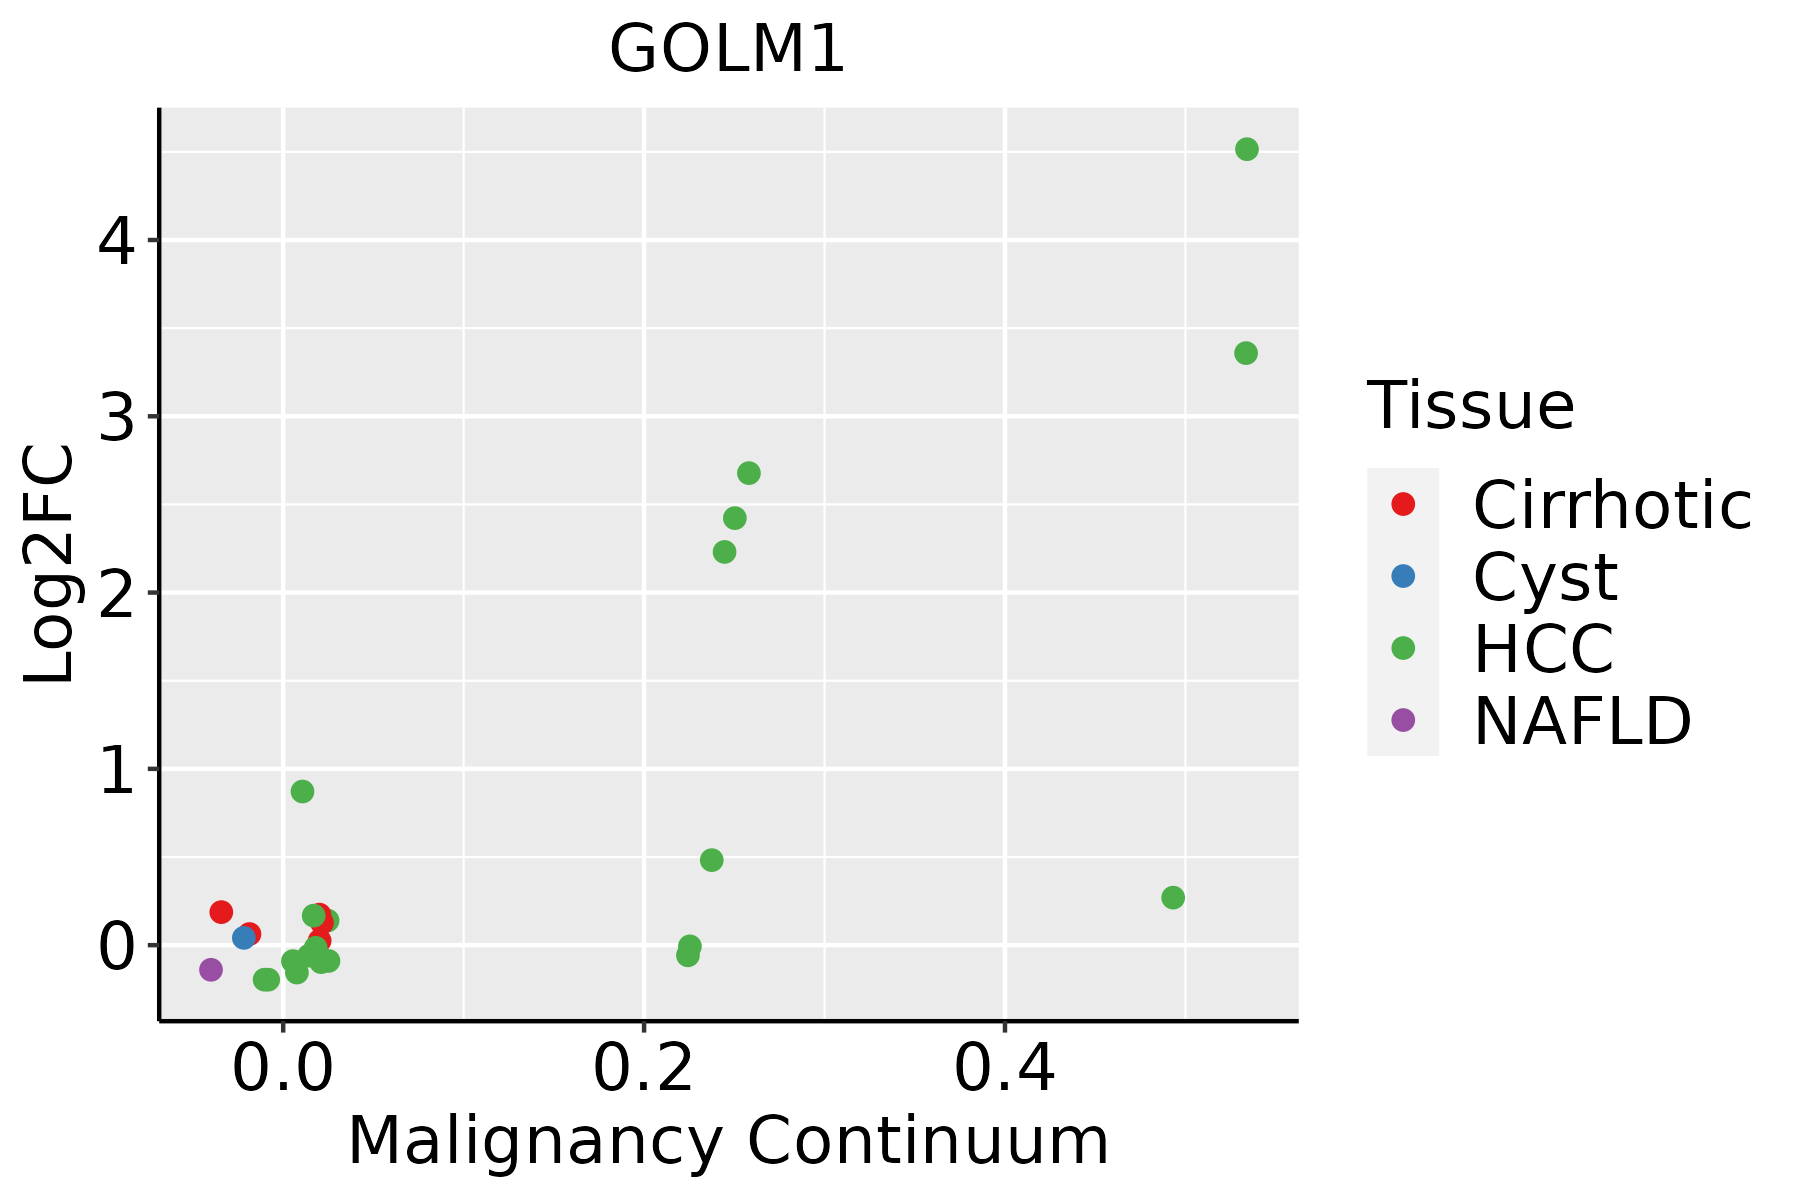 | HCC: Hepatocellular carcinoma |
| NAFLD: Non-alcoholic fatty liver disease | ||
| Oral Cavity | 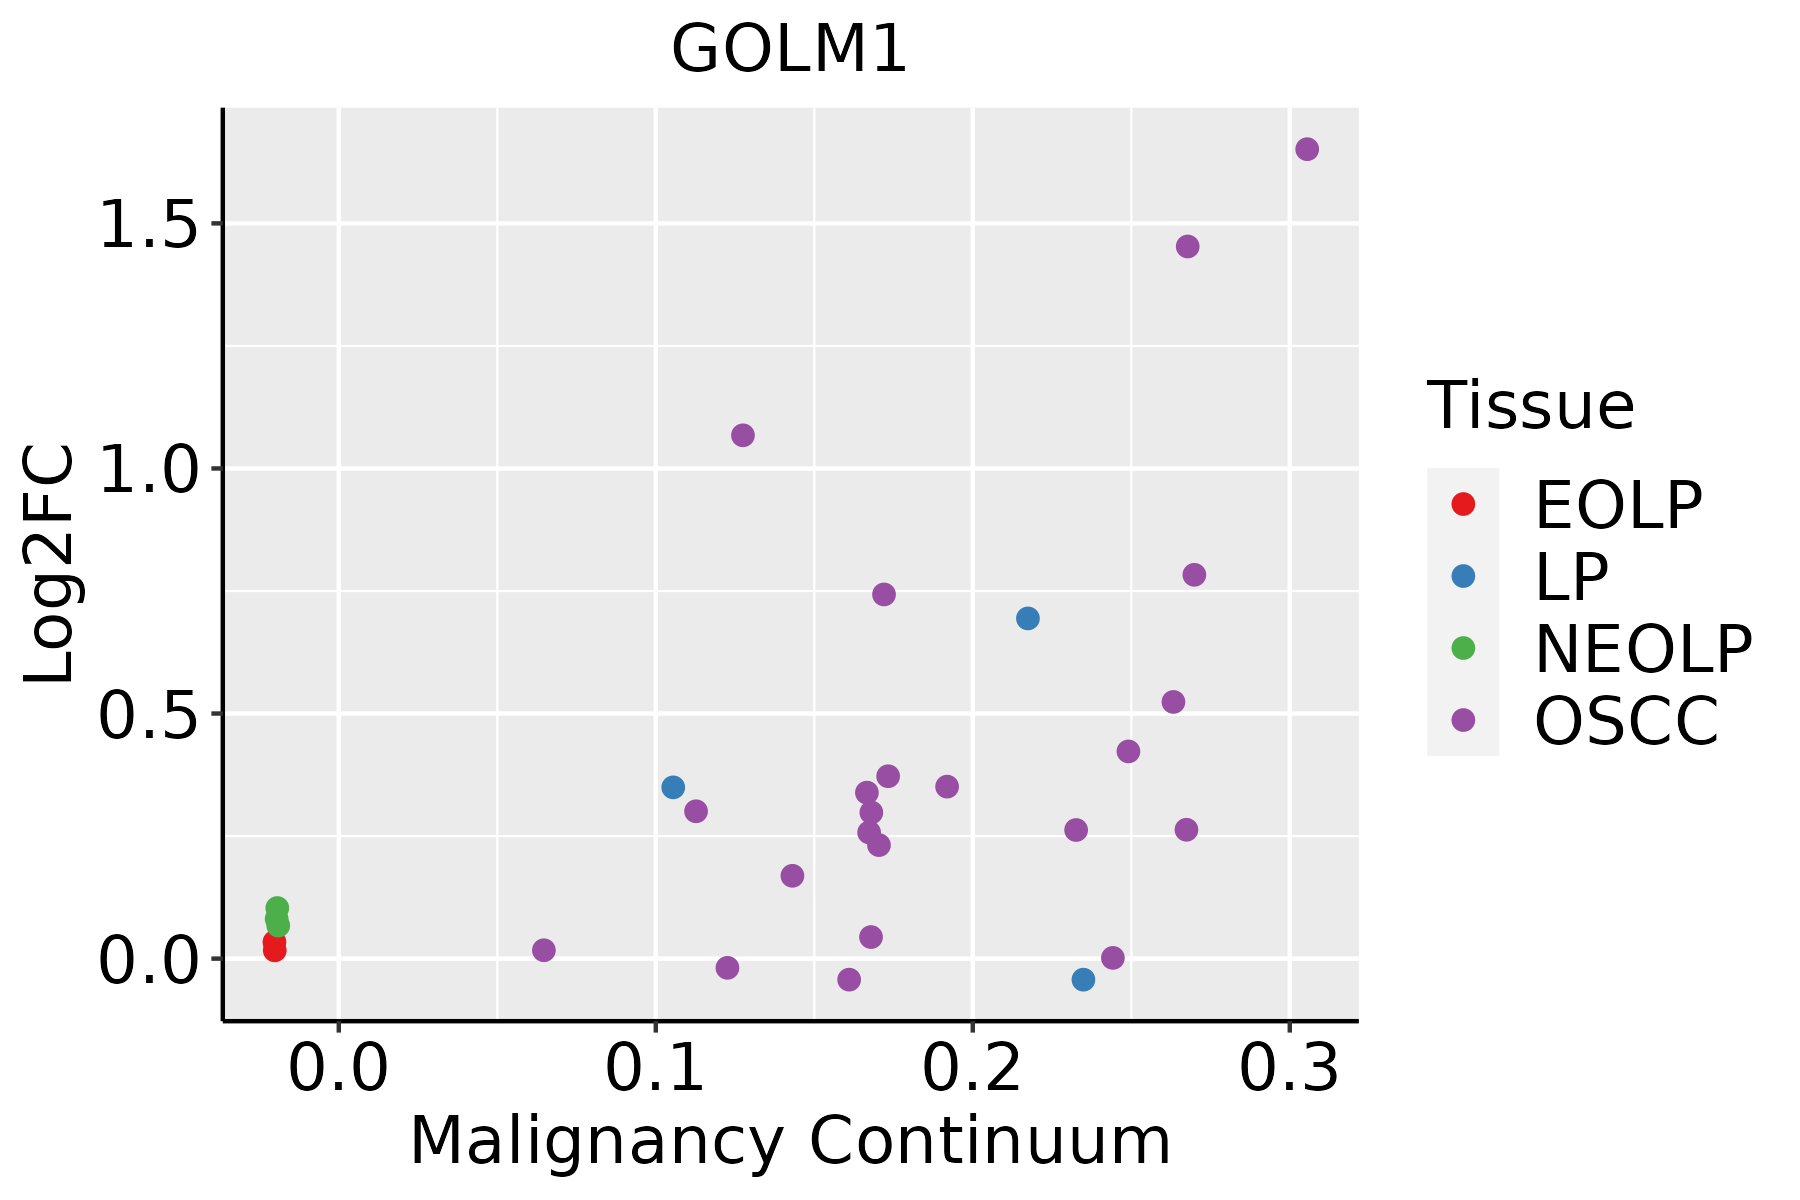 | EOLP: Erosive Oral lichen planus |
| LP: leukoplakia | ||
| NEOLP: Non-erosive oral lichen planus | ||
| OSCC: Oral squamous cell carcinoma | ||
| Prostate | 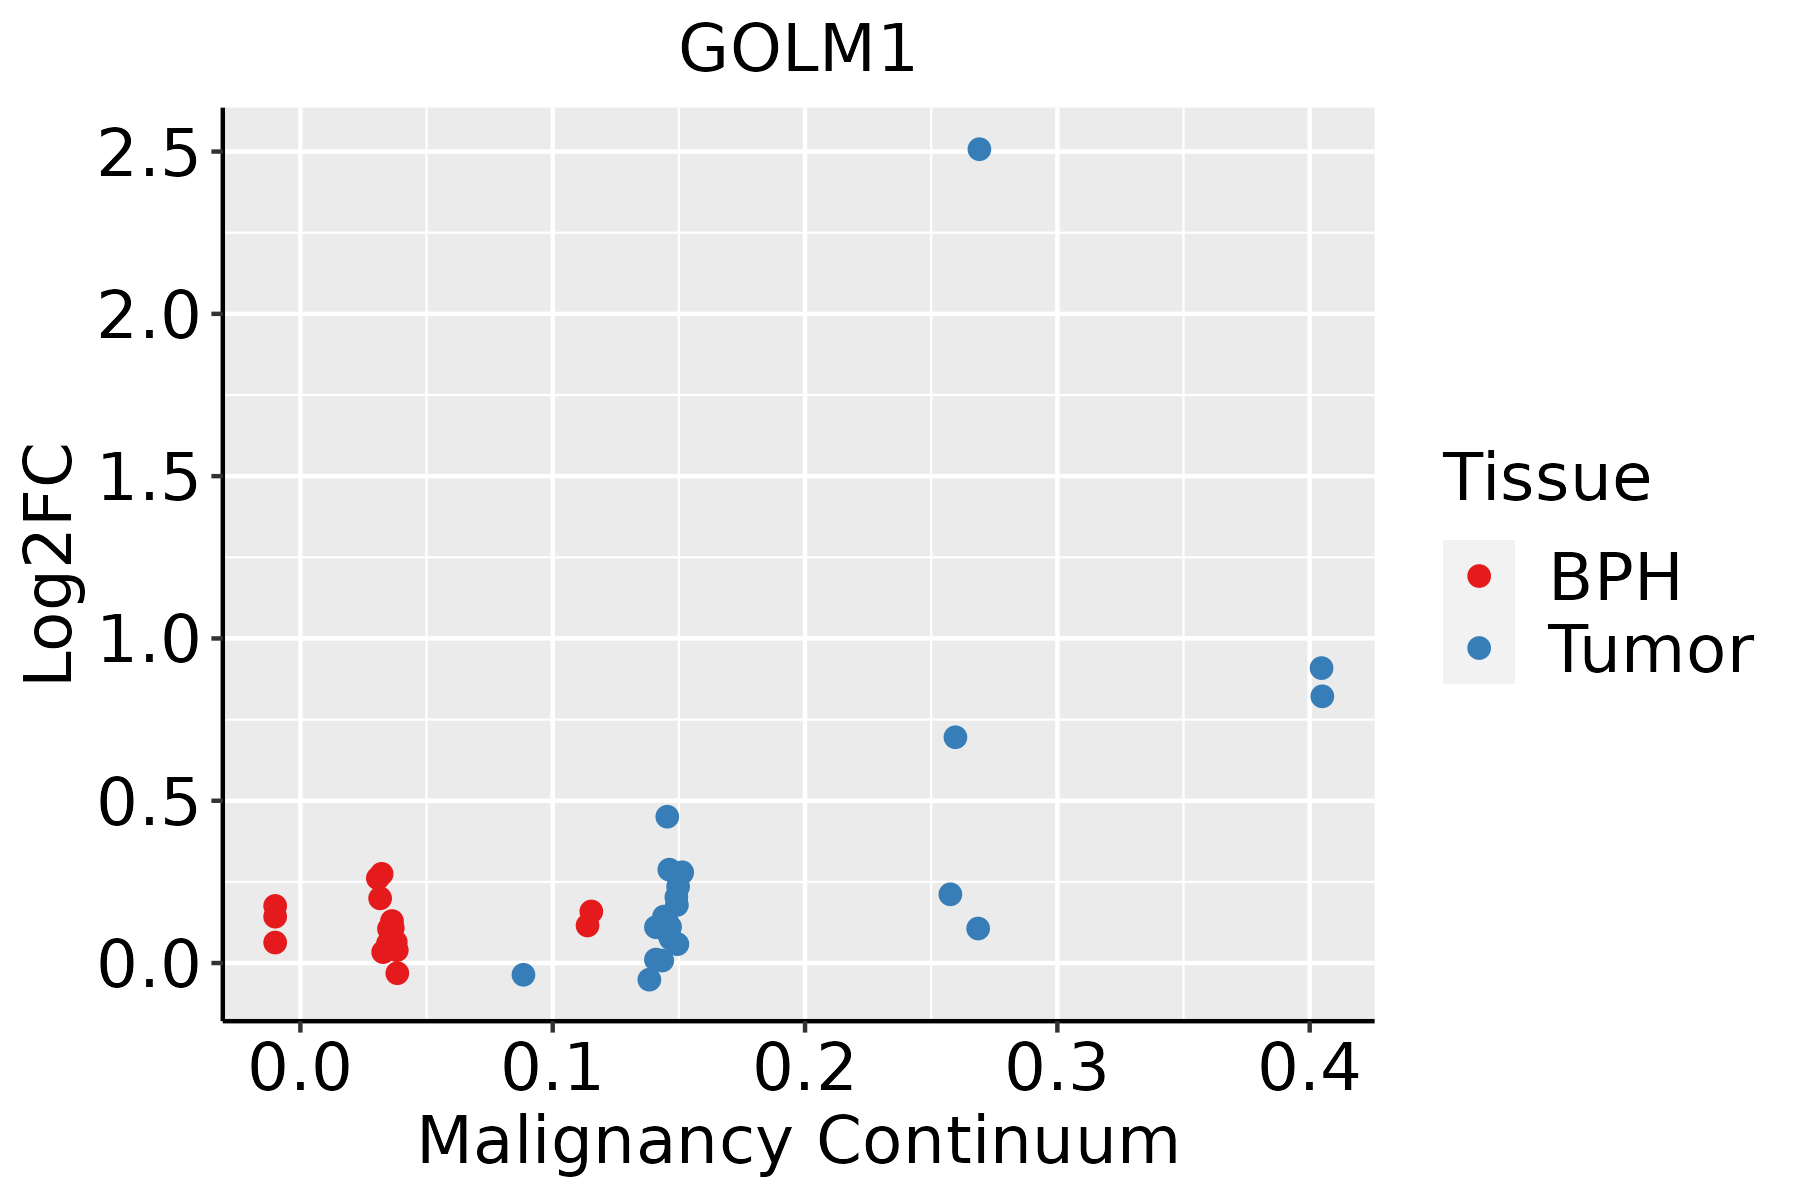 | BPH: Benign Prostatic Hyperplasia |
| Thyroid |  | ATC: Anaplastic thyroid cancer |
| HT: Hashimoto's thyroiditis | ||
| PTC: Papillary thyroid cancer |
| ∗log2FC in expression of this searched gene in stem-like cells from each diseased tissue sample relative to stem-like cells in normal samples in each tissue plotted against the malignancy continuum. Samples are colored based on if they are from different disease stage. |
Top |
Malignant transformation related pathway analysis |
| Find out the enriched GO biological processes and KEGG pathways involved in transition from healthy to precancer to cancer |
| Tissue | Disease Stage | Enriched GO biological Processes |
| Colorectum | AD |  |
| Colorectum | SER |  |
| Colorectum | MSS |  |
| Colorectum | MSI-H |  |
| Colorectum | FAP |  |
| ∗Top 15 enriched GO BP terms are showed in the bar plot of each disease state in each tissue. Each row represents a significant GO biological process which is colored according to the -log10(p.adjust). |
| Page: 1 2 3 4 5 6 7 8 9 |
| GO ID | Tissue | Disease Stage | Description | Gene Ratio | Bg Ratio | pvalue | p.adjust | Count |
| GO:00192165 | Endometrium | AEH | regulation of lipid metabolic process | 53/2100 | 331/18723 | 4.86e-03 | 3.07e-02 | 53 |
| GO:001921613 | Endometrium | EEC | regulation of lipid metabolic process | 54/2168 | 331/18723 | 5.82e-03 | 3.49e-02 | 54 |
| GO:000699713 | Esophagus | ESCC | nucleus organization | 96/8552 | 133/18723 | 4.66e-10 | 1.21e-08 | 96 |
| GO:00192168 | Esophagus | ESCC | regulation of lipid metabolic process | 172/8552 | 331/18723 | 1.20e-02 | 4.02e-02 | 172 |
| GO:001921611 | Liver | Cirrhotic | regulation of lipid metabolic process | 119/4634 | 331/18723 | 3.05e-06 | 5.39e-05 | 119 |
| GO:0006997 | Liver | Cirrhotic | nucleus organization | 48/4634 | 133/18723 | 2.27e-03 | 1.38e-02 | 48 |
| GO:00192162 | Liver | HCC | regulation of lipid metabolic process | 181/7958 | 331/18723 | 4.58e-06 | 5.79e-05 | 181 |
| GO:00069971 | Liver | HCC | nucleus organization | 82/7958 | 133/18723 | 6.32e-06 | 7.72e-05 | 82 |
| GO:00069974 | Oral cavity | OSCC | nucleus organization | 85/7305 | 133/18723 | 5.12e-09 | 1.12e-07 | 85 |
| GO:00192167 | Oral cavity | OSCC | regulation of lipid metabolic process | 154/7305 | 331/18723 | 3.00e-03 | 1.30e-02 | 154 |
| GO:00069972 | Prostate | BPH | nucleus organization | 38/3107 | 133/18723 | 3.69e-04 | 2.72e-03 | 38 |
| GO:000699711 | Prostate | Tumor | nucleus organization | 38/3246 | 133/18723 | 8.78e-04 | 5.89e-03 | 38 |
| GO:00192166 | Prostate | Tumor | regulation of lipid metabolic process | 76/3246 | 331/18723 | 5.04e-03 | 2.45e-02 | 76 |
| GO:0019216 | Stomach | GC | regulation of lipid metabolic process | 37/1159 | 331/18723 | 3.67e-04 | 5.70e-03 | 37 |
| GO:00192161 | Stomach | SIM | regulation of lipid metabolic process | 27/708 | 331/18723 | 1.58e-04 | 3.50e-03 | 27 |
| GO:00069977 | Thyroid | PTC | nucleus organization | 65/5968 | 133/18723 | 3.16e-05 | 3.01e-04 | 65 |
| GO:000699714 | Thyroid | ATC | nucleus organization | 65/6293 | 133/18723 | 1.87e-04 | 1.26e-03 | 65 |
| Page: 1 |
| Pathway ID | Tissue | Disease Stage | Description | Gene Ratio | Bg Ratio | pvalue | p.adjust | qvalue | Count |
| Page: 1 |
Top |
Cell-cell communication analysis |
| Identification of potential cell-cell interactions between two cell types and their ligand-receptor pairs for different disease states |
| Ligand | Receptor | LRpair | Pathway | Tissue | Disease Stage |
| Page: 1 |
Top |
Single-cell gene regulatory network inference analysis |
| Find out the significant the regulons (TFs) and the target genes of each regulon across cell types for different disease states |
| TF | Cell Type | Tissue | Disease Stage | Target Gene | RSS | Regulon Activity |
| ∗The dot plots of a searched regulon are shown for all cell subpopulations in each disease state of each tissue based on the regulon specific score inferred using pySCENIC and by calculating the average expression. |
| Page: 1 |
Top |
Somatic mutation of malignant transformation related genes |
| Annotation of somatic variants for genes involved in malignant transformation |
| Hugo Symbol | Variant Class | Variant Classification | dbSNP RS | HGVSc | HGVSp | HGVSp Short | SWISSPROT | BIOTYPE | SIFT | PolyPhen | Tumor Sample Barcode | Tissue | Histology | Sex | Age | Stage | Therapy Types | Drugs | Outcome |
| GOLM1 | SNV | Missense_Mutation | rs763578163 | c.113N>A | p.Arg38Gln | p.R38Q | Q8NBJ4 | protein_coding | deleterious(0) | probably_damaging(0.997) | TCGA-D8-A1XZ-01 | Breast | breast invasive carcinoma | Female | >=65 | III/IV | Hormone Therapy | tamoxiphen+anastrozolum | SD |
| GOLM1 | SNV | Missense_Mutation | novel | c.375N>T | p.Lys125Asn | p.K125N | Q8NBJ4 | protein_coding | tolerated(0.16) | possibly_damaging(0.813) | TCGA-2W-A8YY-01 | Cervix | cervical & endocervical cancer | Female | <65 | I/II | Chemotherapy | cisplatin | CR |
| GOLM1 | SNV | Missense_Mutation | rs764069710 | c.58N>A | p.Ala20Thr | p.A20T | Q8NBJ4 | protein_coding | deleterious(0) | probably_damaging(0.963) | TCGA-2W-A8YY-01 | Cervix | cervical & endocervical cancer | Female | <65 | I/II | Chemotherapy | cisplatin | CR |
| GOLM1 | SNV | Missense_Mutation | novel | c.387N>C | p.Arg129Ser | p.R129S | Q8NBJ4 | protein_coding | tolerated(0.2) | benign(0.085) | TCGA-HM-A4S6-01 | Cervix | cervical & endocervical cancer | Female | <65 | III/IV | Chemotherapy | cisplatin | CR |
| GOLM1 | SNV | Missense_Mutation | rs780788709 | c.160C>T | p.Arg54Cys | p.R54C | Q8NBJ4 | protein_coding | deleterious(0) | probably_damaging(0.998) | TCGA-A6-2686-01 | Colorectum | colon adenocarcinoma | Female | >=65 | I/II | Unknown | Unknown | SD |
| GOLM1 | SNV | Missense_Mutation | novel | c.740A>C | p.Lys247Thr | p.K247T | Q8NBJ4 | protein_coding | deleterious(0.02) | possibly_damaging(0.801) | TCGA-CA-6717-01 | Colorectum | colon adenocarcinoma | Male | <65 | I/II | Chemotherapy | oxaliplatin | CR |
| GOLM1 | SNV | Missense_Mutation | novel | c.563N>T | p.Arg188Ile | p.R188I | Q8NBJ4 | protein_coding | deleterious(0.03) | possibly_damaging(0.653) | TCGA-AG-3878-01 | Colorectum | rectum adenocarcinoma | Male | <65 | I/II | Unknown | Unknown | SD |
| GOLM1 | SNV | Missense_Mutation | novel | c.741N>T | p.Lys247Asn | p.K247N | Q8NBJ4 | protein_coding | tolerated(0.07) | possibly_damaging(0.801) | TCGA-AG-A002-01 | Colorectum | rectum adenocarcinoma | Male | <65 | I/II | Unknown | Unknown | SD |
| GOLM1 | insertion | Frame_Shift_Ins | novel | c.539_540insA | p.Asn182GlufsTer2 | p.N182Efs*2 | Q8NBJ4 | protein_coding | TCGA-AA-A01P-01 | Colorectum | colon adenocarcinoma | Female | >=65 | III/IV | Unknown | Unknown | PD | ||
| GOLM1 | insertion | Frame_Shift_Ins | novel | c.539_540insT | p.Lys180AsnfsTer4 | p.K180Nfs*4 | Q8NBJ4 | protein_coding | TCGA-DM-A1D0-01 | Colorectum | colon adenocarcinoma | Female | >=65 | I/II | Unknown | Unknown | SD |
| Page: 1 2 3 4 |
Top |
Related drugs of malignant transformation related genes |
| Identification of chemicals and drugs interact with genes involved in malignant transfromation |
| (DGIdb 4.0) |
| Entrez ID | Symbol | Category | Interaction Types | Drug Claim Name | Drug Name | PMIDs |
| Page: 1 |

Copyright 2023-Present -The University of Texas Health Science Center at Houston |