
|
|||||
|
 | |
| |
| |
| |
| |
| |
|
Gene: GOLIM4 |
Gene summary for GOLIM4 |
| Gene information | Species | Human | Gene symbol | GOLIM4 | Gene ID | 27333 |
| Gene name | golgi integral membrane protein 4 | |
| Gene Alias | GIMPC | |
| Cytomap | 3q26.2 | |
| Gene Type | protein-coding | GO ID | GO:0000139 | UniProtAcc | F8W785 |
Top |
Malignant transformation analysis |
| Identification of the aberrant gene expression in precancerous and cancerous lesions by comparing the gene expression of stem-like cells in diseased tissues with normal stem cells |
| Entrez ID | Symbol | Replicates | Species | Organ | Tissue | Adj P-value | Log2FC | Malignancy |
| 27333 | GOLIM4 | HTA11_3410_2000001011 | Human | Colorectum | AD | 3.85e-12 | -5.03e-01 | 0.0155 |
| 27333 | GOLIM4 | HTA11_2487_2000001011 | Human | Colorectum | SER | 8.98e-04 | -4.64e-01 | -0.1808 |
| 27333 | GOLIM4 | HTA11_347_2000001011 | Human | Colorectum | AD | 5.12e-06 | 4.34e-01 | -0.1954 |
| 27333 | GOLIM4 | HTA11_7862_2000001011 | Human | Colorectum | AD | 3.14e-02 | -5.91e-01 | -0.0179 |
| 27333 | GOLIM4 | HTA11_8622_2000001021 | Human | Colorectum | SER | 1.61e-04 | -7.85e-01 | 0.0528 |
| 27333 | GOLIM4 | HTA11_99999971662_82457 | Human | Colorectum | MSS | 5.79e-05 | -3.80e-01 | 0.3859 |
| 27333 | GOLIM4 | HTA11_99999974143_84620 | Human | Colorectum | MSS | 2.04e-10 | -4.97e-01 | 0.3005 |
| 27333 | GOLIM4 | F007 | Human | Colorectum | FAP | 1.78e-02 | 2.43e-02 | 0.1176 |
| 27333 | GOLIM4 | A002-C-010 | Human | Colorectum | FAP | 3.29e-11 | 3.12e-01 | 0.242 |
| 27333 | GOLIM4 | A015-C-203 | Human | Colorectum | FAP | 1.85e-31 | -2.30e-01 | -0.1294 |
| 27333 | GOLIM4 | A015-C-204 | Human | Colorectum | FAP | 5.51e-05 | -1.24e-01 | -0.0228 |
| 27333 | GOLIM4 | A014-C-040 | Human | Colorectum | FAP | 2.77e-02 | -3.08e-01 | -0.1184 |
| 27333 | GOLIM4 | A002-C-201 | Human | Colorectum | FAP | 4.76e-09 | 5.01e-02 | 0.0324 |
| 27333 | GOLIM4 | A002-C-203 | Human | Colorectum | FAP | 2.28e-02 | 1.67e-01 | 0.2786 |
| 27333 | GOLIM4 | A001-C-119 | Human | Colorectum | FAP | 4.60e-04 | -3.43e-01 | -0.1557 |
| 27333 | GOLIM4 | A001-C-108 | Human | Colorectum | FAP | 4.88e-15 | -9.36e-02 | -0.0272 |
| 27333 | GOLIM4 | A002-C-021 | Human | Colorectum | FAP | 2.73e-06 | 3.98e-01 | 0.1171 |
| 27333 | GOLIM4 | A002-C-205 | Human | Colorectum | FAP | 1.04e-22 | -4.61e-02 | -0.1236 |
| 27333 | GOLIM4 | A015-C-006 | Human | Colorectum | FAP | 3.43e-19 | -6.01e-01 | -0.0994 |
| 27333 | GOLIM4 | A015-C-106 | Human | Colorectum | FAP | 6.32e-11 | 4.47e-02 | -0.0511 |
| Page: 1 2 3 4 5 6 7 8 9 |
| Tissue | Expression Dynamics | Abbreviation |
| Colorectum (GSE201348) |  | FAP: Familial adenomatous polyposis |
| CRC: Colorectal cancer | ||
| Colorectum (HTA11) |  | AD: Adenomas |
| SER: Sessile serrated lesions | ||
| MSI-H: Microsatellite-high colorectal cancer | ||
| MSS: Microsatellite stable colorectal cancer | ||
| Esophagus | 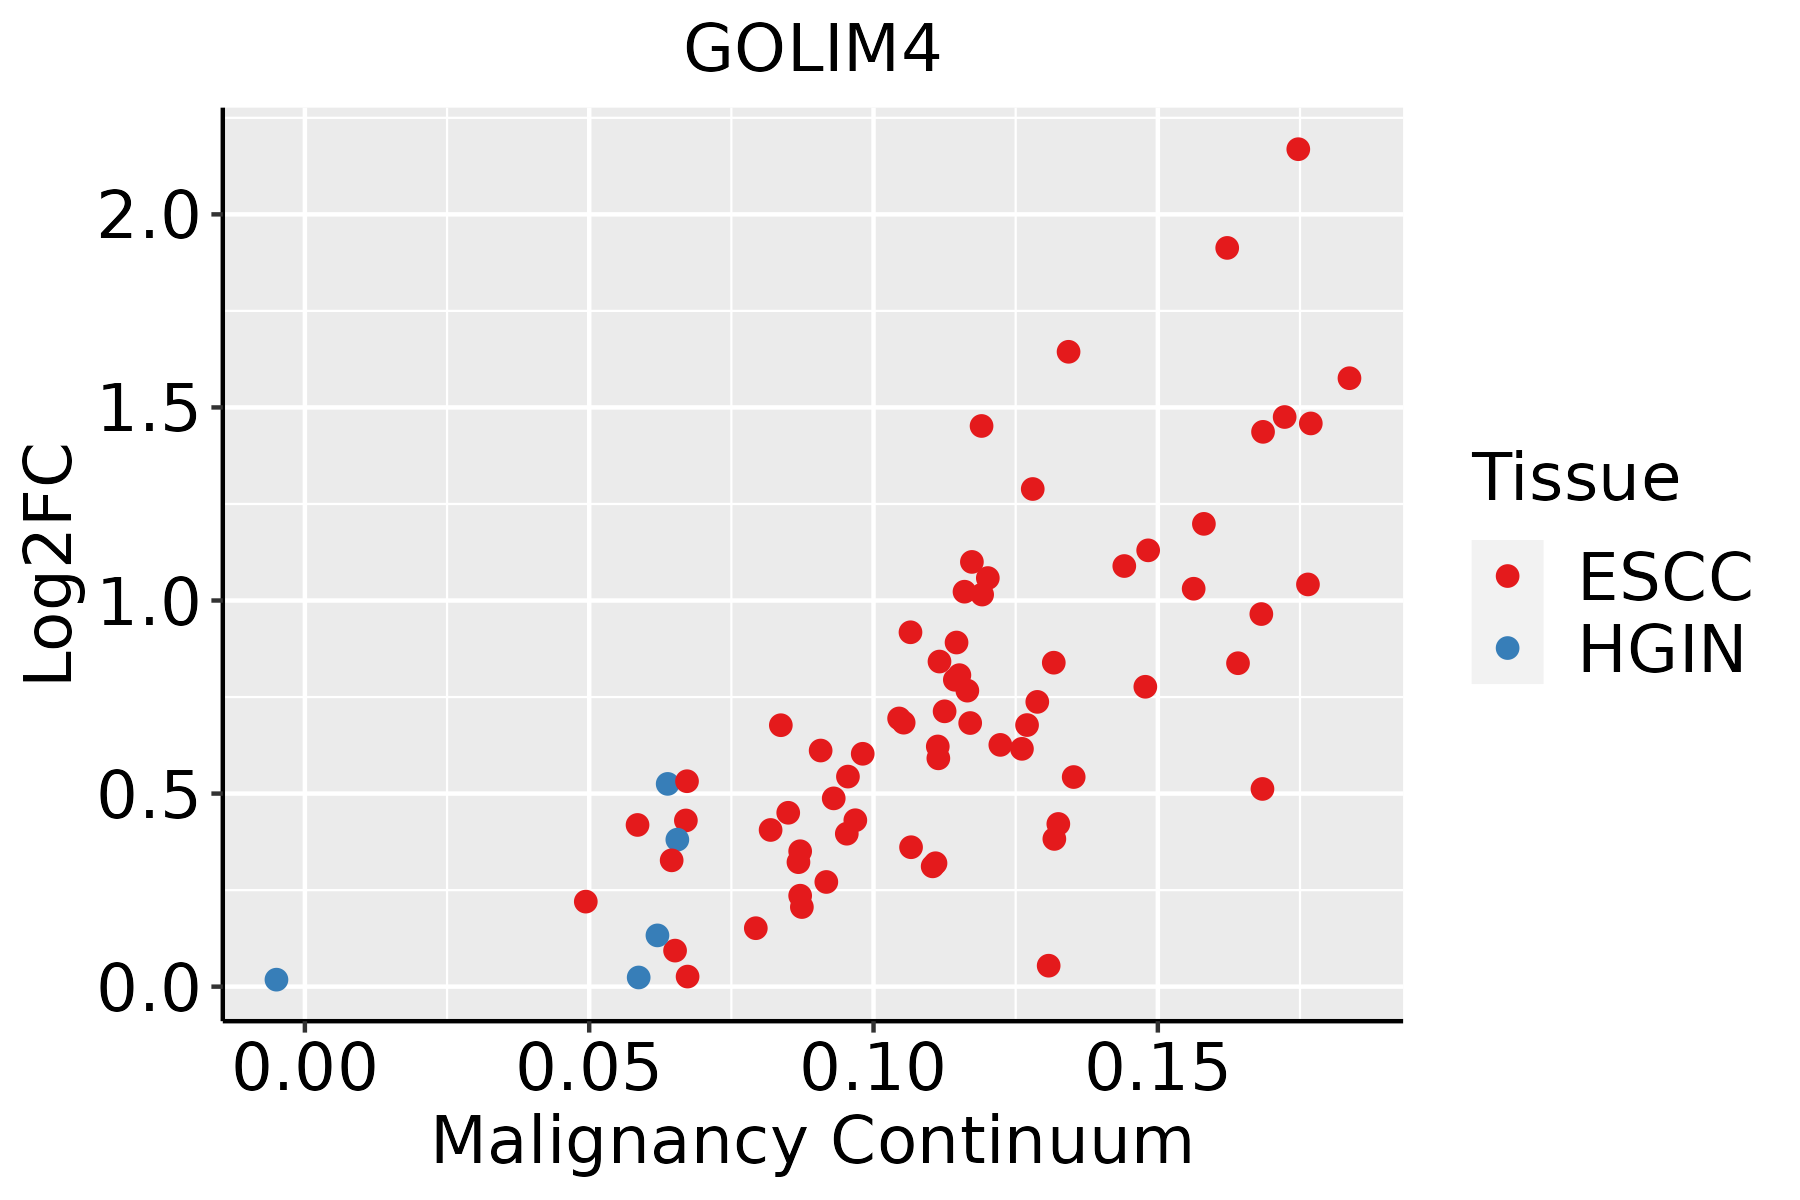 | ESCC: Esophageal squamous cell carcinoma |
| HGIN: High-grade intraepithelial neoplasias | ||
| LGIN: Low-grade intraepithelial neoplasias | ||
| Liver |  | HCC: Hepatocellular carcinoma |
| NAFLD: Non-alcoholic fatty liver disease | ||
| Oral Cavity |  | EOLP: Erosive Oral lichen planus |
| LP: leukoplakia | ||
| NEOLP: Non-erosive oral lichen planus | ||
| OSCC: Oral squamous cell carcinoma | ||
| Prostate | 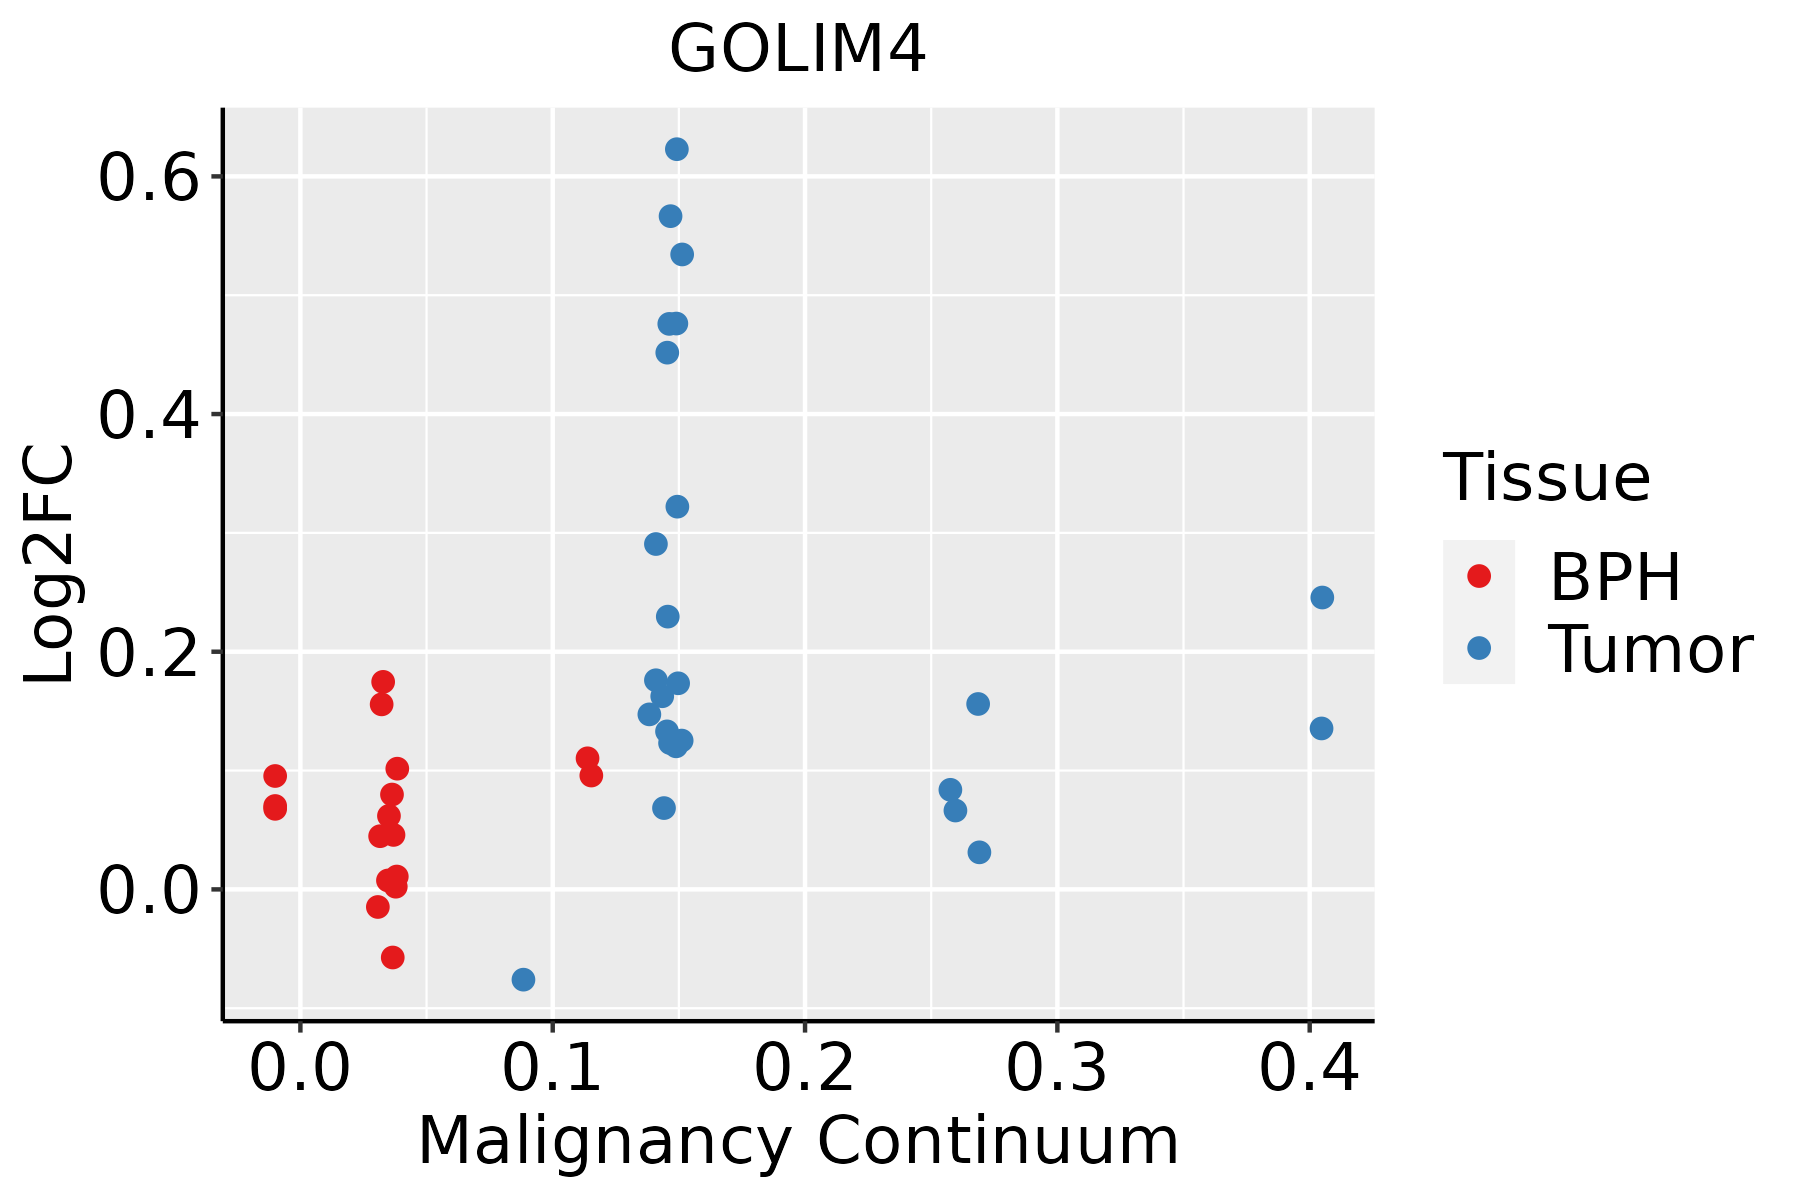 | BPH: Benign Prostatic Hyperplasia |
| Skin | 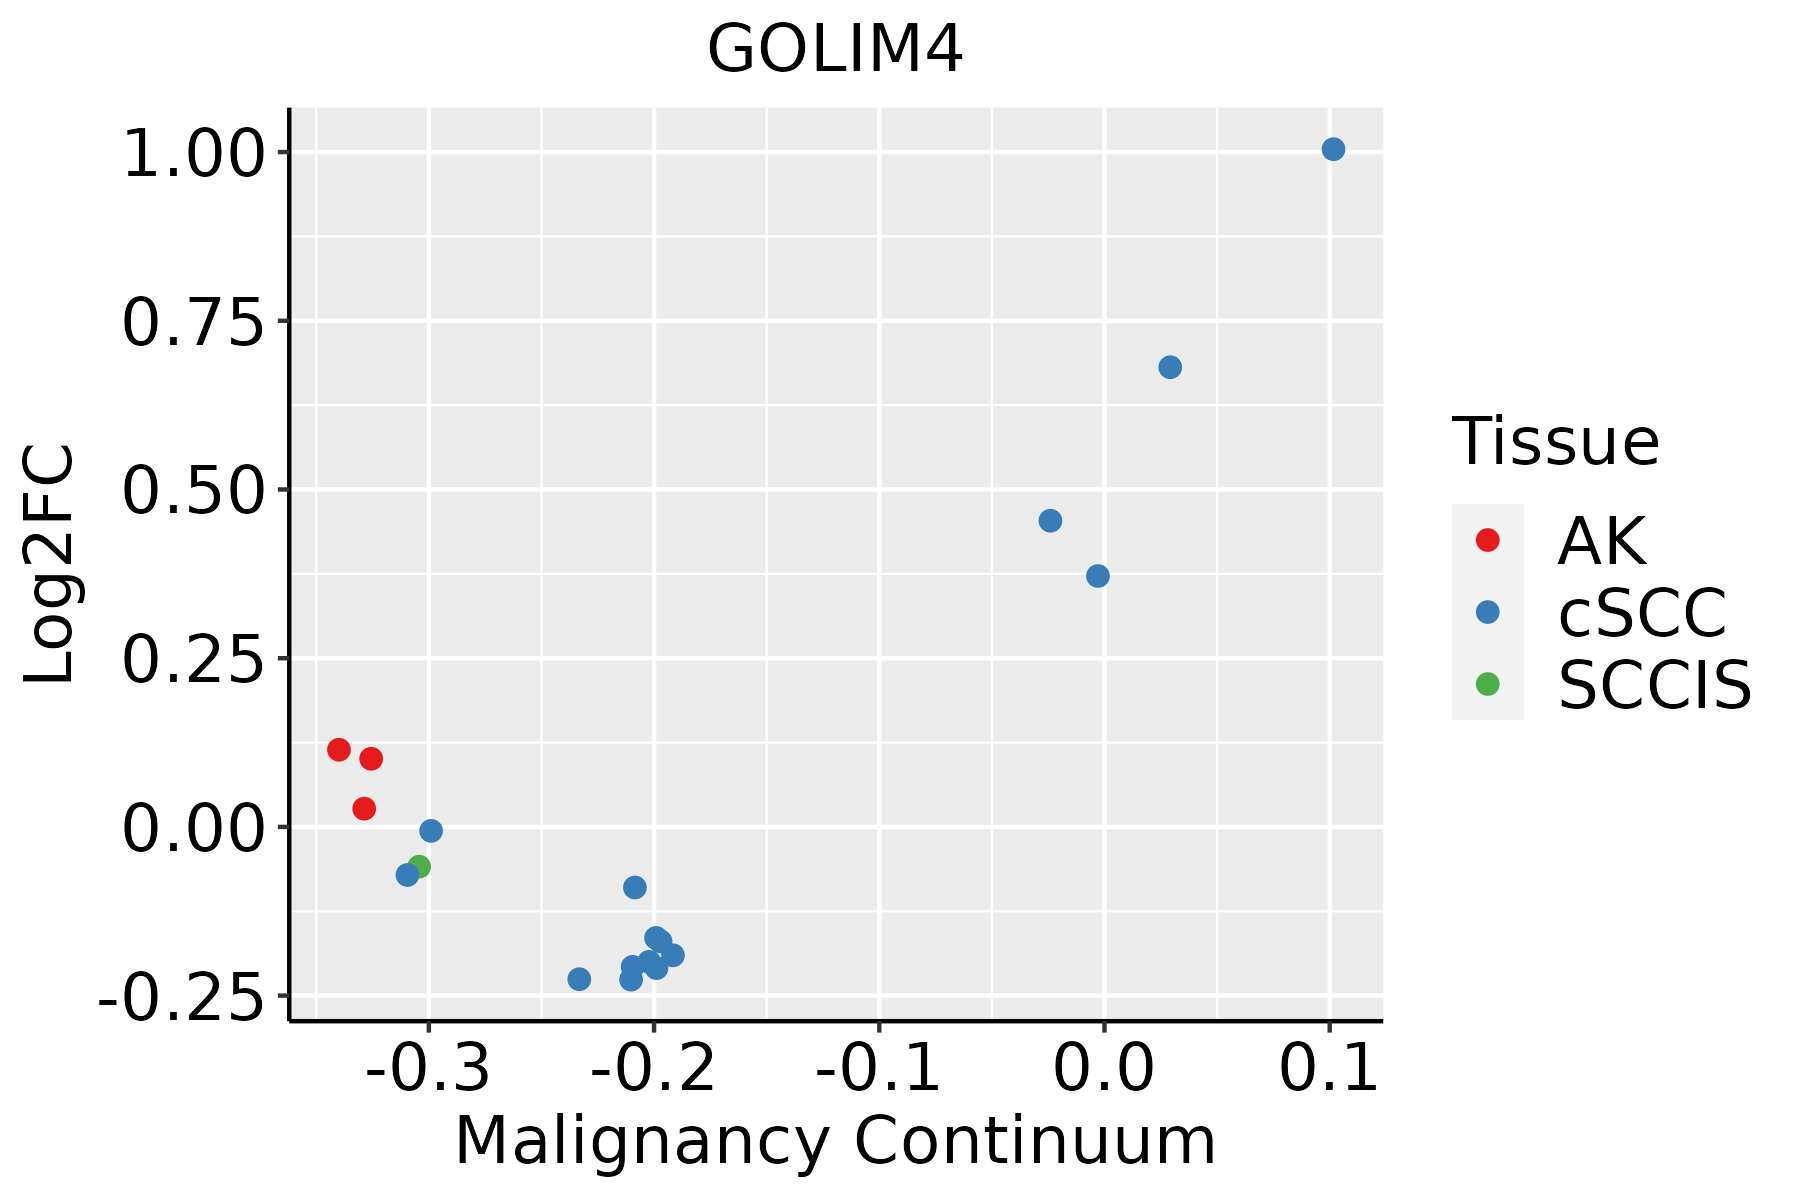 | AK: Actinic keratosis |
| cSCC: Cutaneous squamous cell carcinoma | ||
| SCCIS:squamous cell carcinoma in situ | ||
| Thyroid |  | ATC: Anaplastic thyroid cancer |
| HT: Hashimoto's thyroiditis | ||
| PTC: Papillary thyroid cancer |
| ∗log2FC in expression of this searched gene in stem-like cells from each diseased tissue sample relative to stem-like cells in normal samples in each tissue plotted against the malignancy continuum. Samples are colored based on if they are from different disease stage. |
Top |
Malignant transformation related pathway analysis |
| Find out the enriched GO biological processes and KEGG pathways involved in transition from healthy to precancer to cancer |
| Tissue | Disease Stage | Enriched GO biological Processes |
| Colorectum | AD |  |
| Colorectum | SER |  |
| Colorectum | MSS |  |
| Colorectum | MSI-H |  |
| Colorectum | FAP |  |
| ∗Top 15 enriched GO BP terms are showed in the bar plot of each disease state in each tissue. Each row represents a significant GO biological process which is colored according to the -log10(p.adjust). |
| Page: 1 2 3 4 5 6 7 8 9 |
| GO ID | Tissue | Disease Stage | Description | Gene Ratio | Bg Ratio | pvalue | p.adjust | Count |
| Page: 1 |
| Pathway ID | Tissue | Disease Stage | Description | Gene Ratio | Bg Ratio | pvalue | p.adjust | qvalue | Count |
| Page: 1 |
Top |
Cell-cell communication analysis |
| Identification of potential cell-cell interactions between two cell types and their ligand-receptor pairs for different disease states |
| Ligand | Receptor | LRpair | Pathway | Tissue | Disease Stage |
| Page: 1 |
Top |
Single-cell gene regulatory network inference analysis |
| Find out the significant the regulons (TFs) and the target genes of each regulon across cell types for different disease states |
| TF | Cell Type | Tissue | Disease Stage | Target Gene | RSS | Regulon Activity |
| ∗The dot plots of a searched regulon are shown for all cell subpopulations in each disease state of each tissue based on the regulon specific score inferred using pySCENIC and by calculating the average expression. |
| Page: 1 |
Top |
Somatic mutation of malignant transformation related genes |
| Annotation of somatic variants for genes involved in malignant transformation |
| Hugo Symbol | Variant Class | Variant Classification | dbSNP RS | HGVSc | HGVSp | HGVSp Short | SWISSPROT | BIOTYPE | SIFT | PolyPhen | Tumor Sample Barcode | Tissue | Histology | Sex | Age | Stage | Therapy Types | Drugs | Outcome |
| GOLIM4 | SNV | Missense_Mutation | rs528758552 | c.1432N>T | p.Arg478Trp | p.R478W | O00461 | protein_coding | deleterious(0) | benign(0.024) | TCGA-A2-A0YE-01 | Breast | breast invasive carcinoma | Female | <65 | I/II | Unspecific | Taxotere | SD |
| GOLIM4 | SNV | Missense_Mutation | novel | c.855N>G | p.Asn285Lys | p.N285K | O00461 | protein_coding | tolerated(0.13) | benign(0.022) | TCGA-AN-A046-01 | Breast | breast invasive carcinoma | Female | >=65 | I/II | Unknown | Unknown | SD |
| GOLIM4 | SNV | Missense_Mutation | c.1402N>A | p.Glu468Lys | p.E468K | O00461 | protein_coding | tolerated(0.05) | benign(0.019) | TCGA-BH-A0HF-01 | Breast | breast invasive carcinoma | Female | >=65 | I/II | Hormone Therapy | arimidex | SD | |
| GOLIM4 | SNV | Missense_Mutation | c.1867G>C | p.Glu623Gln | p.E623Q | O00461 | protein_coding | tolerated(0.06) | probably_damaging(0.917) | TCGA-C8-A26Y-01 | Breast | breast invasive carcinoma | Female | >=65 | I/II | Unknown | Unknown | SD | |
| GOLIM4 | SNV | Missense_Mutation | c.543G>C | p.Glu181Asp | p.E181D | O00461 | protein_coding | deleterious(0.03) | probably_damaging(0.995) | TCGA-C8-A26Y-01 | Breast | breast invasive carcinoma | Female | >=65 | I/II | Unknown | Unknown | SD | |
| GOLIM4 | SNV | Missense_Mutation | c.933N>C | p.Glu311Asp | p.E311D | O00461 | protein_coding | tolerated(0.21) | benign(0.006) | TCGA-E9-A1ND-01 | Breast | breast invasive carcinoma | Female | >=65 | I/II | Hormone Therapy | aromasin | SD | |
| GOLIM4 | insertion | Frame_Shift_Ins | novel | c.458_459insACTTGTAGTGA | p.His153GlnfsTer23 | p.H153Qfs*23 | O00461 | protein_coding | TCGA-A2-A04Y-01 | Breast | breast invasive carcinoma | Female | <65 | I/II | Chemotherapy | cytoxan | SD | ||
| GOLIM4 | deletion | In_Frame_Del | novel | c.1453_1467delNNNNNNNNNNNNNNN | p.Ala485_Asp489del | p.A485_D489del | O00461 | protein_coding | TCGA-A7-A6VY-01 | Breast | breast invasive carcinoma | Female | <65 | I/II | Chemotherapy | cyclophosphamide | CR | ||
| GOLIM4 | insertion | Frame_Shift_Ins | novel | c.653_654insGAAGAGTCAACAGAGAAGGAAAAACAAG | p.Asp219LysfsTer26 | p.D219Kfs*26 | O00461 | protein_coding | TCGA-AR-A0TY-01 | Breast | breast invasive carcinoma | Female | <65 | I/II | Unspecific | Paclitaxel | PD | ||
| GOLIM4 | SNV | Missense_Mutation | rs773791480 | c.419G>A | p.Arg140His | p.R140H | O00461 | protein_coding | deleterious(0.03) | probably_damaging(0.999) | TCGA-2W-A8YY-01 | Cervix | cervical & endocervical cancer | Female | <65 | I/II | Chemotherapy | cisplatin | CR |
| Page: 1 2 3 4 5 6 7 8 9 |
Top |
Related drugs of malignant transformation related genes |
| Identification of chemicals and drugs interact with genes involved in malignant transfromation |
| (DGIdb 4.0) |
| Entrez ID | Symbol | Category | Interaction Types | Drug Claim Name | Drug Name | PMIDs |
| Page: 1 |

Copyright 2023-Present -The University of Texas Health Science Center at Houston |