| Tissue | Expression Dynamics | Abbreviation |
| Breast | 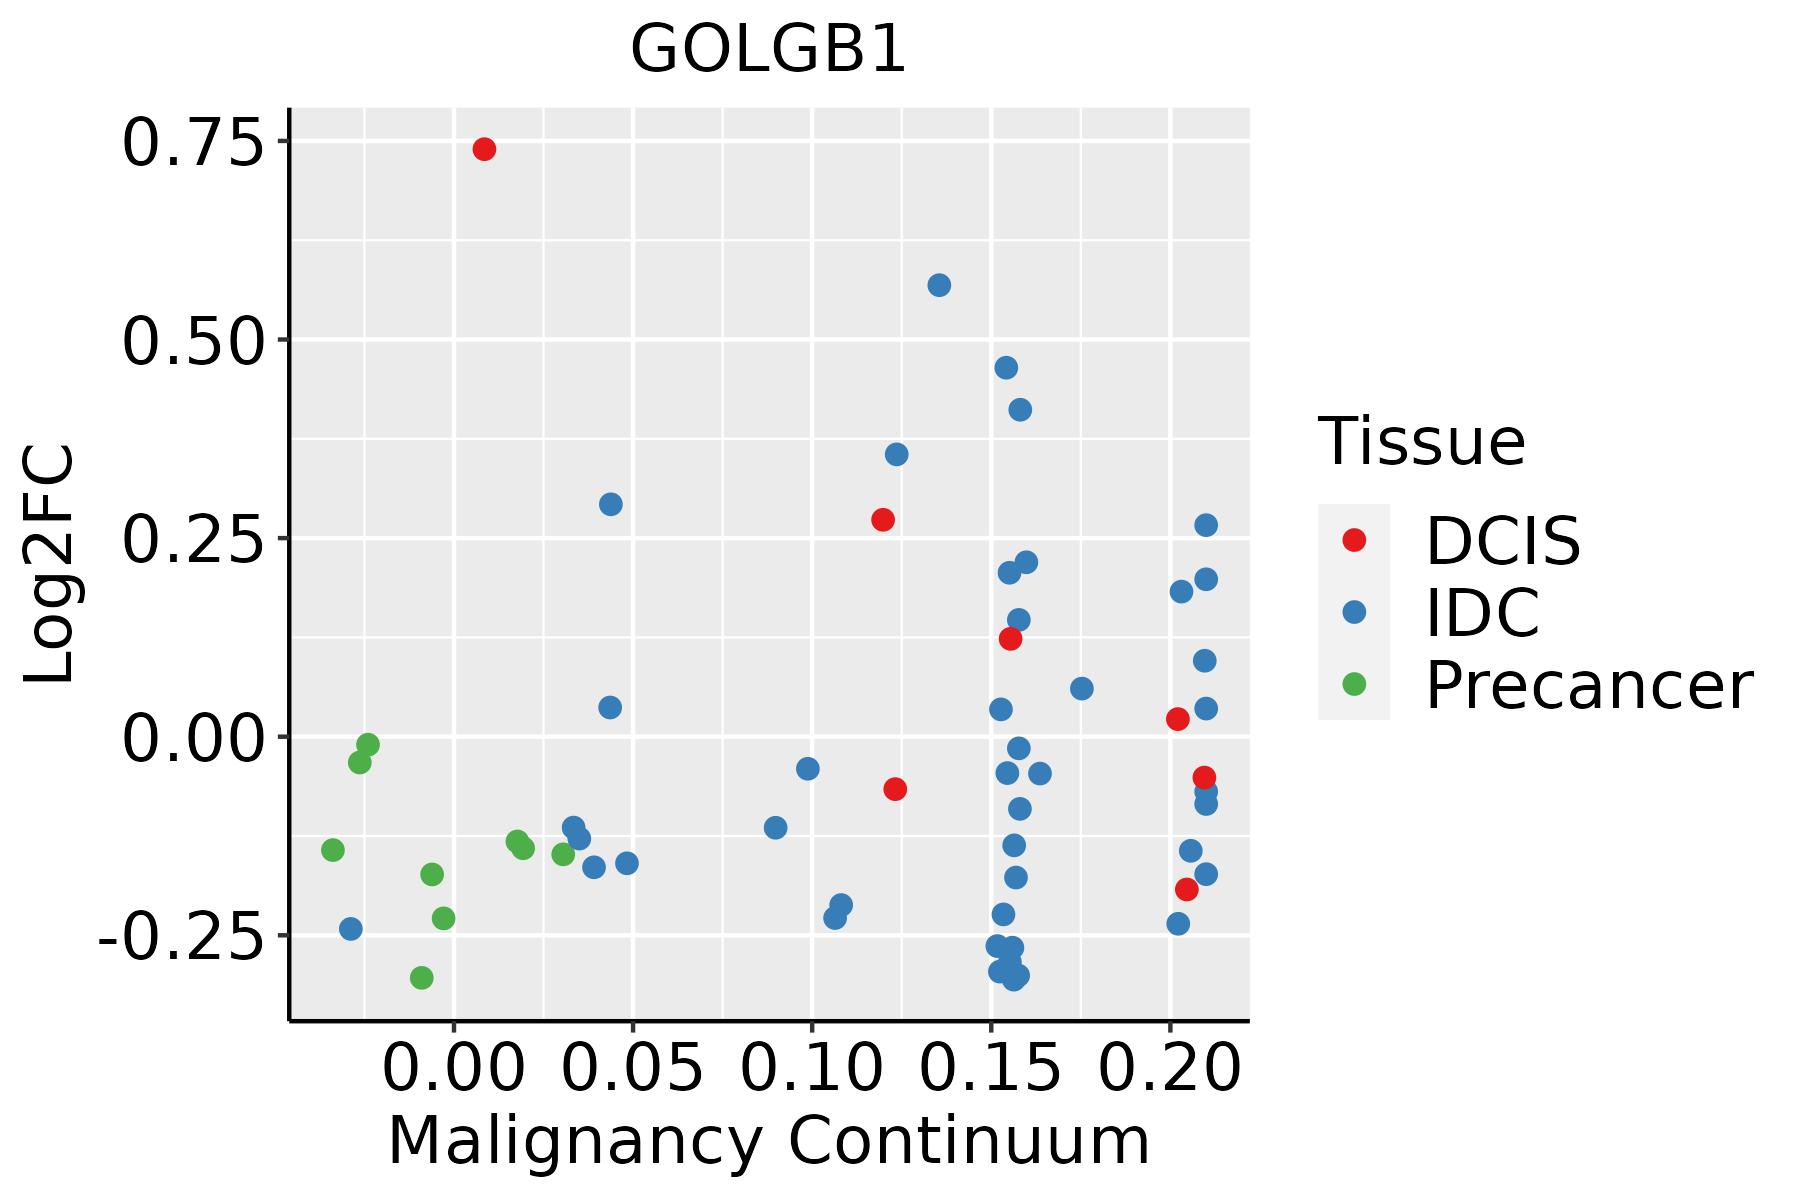 | IDC: Invasive ductal carcinoma |
| DCIS: Ductal carcinoma in situ |
| Precancer(BRCA1-mut): Precancerous lesion from BRCA1 mutation carriers |
| Cervix | 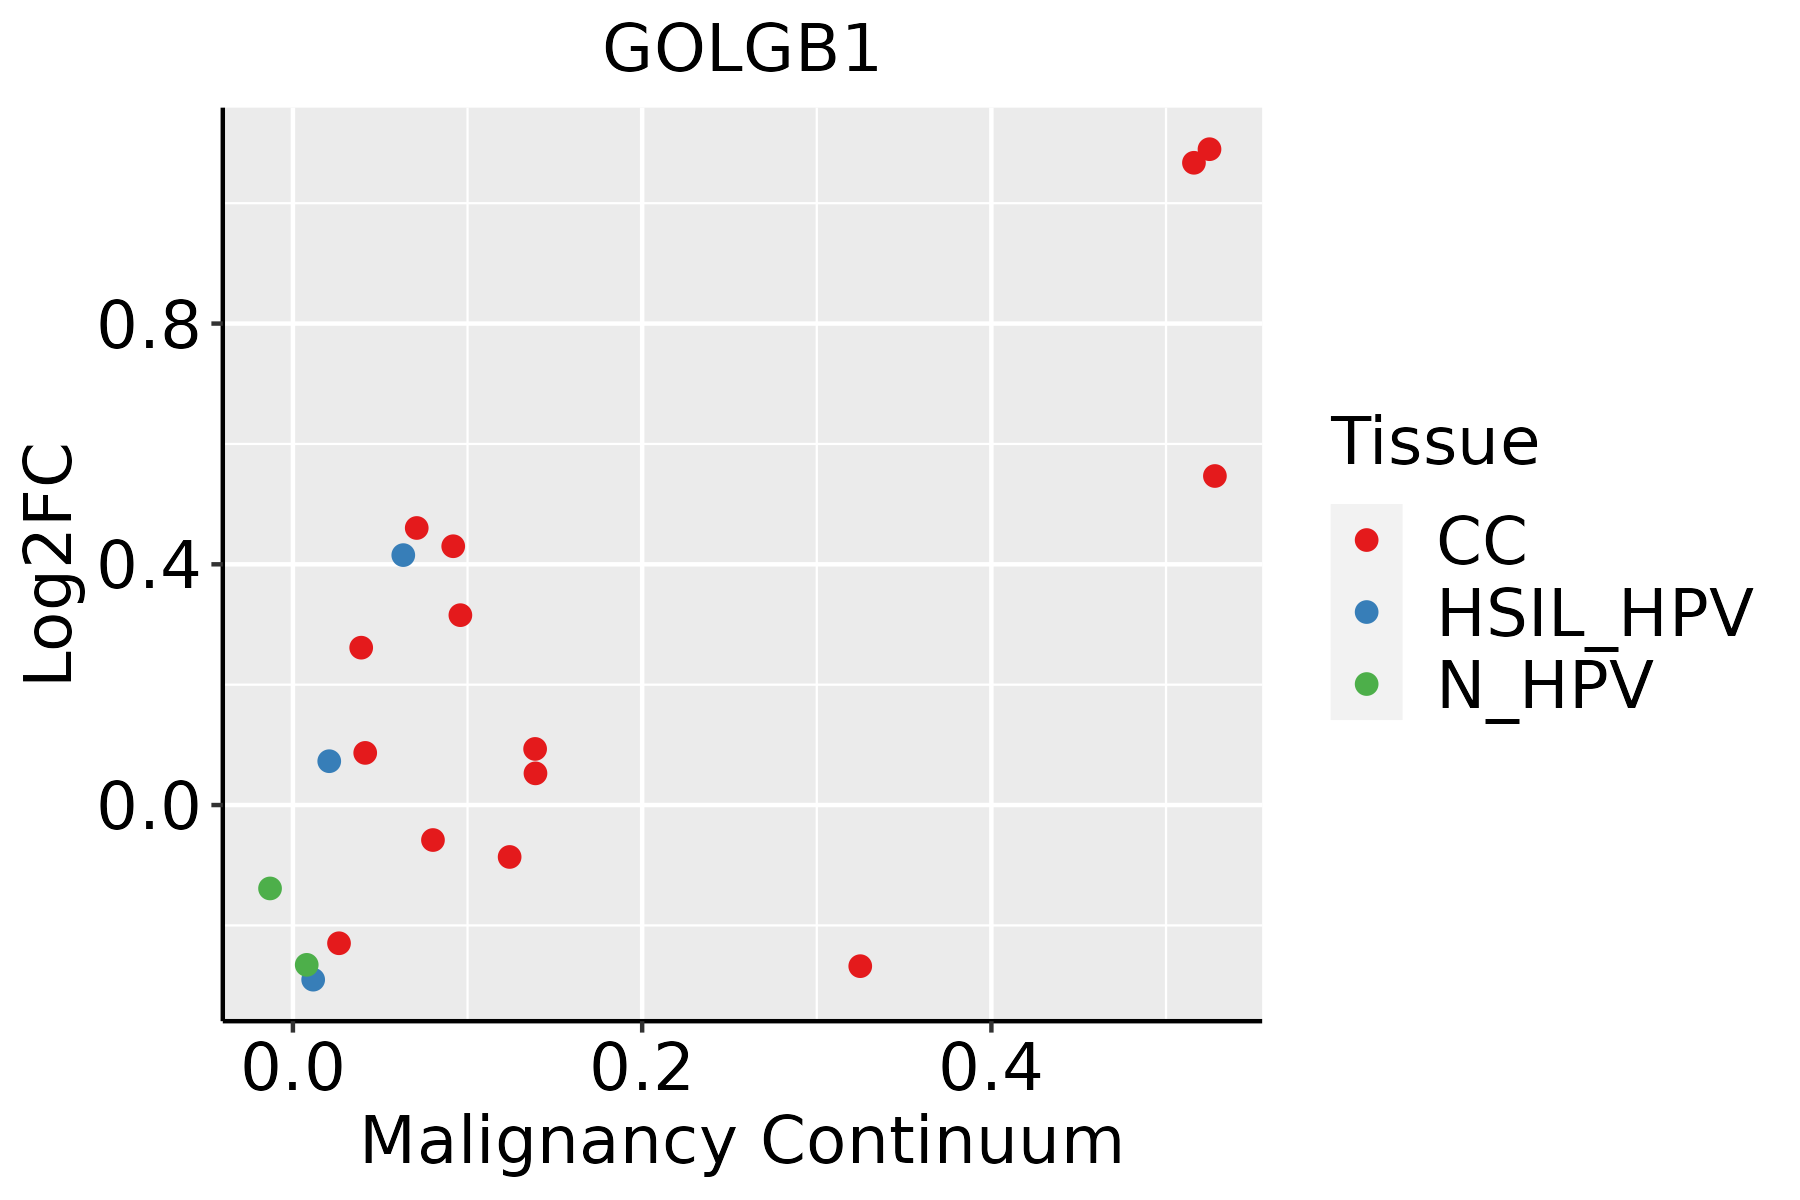 | CC: Cervix cancer |
| HSIL_HPV: HPV-infected high-grade squamous intraepithelial lesions |
| N_HPV: HPV-infected normal cervix |
| Colorectum (GSE201348) |  | FAP: Familial adenomatous polyposis |
| CRC: Colorectal cancer |
| Colorectum (HTA11) |  | AD: Adenomas |
| SER: Sessile serrated lesions |
| MSI-H: Microsatellite-high colorectal cancer |
| MSS: Microsatellite stable colorectal cancer |
| Endometrium | 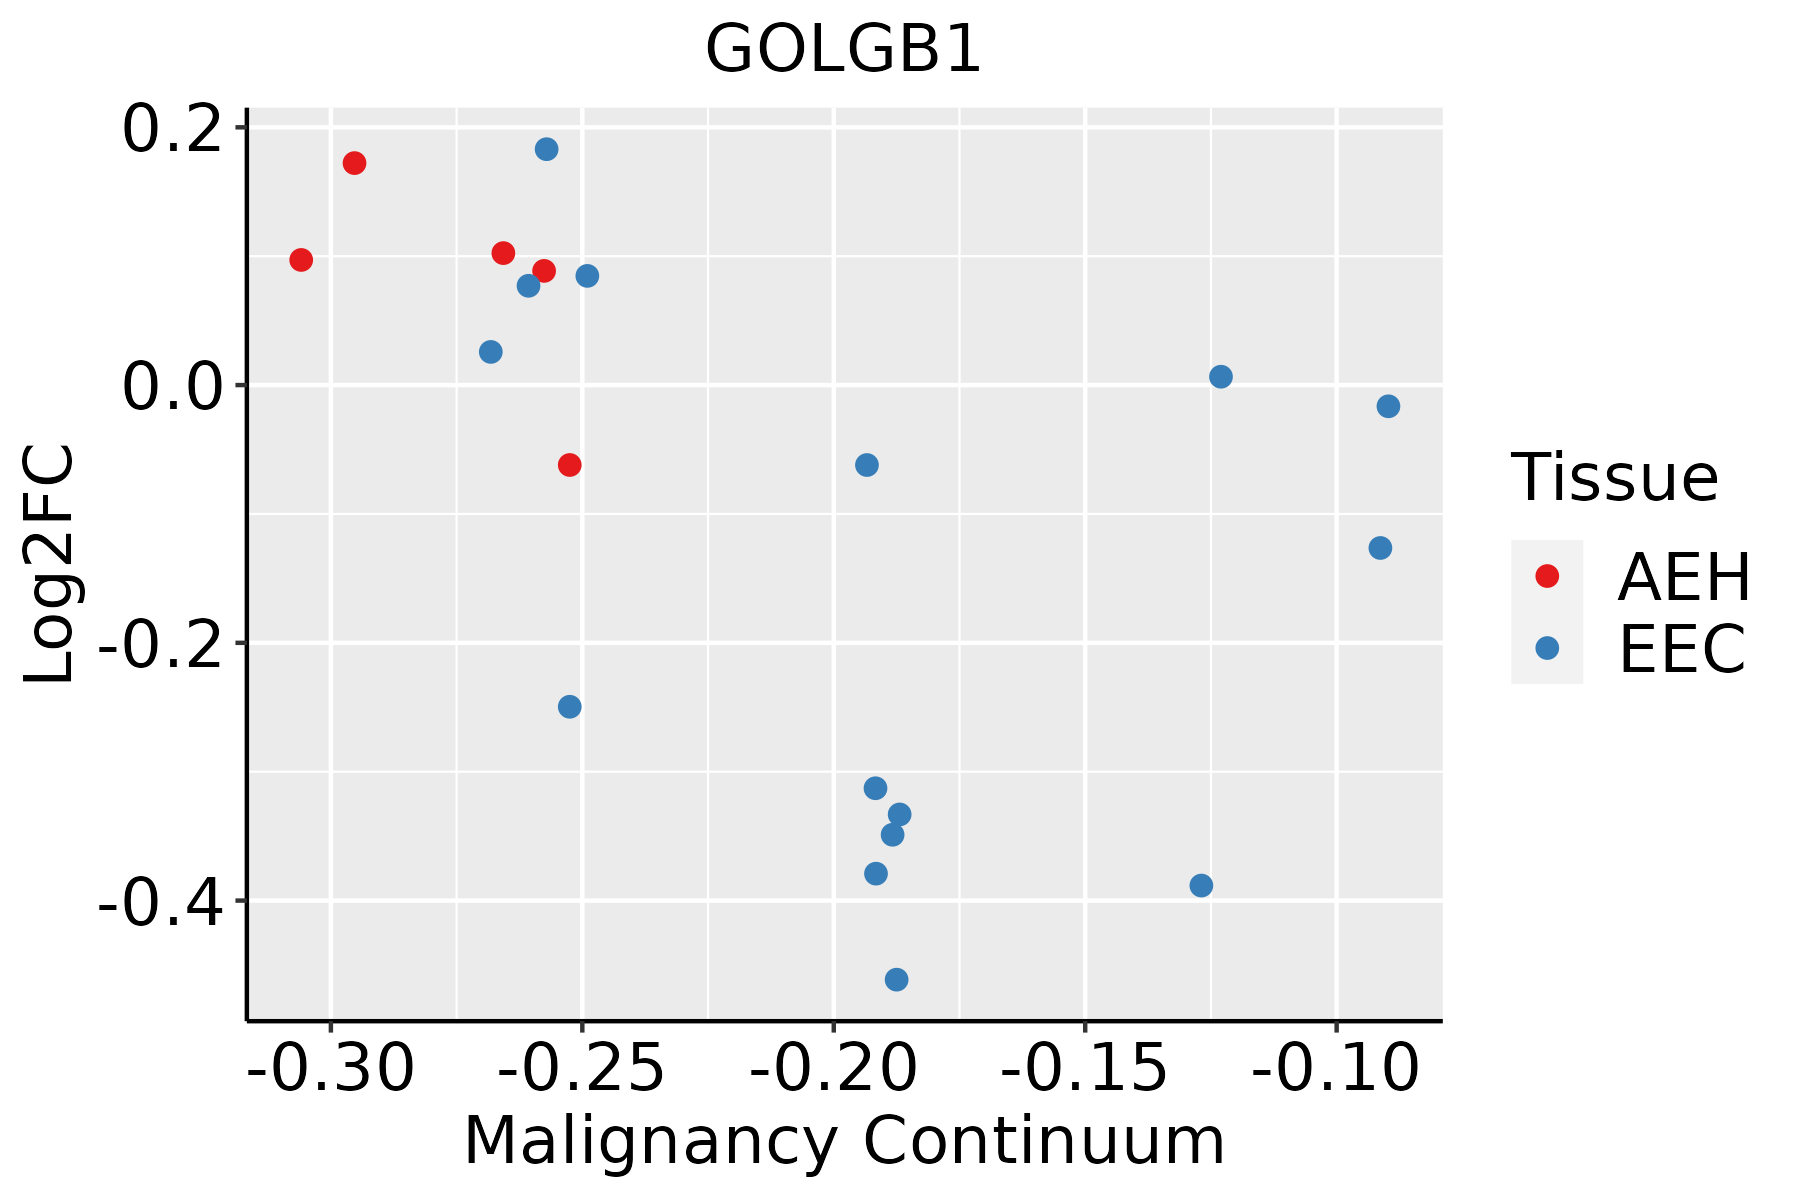 | AEH: Atypical endometrial hyperplasia |
| EEC: Endometrioid Cancer |
| Esophagus |  | ESCC: Esophageal squamous cell carcinoma |
| HGIN: High-grade intraepithelial neoplasias |
| LGIN: Low-grade intraepithelial neoplasias |
| Liver | 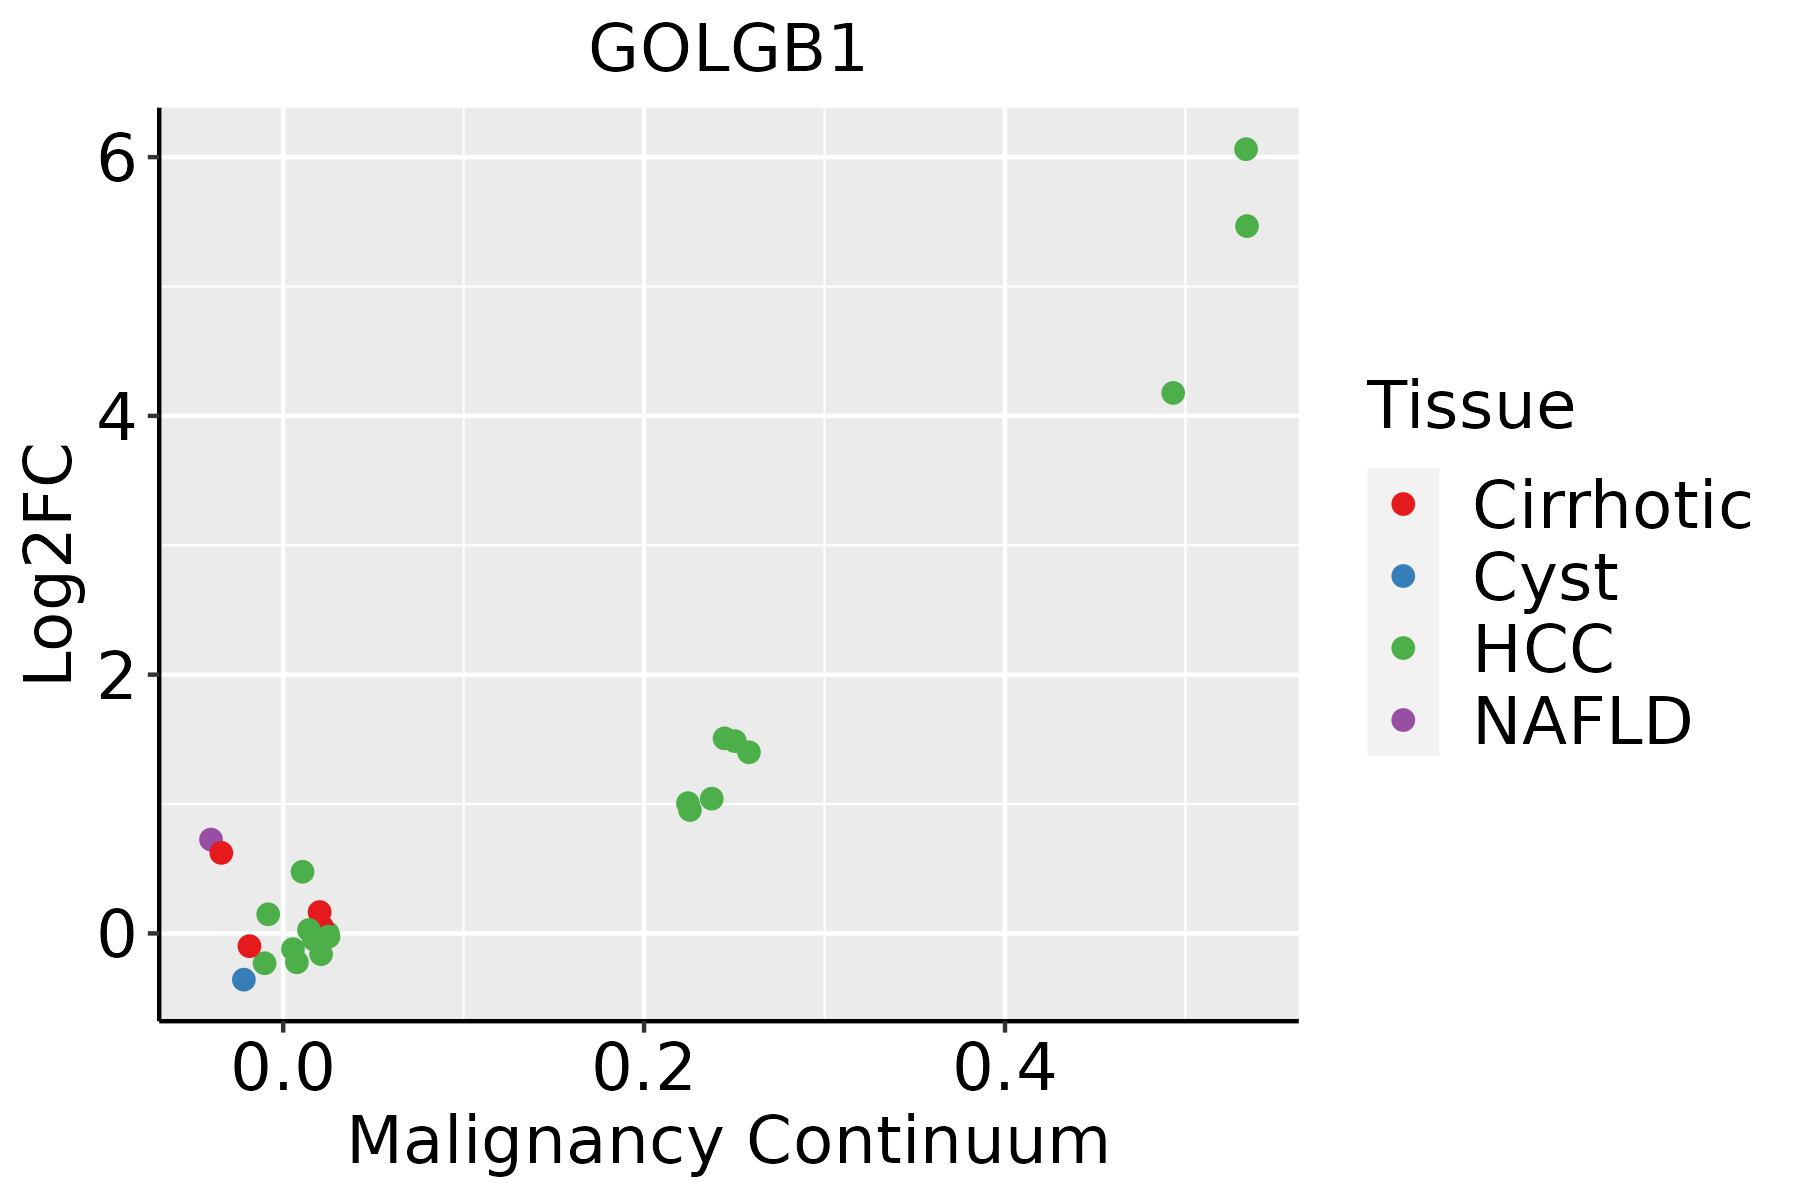 | HCC: Hepatocellular carcinoma |
| NAFLD: Non-alcoholic fatty liver disease |
| Lung | 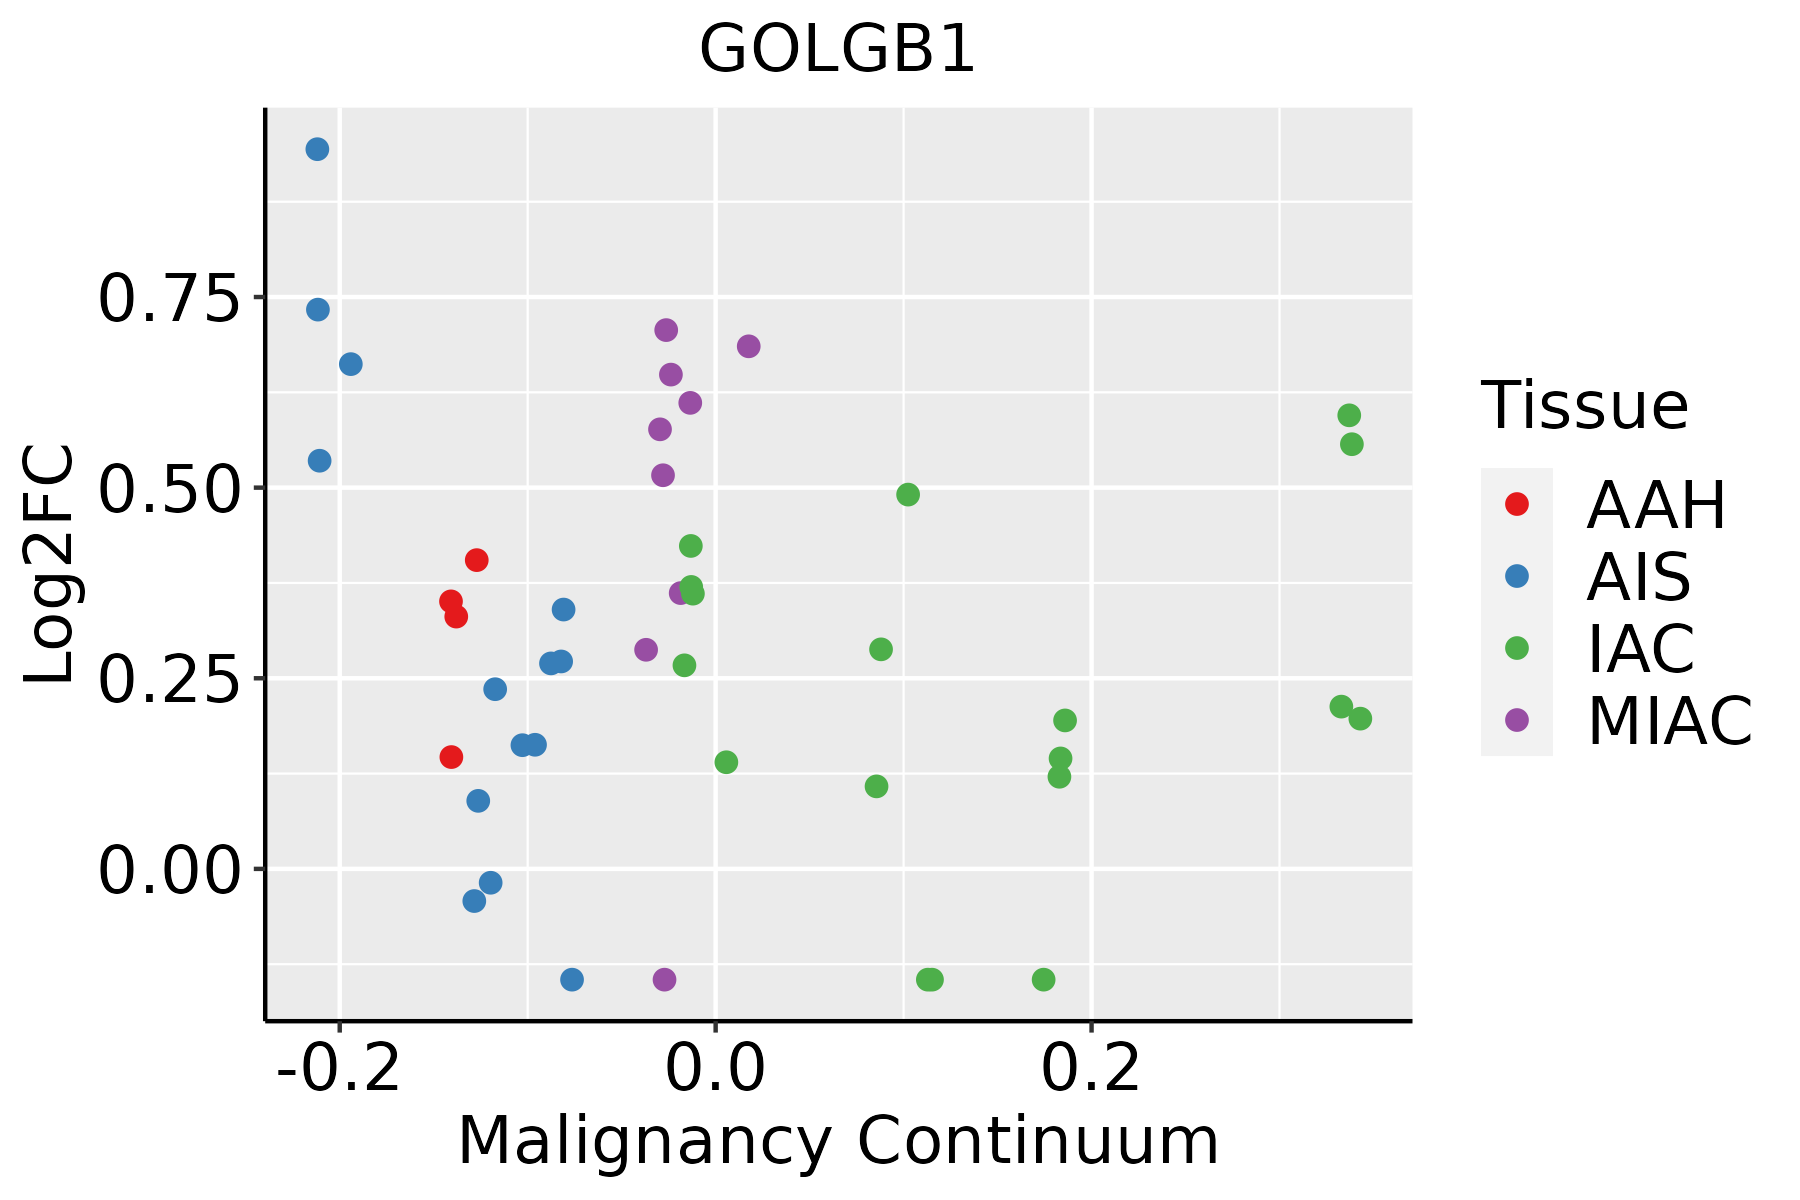 | AAH: Atypical adenomatous hyperplasia |
| AIS: Adenocarcinoma in situ |
| IAC: Invasive lung adenocarcinoma |
| MIA: Minimally invasive adenocarcinoma |
| Oral Cavity | 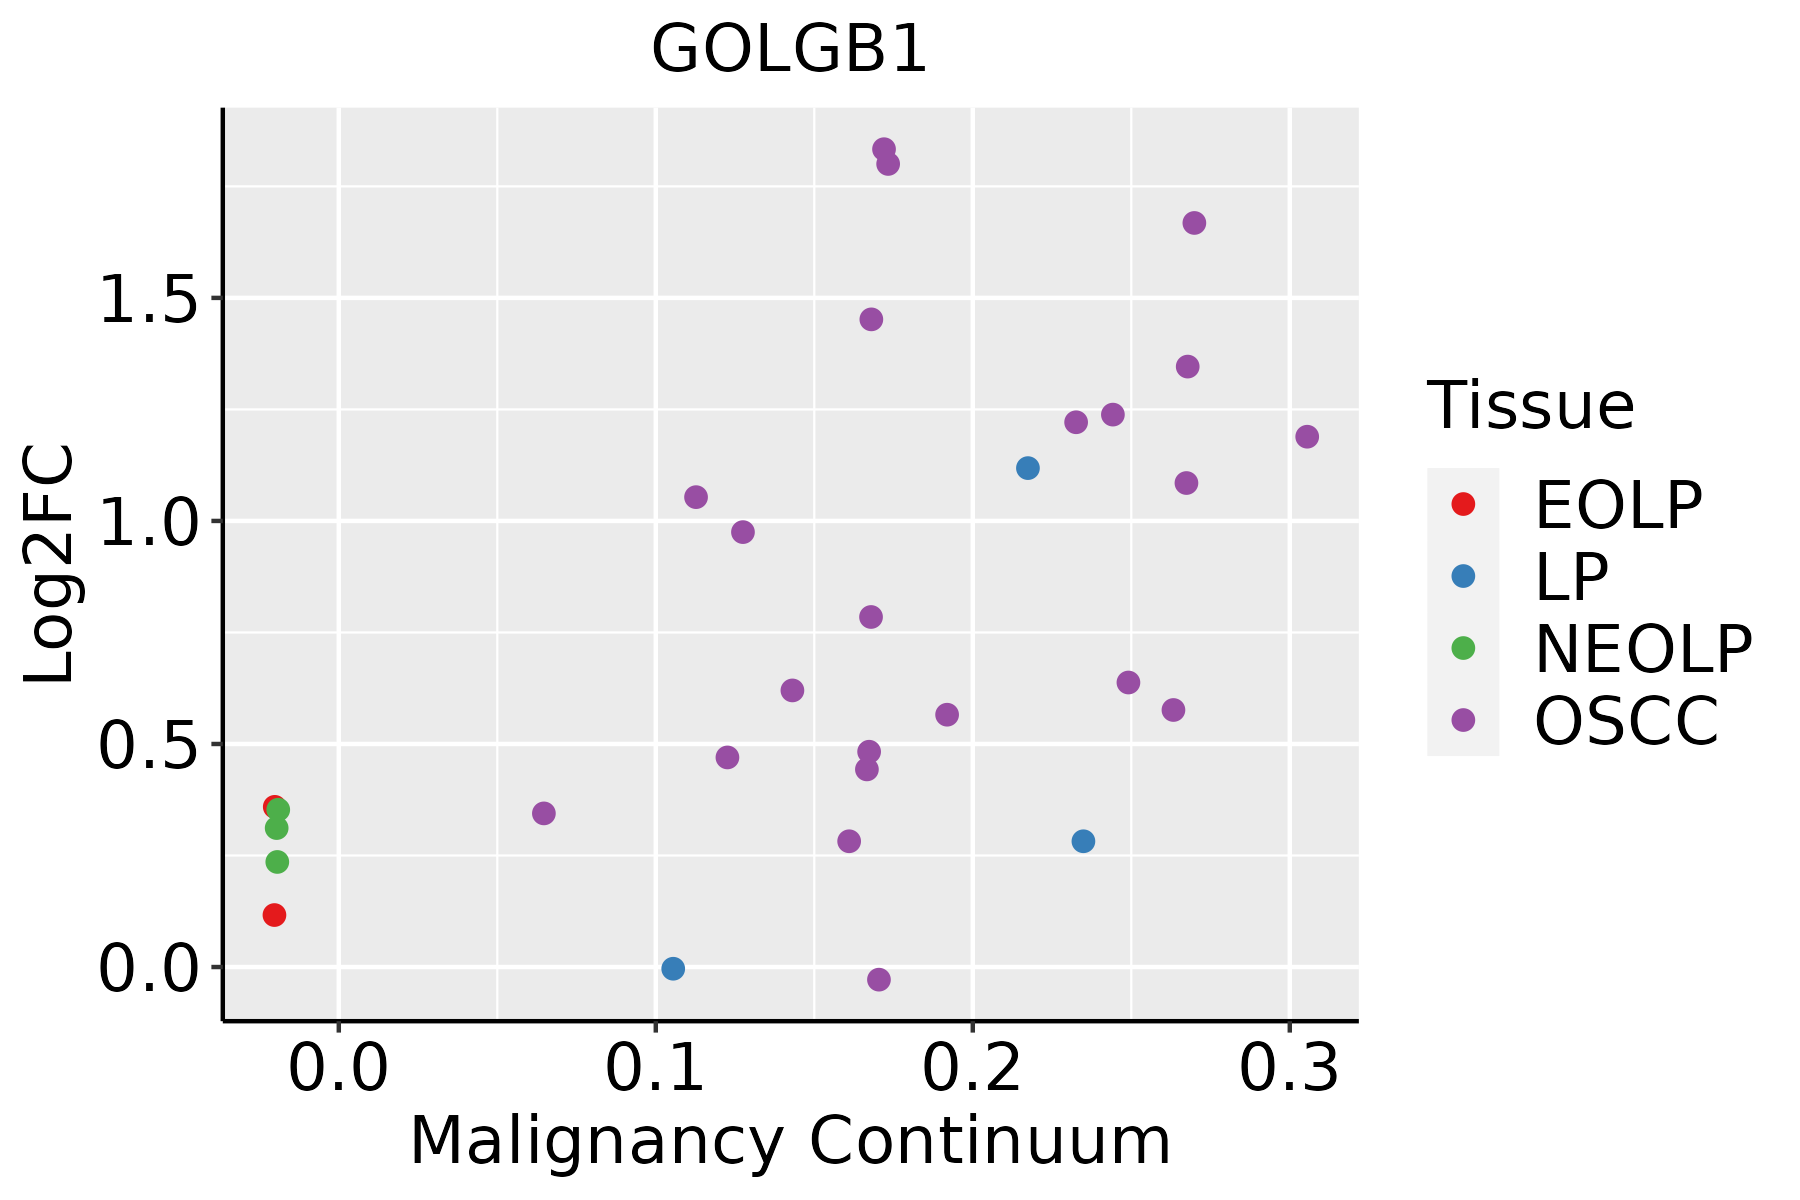 | EOLP: Erosive Oral lichen planus |
| LP: leukoplakia |
| NEOLP: Non-erosive oral lichen planus |
| OSCC: Oral squamous cell carcinoma |
| Prostate | 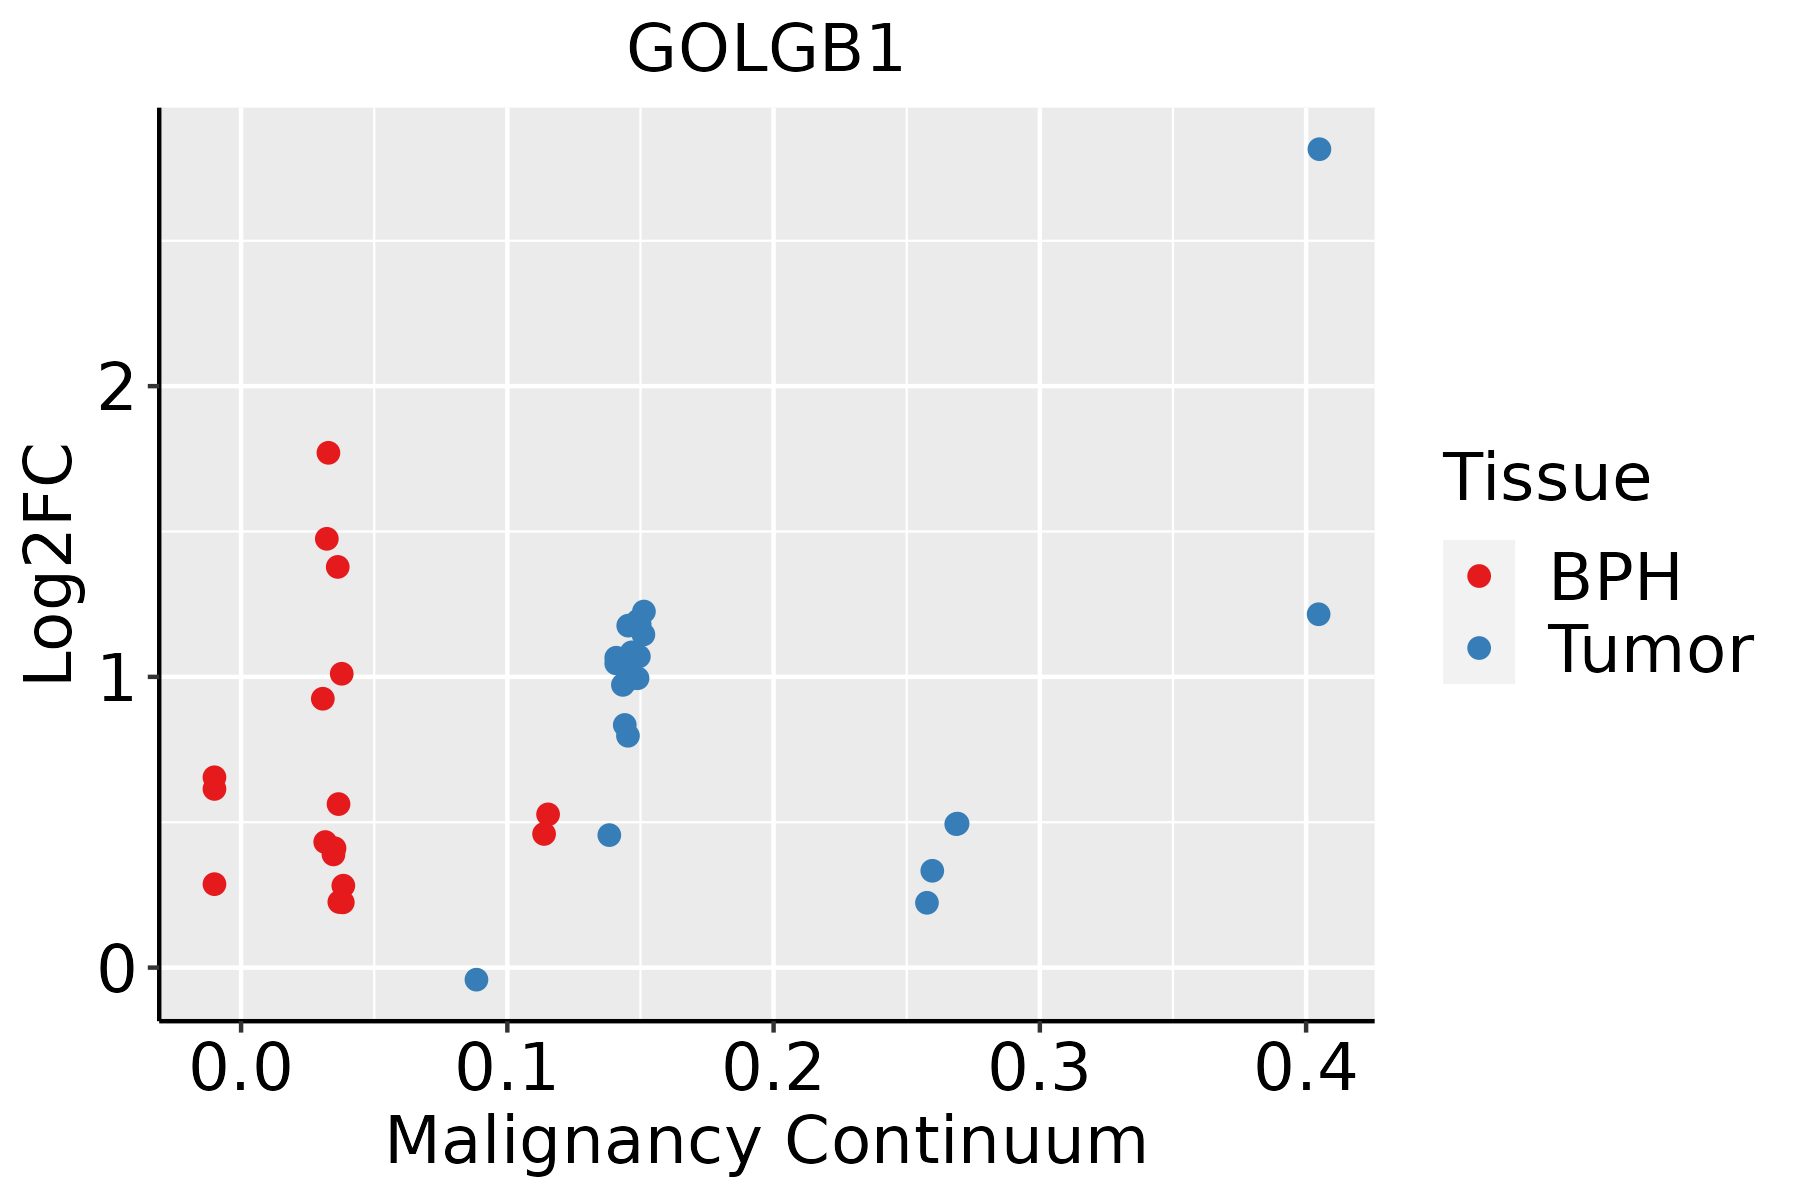 | BPH: Benign Prostatic Hyperplasia |
| Skin | 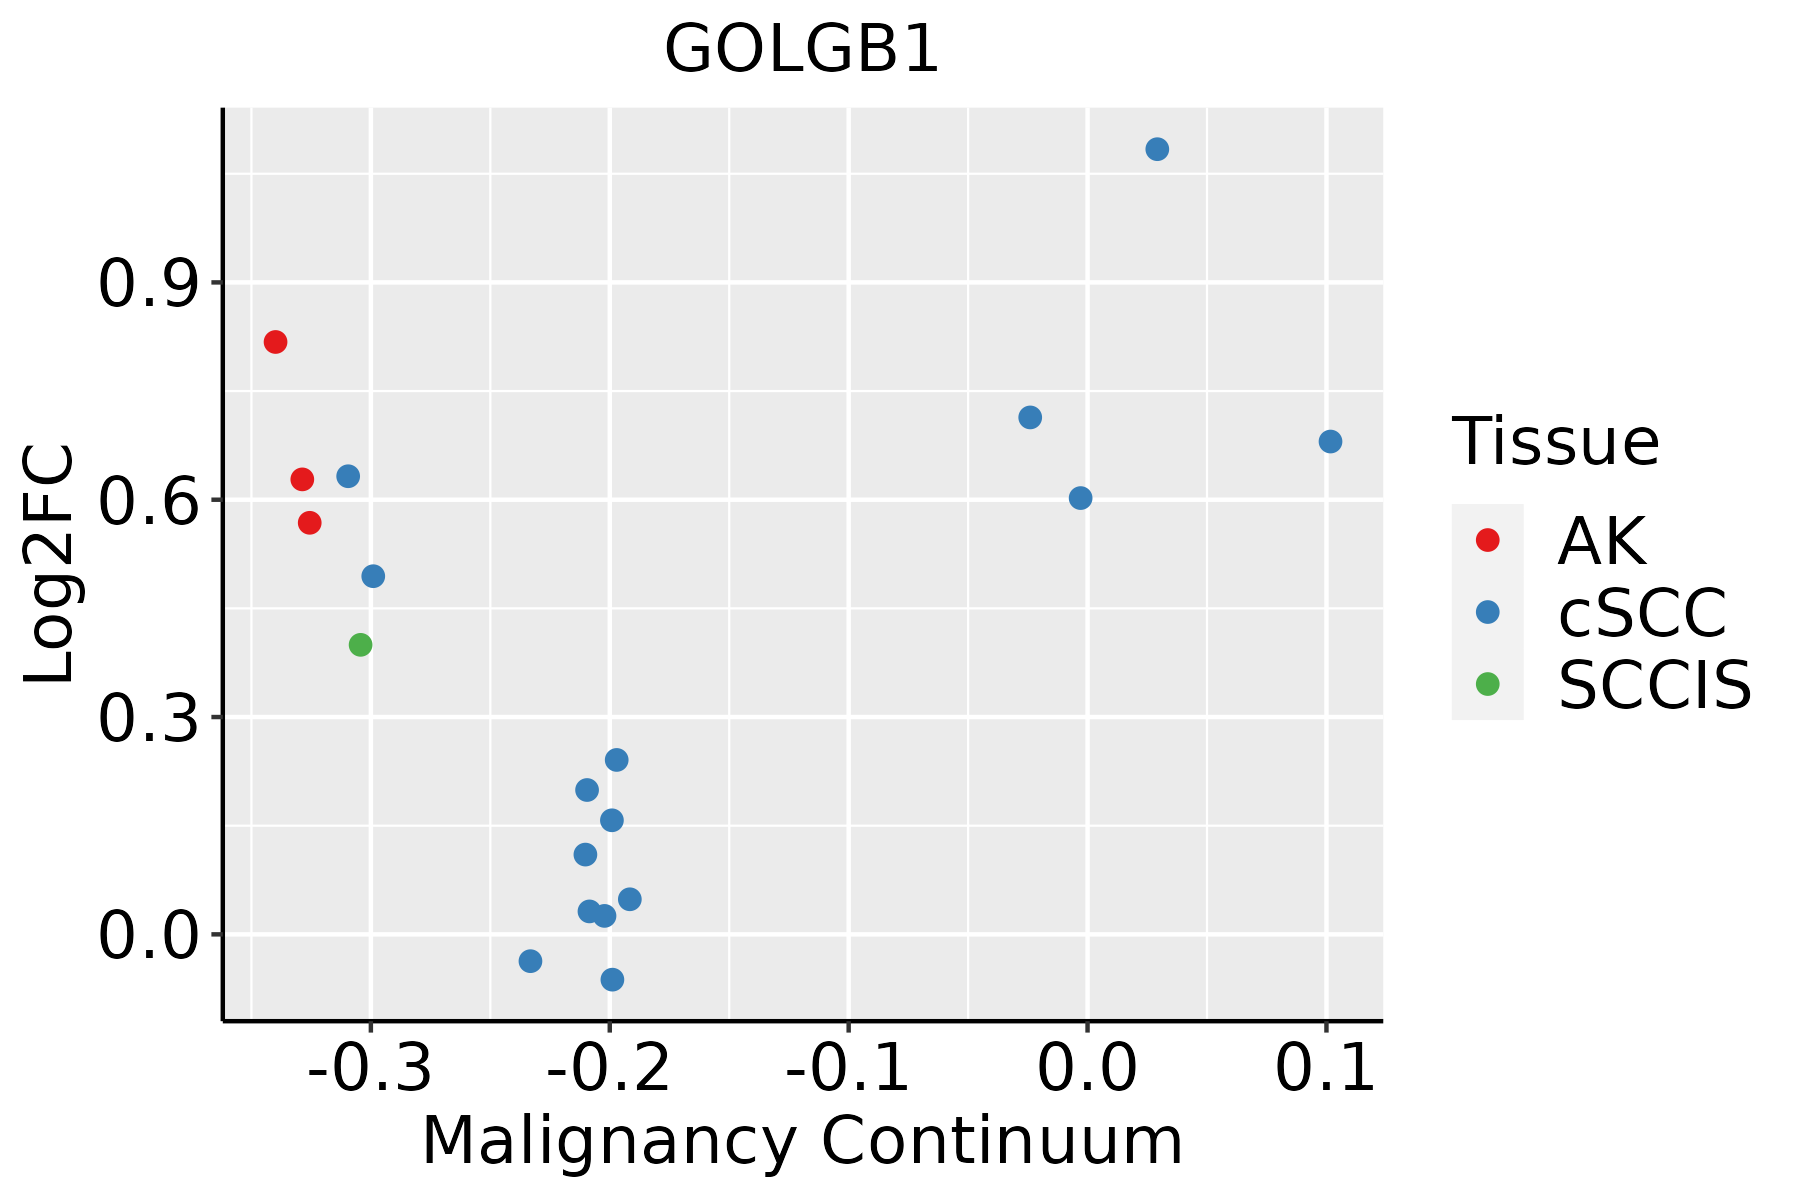 | AK: Actinic keratosis |
| cSCC: Cutaneous squamous cell carcinoma |
| SCCIS:squamous cell carcinoma in situ |
| Thyroid | 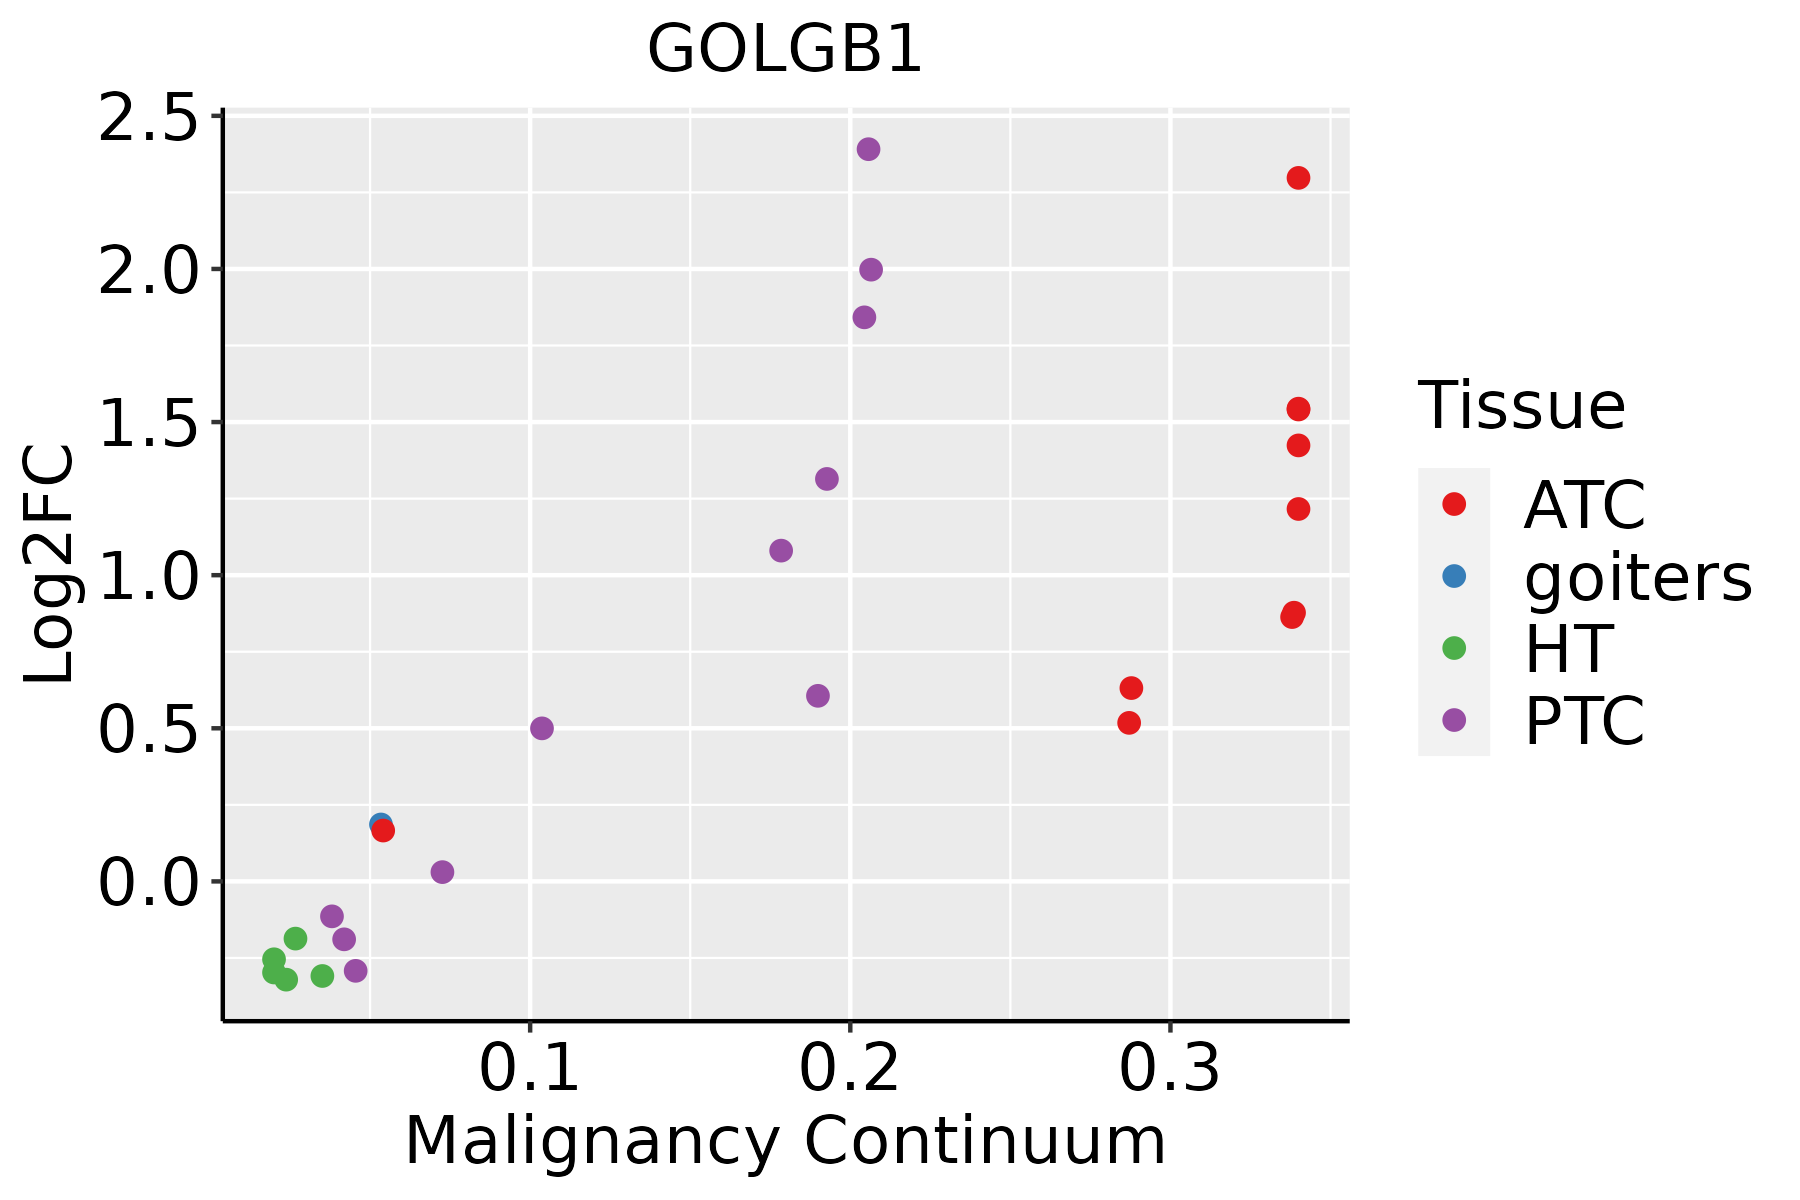 | ATC: Anaplastic thyroid cancer |
| HT: Hashimoto's thyroiditis |
| PTC: Papillary thyroid cancer |
| GO ID | Tissue | Disease Stage | Description | Gene Ratio | Bg Ratio | pvalue | p.adjust | Count |
| GO:00070304 | Cervix | CC | Golgi organization | 32/2311 | 157/18723 | 2.78e-03 | 1.87e-02 | 32 |
| GO:0071539 | Colorectum | AD | protein localization to centrosome | 16/3918 | 33/18723 | 3.86e-04 | 4.41e-03 | 16 |
| GO:1905508 | Colorectum | AD | protein localization to microtubule organizing center | 16/3918 | 35/18723 | 8.76e-04 | 8.51e-03 | 16 |
| GO:00715391 | Colorectum | MSS | protein localization to centrosome | 16/3467 | 33/18723 | 8.66e-05 | 1.40e-03 | 16 |
| GO:19055081 | Colorectum | MSS | protein localization to microtubule organizing center | 16/3467 | 35/18723 | 2.07e-04 | 2.89e-03 | 16 |
| GO:0044380 | Colorectum | MSS | protein localization to cytoskeleton | 19/3467 | 58/18723 | 6.69e-03 | 4.38e-02 | 19 |
| GO:0072698 | Colorectum | MSS | protein localization to microtubule cytoskeleton | 18/3467 | 54/18723 | 6.70e-03 | 4.38e-02 | 18 |
| GO:00715392 | Colorectum | FAP | protein localization to centrosome | 14/2622 | 33/18723 | 6.39e-05 | 1.23e-03 | 14 |
| GO:19055082 | Colorectum | FAP | protein localization to microtubule organizing center | 14/2622 | 35/18723 | 1.38e-04 | 2.18e-03 | 14 |
| GO:00726981 | Colorectum | FAP | protein localization to microtubule cytoskeleton | 16/2622 | 54/18723 | 2.26e-03 | 1.84e-02 | 16 |
| GO:00443801 | Colorectum | FAP | protein localization to cytoskeleton | 16/2622 | 58/18723 | 4.97e-03 | 3.32e-02 | 16 |
| GO:00715393 | Colorectum | CRC | protein localization to centrosome | 11/2078 | 33/18723 | 5.80e-04 | 7.89e-03 | 11 |
| GO:19055083 | Colorectum | CRC | protein localization to microtubule organizing center | 11/2078 | 35/18723 | 1.02e-03 | 1.20e-02 | 11 |
| GO:00726982 | Colorectum | CRC | protein localization to microtubule cytoskeleton | 13/2078 | 54/18723 | 5.25e-03 | 3.98e-02 | 13 |
| GO:00070305 | Endometrium | AEH | Golgi organization | 32/2100 | 157/18723 | 5.73e-04 | 5.69e-03 | 32 |
| GO:000703012 | Endometrium | EEC | Golgi organization | 32/2168 | 157/18723 | 9.87e-04 | 8.76e-03 | 32 |
| GO:00726985 | Esophagus | ESCC | protein localization to microtubule cytoskeleton | 43/8552 | 54/18723 | 3.28e-07 | 4.61e-06 | 43 |
| GO:00443804 | Esophagus | ESCC | protein localization to cytoskeleton | 45/8552 | 58/18723 | 6.89e-07 | 8.99e-06 | 45 |
| GO:00070308 | Esophagus | ESCC | Golgi organization | 101/8552 | 157/18723 | 1.78e-06 | 2.10e-05 | 101 |
| GO:19055086 | Esophagus | ESCC | protein localization to microtubule organizing center | 28/8552 | 35/18723 | 3.40e-05 | 2.78e-04 | 28 |
| Hugo Symbol | Variant Class | Variant Classification | dbSNP RS | HGVSc | HGVSp | HGVSp Short | SWISSPROT | BIOTYPE | SIFT | PolyPhen | Tumor Sample Barcode | Tissue | Histology | Sex | Age | Stage | Therapy Types | Drugs | Outcome |
| GOLGB1 | SNV | Missense_Mutation | rs761066625 | c.4366G>A | p.Asp1456Asn | p.D1456N | Q14789 | protein_coding | deleterious(0.03) | benign(0.001) | TCGA-5L-AAT1-01 | Breast | breast invasive carcinoma | Female | <65 | III/IV | Hormone Therapy | letrozol | SD |
| GOLGB1 | SNV | Missense_Mutation | | c.4128N>T | p.Gln1376His | p.Q1376H | Q14789 | protein_coding | deleterious(0.02) | benign(0.179) | TCGA-A2-A0CV-01 | Breast | breast invasive carcinoma | Female | <65 | I/II | Chemotherapy | cytoxan | SD |
| GOLGB1 | SNV | Missense_Mutation | | c.6727N>A | p.Asp2243Asn | p.D2243N | Q14789 | protein_coding | tolerated(0.07) | benign(0.368) | TCGA-A8-A08B-01 | Breast | breast invasive carcinoma | Female | <65 | I/II | Chemotherapy | 5-fluorouracil | CR |
| GOLGB1 | SNV | Missense_Mutation | rs762656767 | c.4117N>A | p.Glu1373Lys | p.E1373K | Q14789 | protein_coding | tolerated(0.14) | benign(0.028) | TCGA-A8-A0A1-01 | Breast | breast invasive carcinoma | Female | >=65 | I/II | Hormone Therapy | tamoxiphen | SD |
| GOLGB1 | SNV | Missense_Mutation | | c.7588N>C | p.Glu2530Gln | p.E2530Q | Q14789 | protein_coding | tolerated(0.06) | probably_damaging(0.997) | TCGA-AC-A23C-01 | Breast | breast invasive carcinoma | Female | <65 | I/II | Chemotherapy | chemo | CR |
| GOLGB1 | SNV | Missense_Mutation | | c.7567N>T | p.His2523Tyr | p.H2523Y | Q14789 | protein_coding | deleterious(0.01) | benign(0.439) | TCGA-AC-A23H-01 | Breast | breast invasive carcinoma | Female | >=65 | I/II | Unknown | Unknown | PD |
| GOLGB1 | SNV | Missense_Mutation | | c.3712N>G | p.Leu1238Val | p.L1238V | Q14789 | protein_coding | deleterious(0) | benign(0.25) | TCGA-AC-A23H-01 | Breast | breast invasive carcinoma | Female | >=65 | I/II | Unknown | Unknown | PD |
| GOLGB1 | SNV | Missense_Mutation | | c.1717N>C | p.Glu573Gln | p.E573Q | Q14789 | protein_coding | tolerated(0.09) | probably_damaging(0.997) | TCGA-AC-A23H-01 | Breast | breast invasive carcinoma | Female | >=65 | I/II | Unknown | Unknown | PD |
| GOLGB1 | SNV | Missense_Mutation | novel | c.7803N>T | p.Glu2601Asp | p.E2601D | Q14789 | protein_coding | tolerated(0.79) | benign(0.024) | TCGA-AN-A046-01 | Breast | breast invasive carcinoma | Female | >=65 | I/II | Unknown | Unknown | SD |
| GOLGB1 | SNV | Missense_Mutation | novel | c.5892N>T | p.Lys1964Asn | p.K1964N | Q14789 | protein_coding | deleterious(0) | benign(0.036) | TCGA-AN-A046-01 | Breast | breast invasive carcinoma | Female | >=65 | I/II | Unknown | Unknown | SD |


