
|
|||||
|
 | |
| |
| |
| |
| |
| |
|
Gene: GOLGA8B |
Gene summary for GOLGA8B |
| Gene information | Species | Human | Gene symbol | GOLGA8B | Gene ID | 440270 |
| Gene name | golgin A8 family member B | |
| Gene Alias | GOLGA5 | |
| Cytomap | 15q14 | |
| Gene Type | protein-coding | GO ID | GO:0000226 | UniProtAcc | A8MQT2 |
Top |
Malignant transformation analysis |
| Identification of the aberrant gene expression in precancerous and cancerous lesions by comparing the gene expression of stem-like cells in diseased tissues with normal stem cells |
| Entrez ID | Symbol | Replicates | Species | Organ | Tissue | Adj P-value | Log2FC | Malignancy |
| 440270 | GOLGA8B | AEH-subject1 | Human | Endometrium | AEH | 4.04e-08 | -3.55e-01 | -0.3059 |
| 440270 | GOLGA8B | AEH-subject2 | Human | Endometrium | AEH | 2.30e-05 | -2.97e-01 | -0.2525 |
| 440270 | GOLGA8B | AEH-subject3 | Human | Endometrium | AEH | 5.57e-10 | -3.29e-01 | -0.2576 |
| 440270 | GOLGA8B | AEH-subject4 | Human | Endometrium | AEH | 1.55e-03 | -2.97e-01 | -0.2657 |
| 440270 | GOLGA8B | AEH-subject5 | Human | Endometrium | AEH | 3.40e-24 | -4.82e-01 | -0.2953 |
| 440270 | GOLGA8B | EEC-subject1 | Human | Endometrium | EEC | 3.01e-25 | -4.67e-01 | -0.2682 |
| 440270 | GOLGA8B | EEC-subject3 | Human | Endometrium | EEC | 4.75e-19 | -4.13e-01 | -0.2525 |
| 440270 | GOLGA8B | EEC-subject4 | Human | Endometrium | EEC | 2.63e-10 | -3.38e-01 | -0.2571 |
| 440270 | GOLGA8B | EEC-subject5 | Human | Endometrium | EEC | 1.14e-09 | -3.57e-01 | -0.249 |
| 440270 | GOLGA8B | GSM5276934 | Human | Endometrium | EEC | 5.58e-21 | -4.66e-01 | -0.0913 |
| 440270 | GOLGA8B | GSM5276935 | Human | Endometrium | EEC | 3.10e-02 | -2.36e-01 | -0.123 |
| 440270 | GOLGA8B | GSM5276937 | Human | Endometrium | EEC | 7.91e-18 | -5.00e-01 | -0.0897 |
| 440270 | GOLGA8B | GSM6177620_NYU_UCEC1_lib1_lib1 | Human | Endometrium | EEC | 3.39e-18 | -4.04e-01 | -0.1869 |
| 440270 | GOLGA8B | GSM6177620_NYU_UCEC1_lib2_lib2 | Human | Endometrium | EEC | 2.15e-17 | -4.50e-01 | -0.1875 |
| 440270 | GOLGA8B | GSM6177620_NYU_UCEC1_lib3_lib3 | Human | Endometrium | EEC | 1.74e-19 | -3.88e-01 | -0.1883 |
| 440270 | GOLGA8B | GSM6177621_NYU_UCEC2_lib1_lib1 | Human | Endometrium | EEC | 5.18e-17 | -3.17e-01 | -0.1934 |
| 440270 | GOLGA8B | GSM6177622_NYU_UCEC3_lib1_lib1 | Human | Endometrium | EEC | 1.02e-31 | -5.42e-01 | -0.1917 |
| 440270 | GOLGA8B | GSM6177622_NYU_UCEC3_lib2_lib2 | Human | Endometrium | EEC | 2.06e-32 | -5.31e-01 | -0.1916 |
| 440270 | GOLGA8B | LZE4T | Human | Esophagus | ESCC | 7.96e-04 | 1.82e-02 | 0.0811 |
| 440270 | GOLGA8B | LZE7T | Human | Esophagus | ESCC | 2.45e-06 | 2.05e-01 | 0.0667 |
| Page: 1 2 3 4 5 6 |
| Tissue | Expression Dynamics | Abbreviation |
| Endometrium |  | AEH: Atypical endometrial hyperplasia |
| EEC: Endometrioid Cancer | ||
| Esophagus | 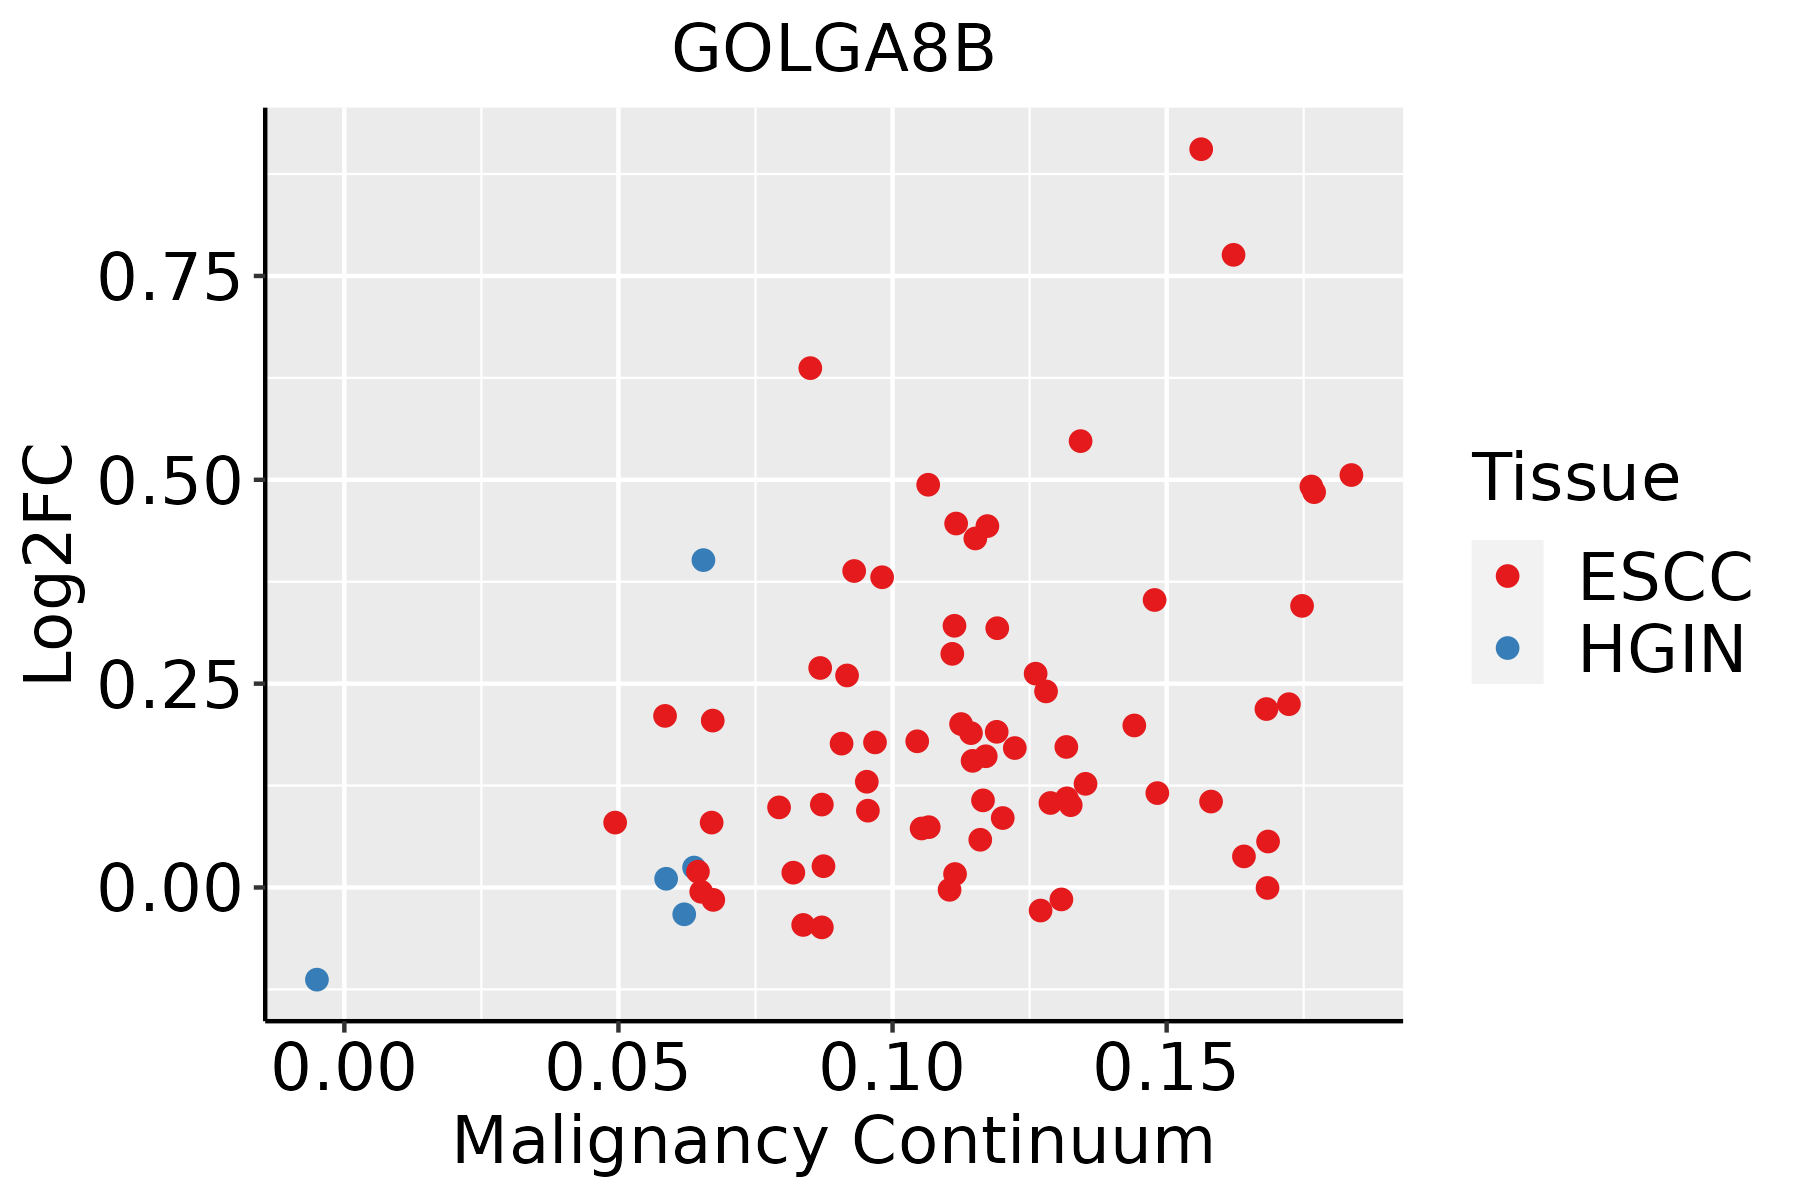 | ESCC: Esophageal squamous cell carcinoma |
| HGIN: High-grade intraepithelial neoplasias | ||
| LGIN: Low-grade intraepithelial neoplasias | ||
| Liver | 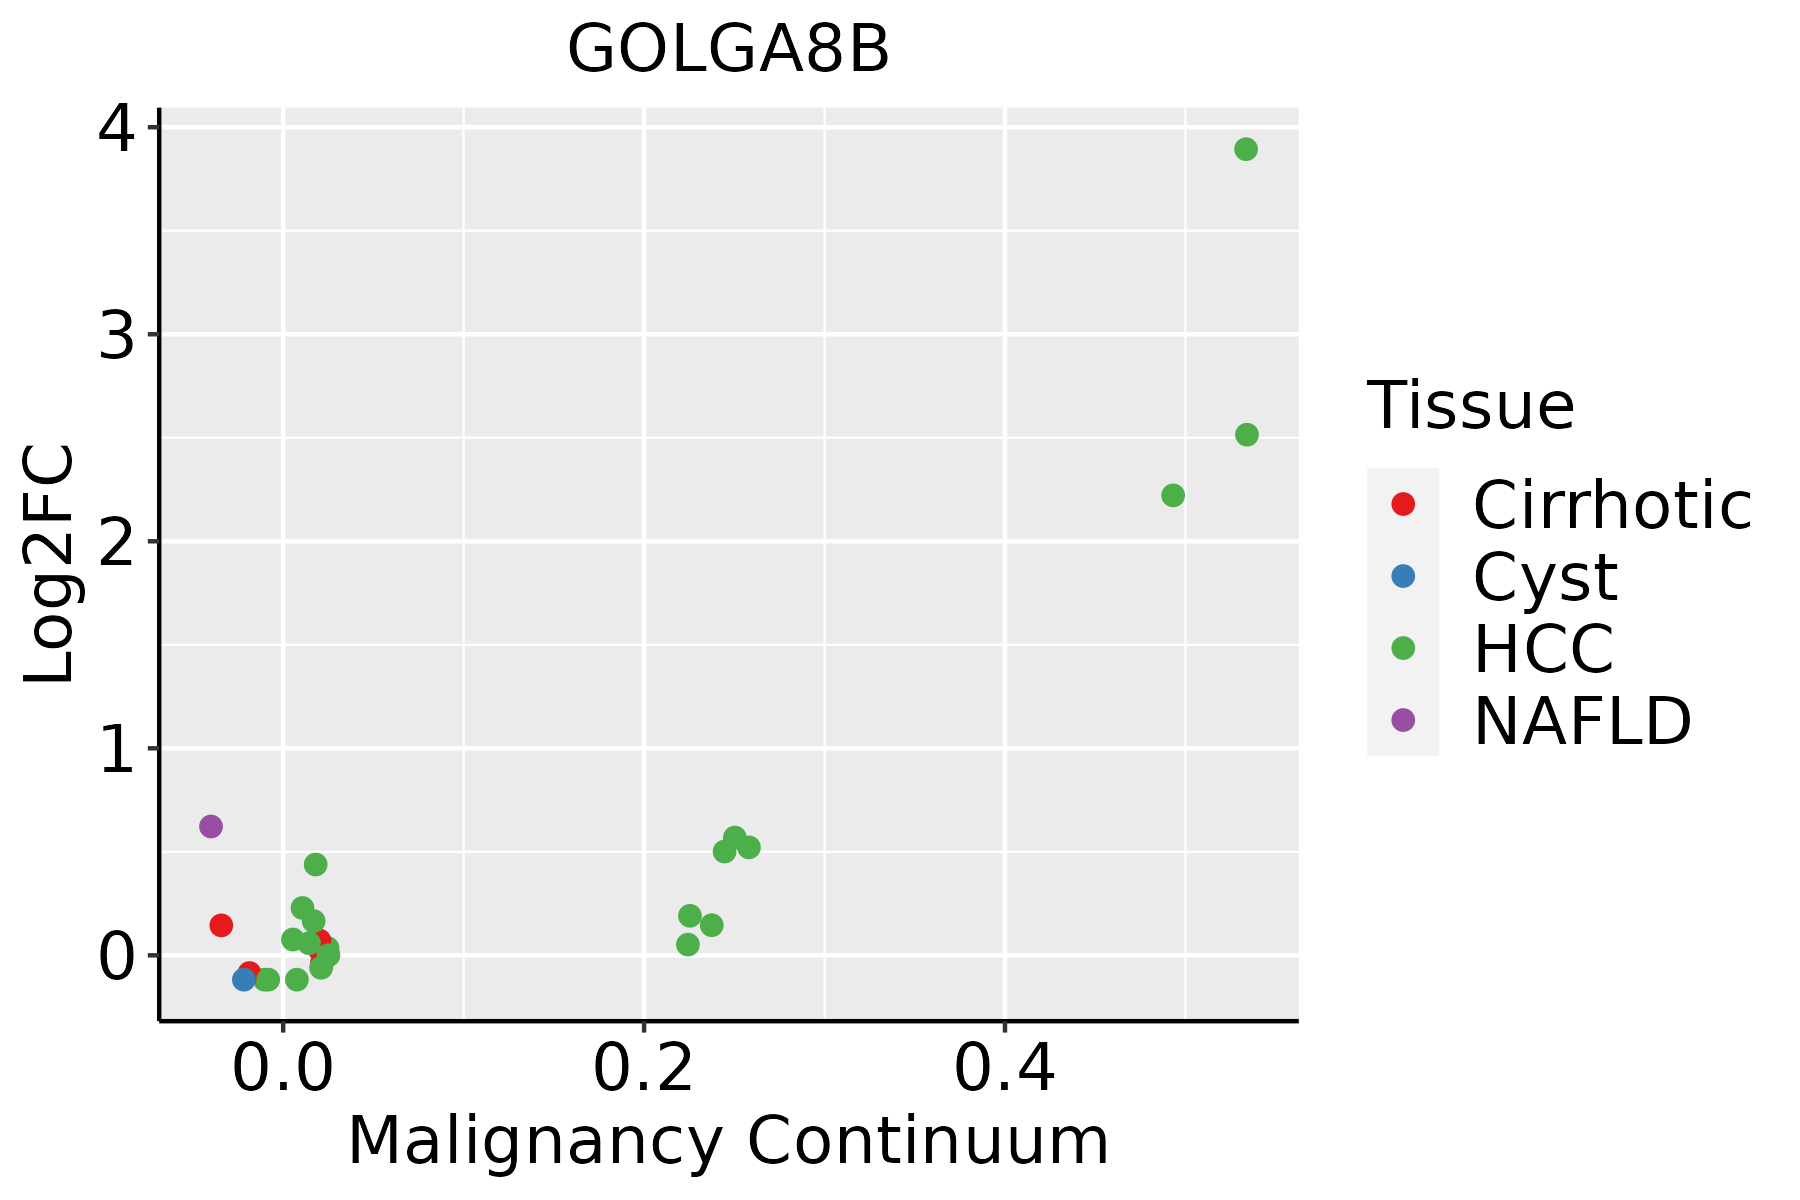 | HCC: Hepatocellular carcinoma |
| NAFLD: Non-alcoholic fatty liver disease | ||
| Oral Cavity | 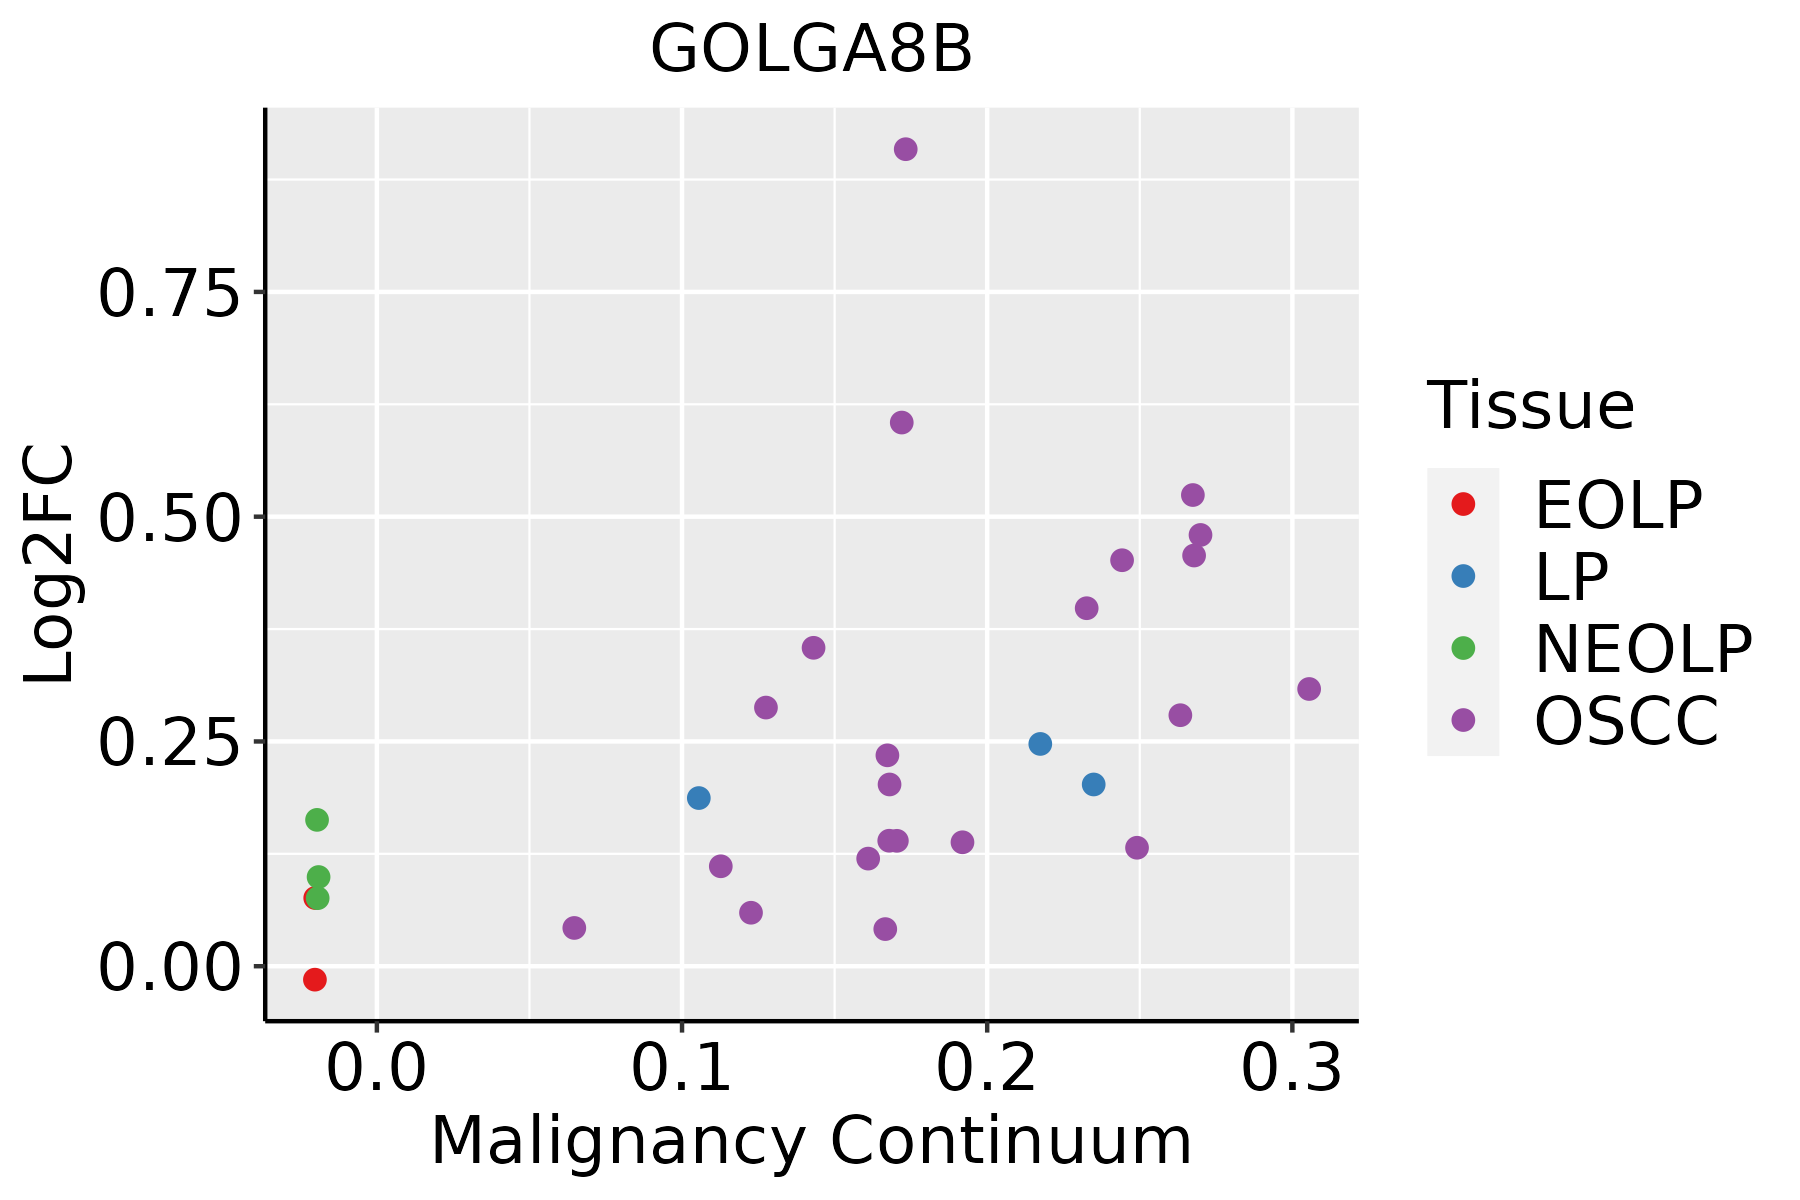 | EOLP: Erosive Oral lichen planus |
| LP: leukoplakia | ||
| NEOLP: Non-erosive oral lichen planus | ||
| OSCC: Oral squamous cell carcinoma | ||
| Thyroid | 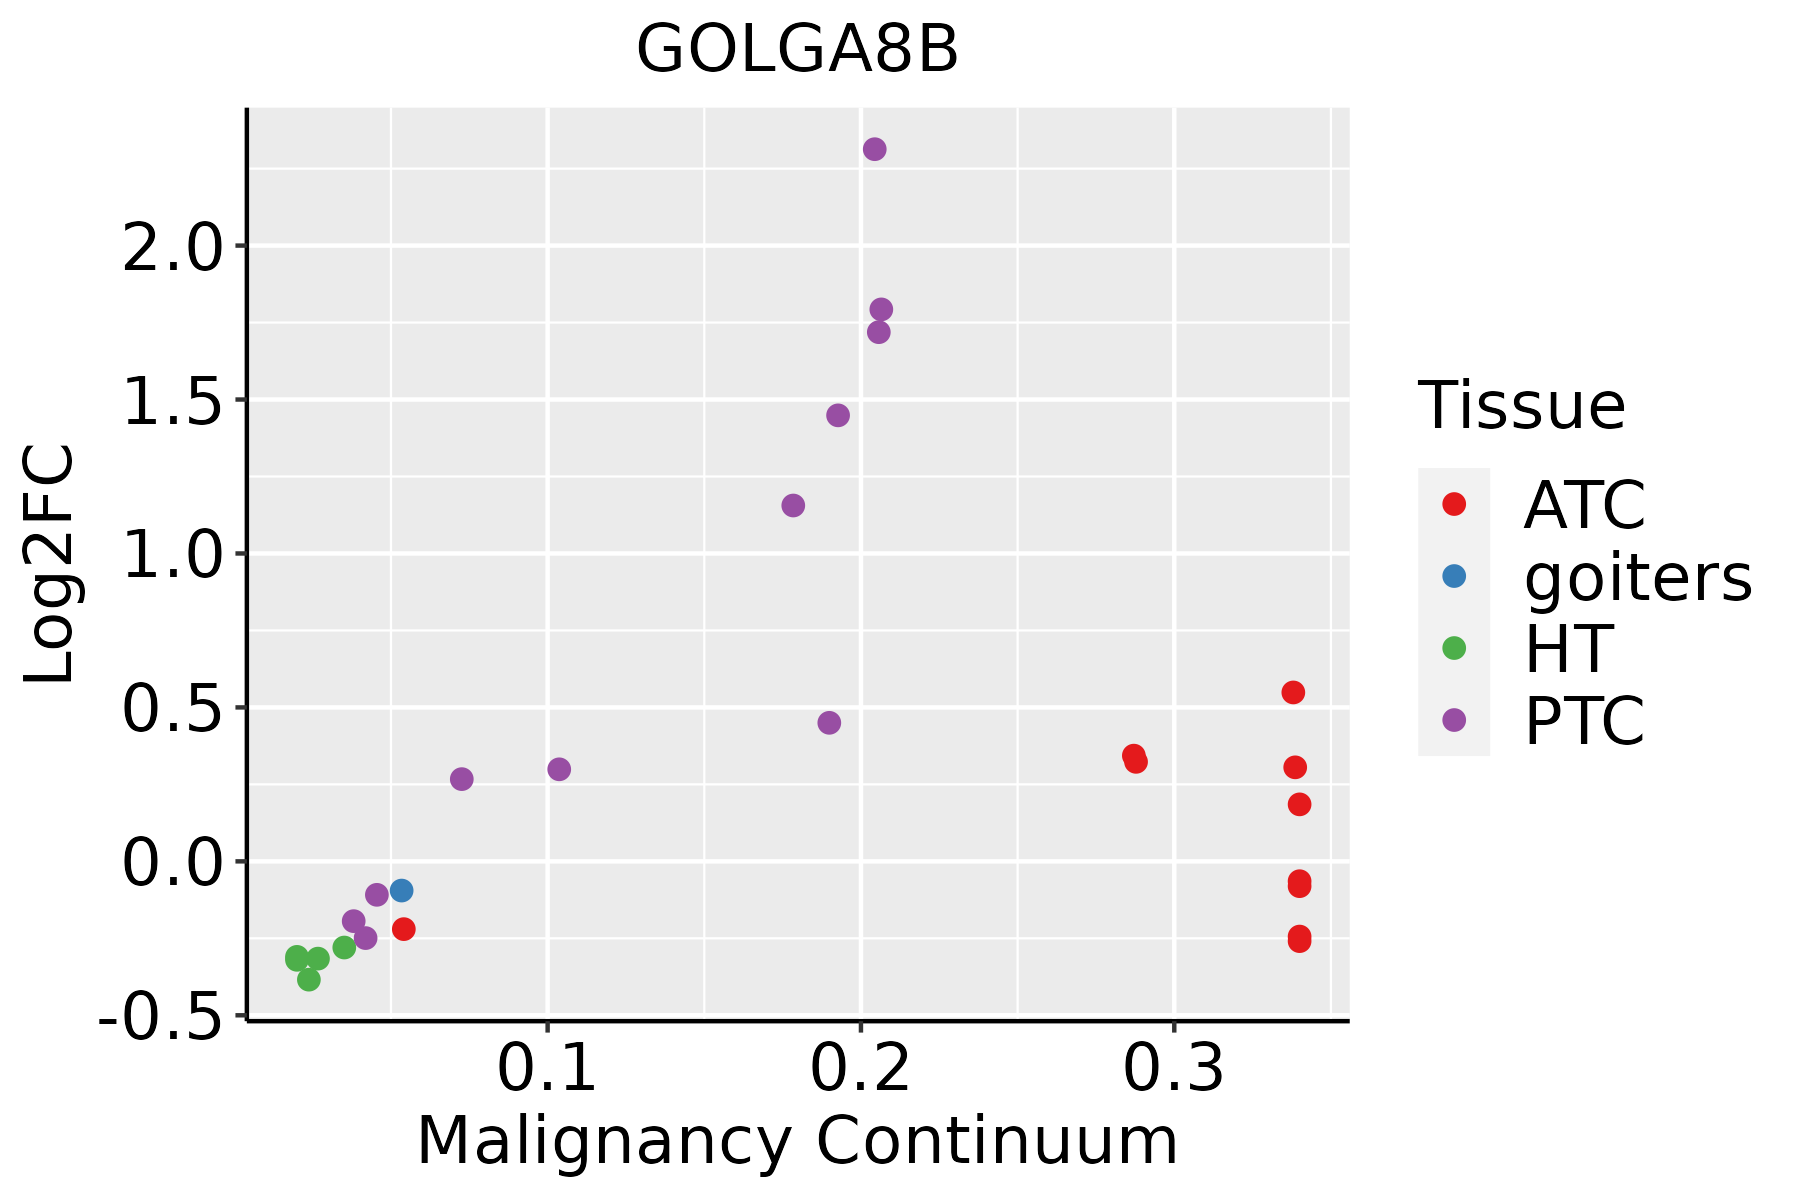 | ATC: Anaplastic thyroid cancer |
| HT: Hashimoto's thyroiditis | ||
| PTC: Papillary thyroid cancer |
| ∗log2FC in expression of this searched gene in stem-like cells from each diseased tissue sample relative to stem-like cells in normal samples in each tissue plotted against the malignancy continuum. Samples are colored based on if they are from different disease stage. |
Top |
Malignant transformation related pathway analysis |
| Find out the enriched GO biological processes and KEGG pathways involved in transition from healthy to precancer to cancer |
| Tissue | Disease Stage | Enriched GO biological Processes |
| Colorectum | AD |  |
| Colorectum | SER |  |
| Colorectum | MSS |  |
| Colorectum | MSI-H |  |
| Colorectum | FAP |  |
| ∗Top 15 enriched GO BP terms are showed in the bar plot of each disease state in each tissue. Each row represents a significant GO biological process which is colored according to the -log10(p.adjust). |
| Page: 1 2 3 4 5 6 7 8 9 |
| GO ID | Tissue | Disease Stage | Description | Gene Ratio | Bg Ratio | pvalue | p.adjust | Count |
| GO:00070305 | Endometrium | AEH | Golgi organization | 32/2100 | 157/18723 | 5.73e-04 | 5.69e-03 | 32 |
| GO:000703012 | Endometrium | EEC | Golgi organization | 32/2168 | 157/18723 | 9.87e-04 | 8.76e-03 | 32 |
| GO:000705114 | Esophagus | ESCC | spindle organization | 134/8552 | 184/18723 | 5.70e-14 | 2.87e-12 | 134 |
| GO:00512256 | Esophagus | ESCC | spindle assembly | 85/8552 | 117/18723 | 2.72e-09 | 5.98e-08 | 85 |
| GO:00070308 | Esophagus | ESCC | Golgi organization | 101/8552 | 157/18723 | 1.78e-06 | 2.10e-05 | 101 |
| GO:0007030 | Liver | NAFLD | Golgi organization | 36/1882 | 157/18723 | 1.76e-06 | 7.68e-05 | 36 |
| GO:000705111 | Liver | HCC | spindle organization | 116/7958 | 184/18723 | 1.40e-08 | 3.40e-07 | 116 |
| GO:00070302 | Liver | HCC | Golgi organization | 99/7958 | 157/18723 | 1.54e-07 | 2.85e-06 | 99 |
| GO:005122511 | Liver | HCC | spindle assembly | 75/7958 | 117/18723 | 1.92e-06 | 2.67e-05 | 75 |
| GO:00070517 | Oral cavity | OSCC | spindle organization | 117/7305 | 184/18723 | 1.16e-11 | 4.17e-10 | 117 |
| GO:00512255 | Oral cavity | OSCC | spindle assembly | 73/7305 | 117/18723 | 2.51e-07 | 3.96e-06 | 73 |
| GO:00070307 | Oral cavity | OSCC | Golgi organization | 92/7305 | 157/18723 | 4.96e-07 | 7.27e-06 | 92 |
| GO:00512258 | Thyroid | HT | spindle assembly | 17/1272 | 117/18723 | 2.34e-03 | 2.00e-02 | 17 |
| GO:000705110 | Thyroid | HT | spindle organization | 22/1272 | 184/18723 | 6.95e-03 | 4.22e-02 | 22 |
| GO:000705116 | Thyroid | PTC | spindle organization | 92/5968 | 184/18723 | 2.21e-07 | 3.92e-06 | 92 |
| GO:000703010 | Thyroid | PTC | Golgi organization | 79/5968 | 157/18723 | 1.11e-06 | 1.64e-05 | 79 |
| GO:005122514 | Thyroid | PTC | spindle assembly | 56/5968 | 117/18723 | 2.17e-04 | 1.60e-03 | 56 |
| GO:000705122 | Thyroid | ATC | spindle organization | 109/6293 | 184/18723 | 7.99e-13 | 3.46e-11 | 109 |
| GO:005122521 | Thyroid | ATC | spindle assembly | 66/6293 | 117/18723 | 3.28e-07 | 4.88e-06 | 66 |
| GO:000703015 | Thyroid | ATC | Golgi organization | 79/6293 | 157/18723 | 1.07e-05 | 1.05e-04 | 79 |
| Page: 1 |
| Pathway ID | Tissue | Disease Stage | Description | Gene Ratio | Bg Ratio | pvalue | p.adjust | qvalue | Count |
| Page: 1 |
Top |
Cell-cell communication analysis |
| Identification of potential cell-cell interactions between two cell types and their ligand-receptor pairs for different disease states |
| Ligand | Receptor | LRpair | Pathway | Tissue | Disease Stage |
| Page: 1 |
Top |
Single-cell gene regulatory network inference analysis |
| Find out the significant the regulons (TFs) and the target genes of each regulon across cell types for different disease states |
| TF | Cell Type | Tissue | Disease Stage | Target Gene | RSS | Regulon Activity |
| ∗The dot plots of a searched regulon are shown for all cell subpopulations in each disease state of each tissue based on the regulon specific score inferred using pySCENIC and by calculating the average expression. |
| Page: 1 |
Top |
Somatic mutation of malignant transformation related genes |
| Annotation of somatic variants for genes involved in malignant transformation |
| Hugo Symbol | Variant Class | Variant Classification | dbSNP RS | HGVSc | HGVSp | HGVSp Short | SWISSPROT | BIOTYPE | SIFT | PolyPhen | Tumor Sample Barcode | Tissue | Histology | Sex | Age | Stage | Therapy Types | Drugs | Outcome |
| GOLGA8B | SNV | Missense_Mutation | rs756682773 | c.209N>T | p.Pro70Leu | p.P70L | A8MQT2 | protein_coding | tolerated(0.38) | benign(0.025) | TCGA-AJ-A3EL-01 | Endometrium | uterine corpus endometrioid carcinoma | Female | <65 | I/II | Unknown | Unknown | SD |
| GOLGA8B | SNV | Missense_Mutation | novel | c.244T>C | p.Ser82Pro | p.S82P | A8MQT2 | protein_coding | deleterious(0.01) | possibly_damaging(0.744) | TCGA-AP-A0LM-01 | Endometrium | uterine corpus endometrioid carcinoma | Female | <65 | III/IV | Chemotherapy | cisplatin | SD |
| GOLGA8B | SNV | Missense_Mutation | novel | c.1808G>T | p.Arg603Ile | p.R603I | A8MQT2 | protein_coding | deleterious(0) | probably_damaging(0.959) | TCGA-AX-A1CE-01 | Endometrium | uterine corpus endometrioid carcinoma | Female | <65 | I/II | Unspecific | Paclitaxel | SD |
| GOLGA8B | SNV | Missense_Mutation | c.1796N>T | p.Pro599Leu | p.P599L | A8MQT2 | protein_coding | tolerated(0.2) | probably_damaging(0.999) | TCGA-B5-A0K6-01 | Endometrium | uterine corpus endometrioid carcinoma | Female | <65 | I/II | Unknown | Unknown | SD | |
| GOLGA8B | SNV | Missense_Mutation | novel | c.194N>G | p.His65Arg | p.H65R | A8MQT2 | protein_coding | tolerated(0.52) | benign(0.121) | TCGA-D1-A0ZS-01 | Endometrium | uterine corpus endometrioid carcinoma | Female | <65 | I/II | Unknown | Unknown | SD |
| GOLGA8B | SNV | Missense_Mutation | novel | c.338N>T | p.Asn113Ile | p.N113I | A8MQT2 | protein_coding | deleterious(0) | probably_damaging(0.961) | TCGA-D1-A175-01 | Endometrium | uterine corpus endometrioid carcinoma | Female | <65 | I/II | Chemotherapy | paclitaxel | SD |
| GOLGA8B | SNV | Missense_Mutation | rs779177804 | c.1574N>T | p.Ala525Val | p.A525V | A8MQT2 | protein_coding | tolerated(0.05) | probably_damaging(0.994) | TCGA-EY-A1GU-01 | Endometrium | uterine corpus endometrioid carcinoma | Female | >=65 | I/II | Unknown | Unknown | SD |
| GOLGA8B | SNV | Missense_Mutation | novel | c.242G>A | p.Arg81Lys | p.R81K | A8MQT2 | protein_coding | tolerated(0.06) | benign(0.229) | TCGA-95-7043-01 | Lung | lung adenocarcinoma | Female | <65 | I/II | Unknown | Unknown | PD |
| Page: 1 |
Top |
Related drugs of malignant transformation related genes |
| Identification of chemicals and drugs interact with genes involved in malignant transfromation |
| (DGIdb 4.0) |
| Entrez ID | Symbol | Category | Interaction Types | Drug Claim Name | Drug Name | PMIDs |
| Page: 1 |

Copyright 2023-Present -The University of Texas Health Science Center at Houston |