
|
|||||
|
 | |
| |
| |
| |
| |
| |
|
Gene: GOLGA8A |
Gene summary for GOLGA8A |
| Gene information | Species | Human | Gene symbol | GOLGA8A | Gene ID | 23015 |
| Gene name | golgin A8 family member A | |
| Gene Alias | CFAP286 | |
| Cytomap | 15q14 | |
| Gene Type | protein-coding | GO ID | GO:0000226 | UniProtAcc | A7E2F4 |
Top |
Malignant transformation analysis |
| Identification of the aberrant gene expression in precancerous and cancerous lesions by comparing the gene expression of stem-like cells in diseased tissues with normal stem cells |
| Entrez ID | Symbol | Replicates | Species | Organ | Tissue | Adj P-value | Log2FC | Malignancy |
| 23015 | GOLGA8A | HTA11_78_2000001011 | Human | Colorectum | AD | 1.22e-02 | 3.51e-01 | -0.1088 |
| 23015 | GOLGA8A | HTA11_347_2000001011 | Human | Colorectum | AD | 7.88e-12 | 4.79e-01 | -0.1954 |
| 23015 | GOLGA8A | HTA11_696_2000001011 | Human | Colorectum | AD | 1.21e-06 | 4.61e-01 | -0.1464 |
| 23015 | GOLGA8A | HTA11_866_2000001011 | Human | Colorectum | AD | 5.57e-11 | 5.33e-01 | -0.1001 |
| 23015 | GOLGA8A | HTA11_7696_3000711011 | Human | Colorectum | AD | 8.65e-07 | 3.86e-01 | 0.0674 |
| 23015 | GOLGA8A | HTA11_99999965104_69814 | Human | Colorectum | MSS | 2.28e-04 | 4.53e-01 | 0.281 |
| 23015 | GOLGA8A | A015-C-203 | Human | Colorectum | FAP | 2.26e-15 | 4.73e-01 | -0.1294 |
| 23015 | GOLGA8A | A002-C-201 | Human | Colorectum | FAP | 4.98e-11 | 6.05e-01 | 0.0324 |
| 23015 | GOLGA8A | A001-C-119 | Human | Colorectum | FAP | 6.32e-05 | 5.36e-01 | -0.1557 |
| 23015 | GOLGA8A | A001-C-108 | Human | Colorectum | FAP | 2.08e-09 | 4.28e-01 | -0.0272 |
| 23015 | GOLGA8A | A002-C-021 | Human | Colorectum | FAP | 7.81e-08 | 4.68e-01 | 0.1171 |
| 23015 | GOLGA8A | A002-C-205 | Human | Colorectum | FAP | 8.40e-07 | 3.56e-01 | -0.1236 |
| 23015 | GOLGA8A | A001-C-104 | Human | Colorectum | FAP | 2.58e-08 | 5.21e-01 | 0.0184 |
| 23015 | GOLGA8A | A015-C-006 | Human | Colorectum | FAP | 3.46e-08 | 4.70e-01 | -0.0994 |
| 23015 | GOLGA8A | A002-C-114 | Human | Colorectum | FAP | 2.75e-11 | 5.61e-01 | -0.1561 |
| 23015 | GOLGA8A | A015-C-104 | Human | Colorectum | FAP | 1.18e-11 | 4.23e-01 | -0.1899 |
| 23015 | GOLGA8A | A001-C-203 | Human | Colorectum | FAP | 3.04e-04 | 3.81e-01 | -0.0481 |
| 23015 | GOLGA8A | A002-C-116 | Human | Colorectum | FAP | 4.49e-05 | 1.03e-01 | -0.0452 |
| 23015 | GOLGA8A | A018-E-020 | Human | Colorectum | FAP | 3.19e-09 | 4.76e-01 | -0.2034 |
| 23015 | GOLGA8A | F072B | Human | Colorectum | FAP | 1.23e-03 | -2.04e-01 | 0.257 |
| Page: 1 2 3 |
| Tissue | Expression Dynamics | Abbreviation |
| Colorectum (GSE201348) |  | FAP: Familial adenomatous polyposis |
| CRC: Colorectal cancer | ||
| Colorectum (HTA11) |  | AD: Adenomas |
| SER: Sessile serrated lesions | ||
| MSI-H: Microsatellite-high colorectal cancer | ||
| MSS: Microsatellite stable colorectal cancer | ||
| Endometrium |  | AEH: Atypical endometrial hyperplasia |
| EEC: Endometrioid Cancer | ||
| Thyroid | 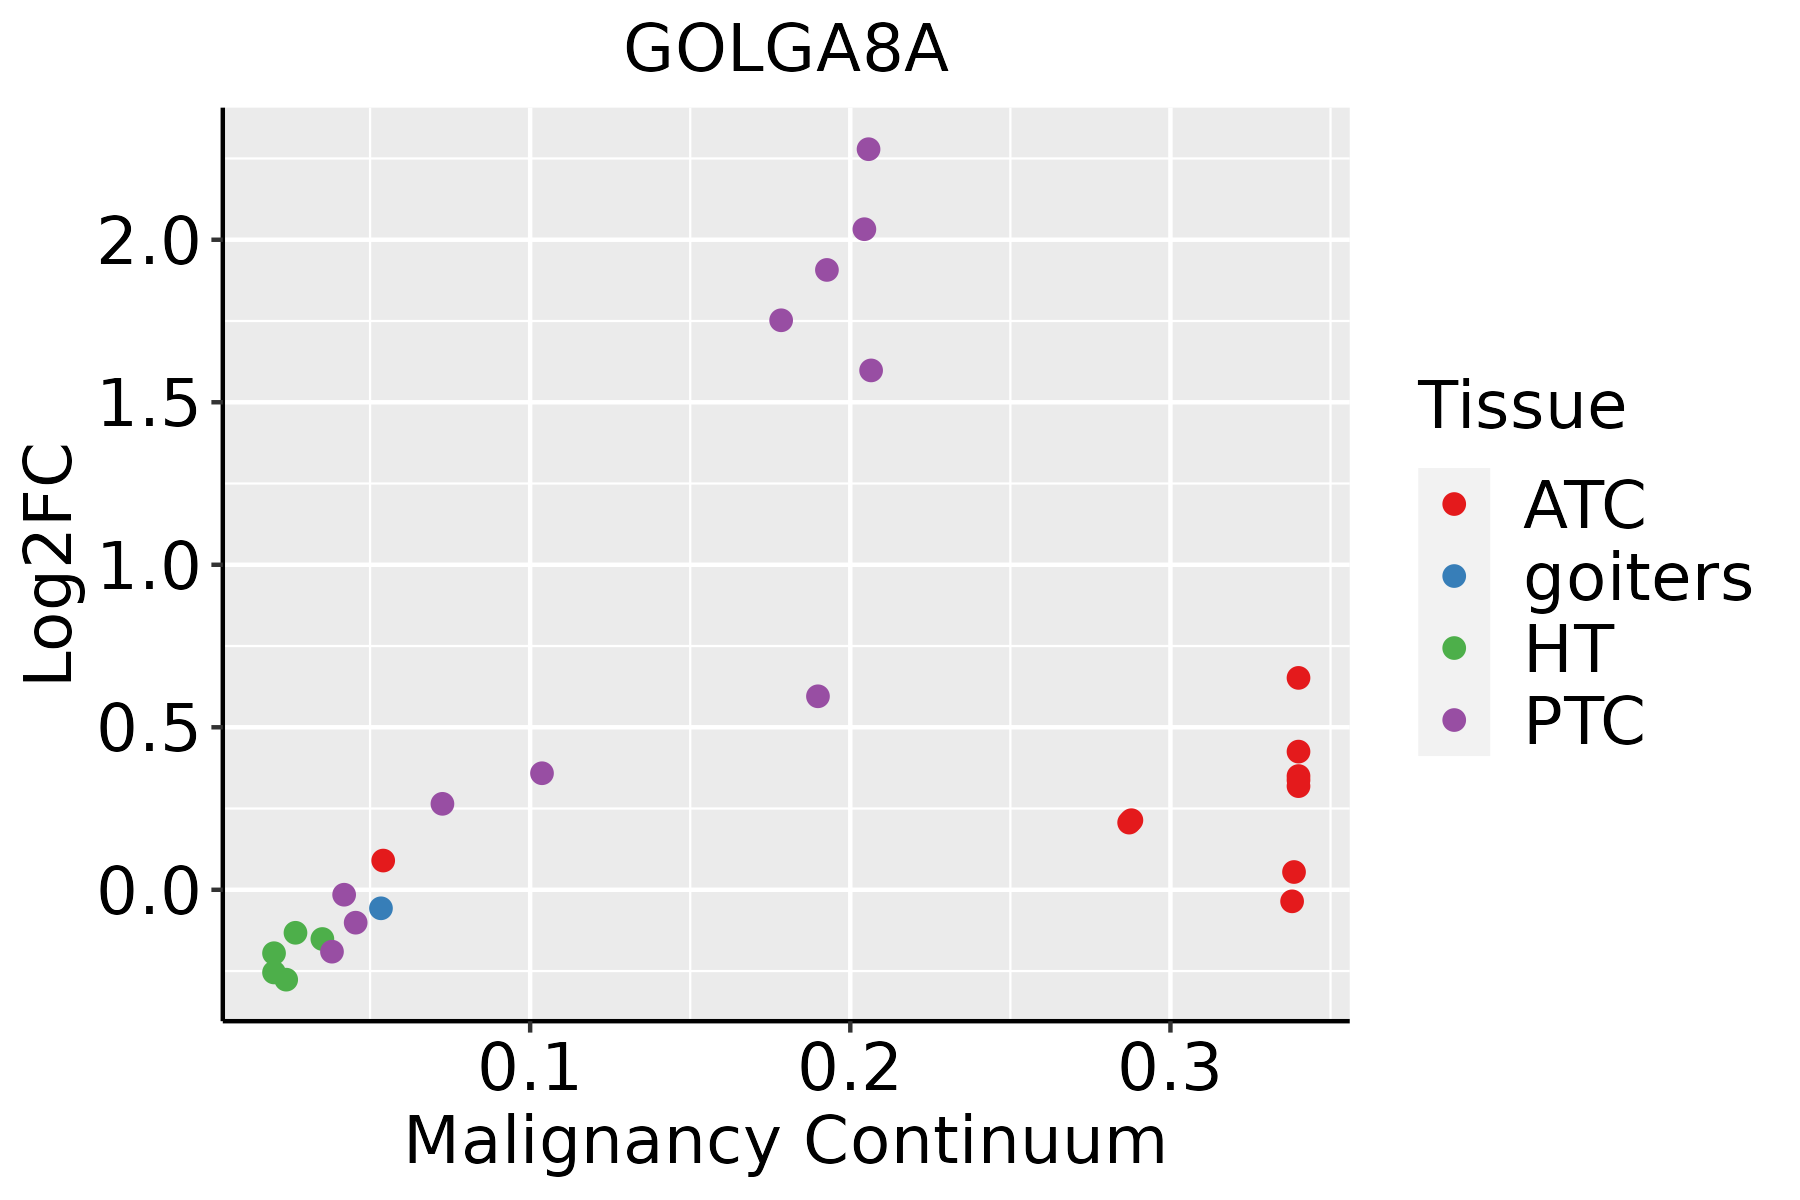 | ATC: Anaplastic thyroid cancer |
| HT: Hashimoto's thyroiditis | ||
| PTC: Papillary thyroid cancer |
| ∗log2FC in expression of this searched gene in stem-like cells from each diseased tissue sample relative to stem-like cells in normal samples in each tissue plotted against the malignancy continuum. Samples are colored based on if they are from different disease stage. |
Top |
Malignant transformation related pathway analysis |
| Find out the enriched GO biological processes and KEGG pathways involved in transition from healthy to precancer to cancer |
| Tissue | Disease Stage | Enriched GO biological Processes |
| Colorectum | AD |  |
| Colorectum | SER |  |
| Colorectum | MSS |  |
| Colorectum | MSI-H |  |
| Colorectum | FAP |  |
| ∗Top 15 enriched GO BP terms are showed in the bar plot of each disease state in each tissue. Each row represents a significant GO biological process which is colored according to the -log10(p.adjust). |
| Page: 1 2 3 4 5 6 7 8 9 |
| GO ID | Tissue | Disease Stage | Description | Gene Ratio | Bg Ratio | pvalue | p.adjust | Count |
| GO:0007051 | Colorectum | AD | spindle organization | 58/3918 | 184/18723 | 4.71e-04 | 5.20e-03 | 58 |
| GO:0051225 | Colorectum | AD | spindle assembly | 37/3918 | 117/18723 | 4.32e-03 | 2.96e-02 | 37 |
| GO:00070511 | Colorectum | MSS | spindle organization | 53/3467 | 184/18723 | 4.23e-04 | 5.19e-03 | 53 |
| GO:00512251 | Colorectum | MSS | spindle assembly | 33/3467 | 117/18723 | 6.68e-03 | 4.38e-02 | 33 |
| GO:00070512 | Colorectum | FAP | spindle organization | 41/2622 | 184/18723 | 1.50e-03 | 1.34e-02 | 41 |
| GO:00070305 | Endometrium | AEH | Golgi organization | 32/2100 | 157/18723 | 5.73e-04 | 5.69e-03 | 32 |
| GO:000703012 | Endometrium | EEC | Golgi organization | 32/2168 | 157/18723 | 9.87e-04 | 8.76e-03 | 32 |
| GO:000705116 | Thyroid | PTC | spindle organization | 92/5968 | 184/18723 | 2.21e-07 | 3.92e-06 | 92 |
| GO:000703010 | Thyroid | PTC | Golgi organization | 79/5968 | 157/18723 | 1.11e-06 | 1.64e-05 | 79 |
| GO:005122514 | Thyroid | PTC | spindle assembly | 56/5968 | 117/18723 | 2.17e-04 | 1.60e-03 | 56 |
| GO:000705122 | Thyroid | ATC | spindle organization | 109/6293 | 184/18723 | 7.99e-13 | 3.46e-11 | 109 |
| GO:005122521 | Thyroid | ATC | spindle assembly | 66/6293 | 117/18723 | 3.28e-07 | 4.88e-06 | 66 |
| GO:000703015 | Thyroid | ATC | Golgi organization | 79/6293 | 157/18723 | 1.07e-05 | 1.05e-04 | 79 |
| Page: 1 |
| Pathway ID | Tissue | Disease Stage | Description | Gene Ratio | Bg Ratio | pvalue | p.adjust | qvalue | Count |
| Page: 1 |
Top |
Cell-cell communication analysis |
| Identification of potential cell-cell interactions between two cell types and their ligand-receptor pairs for different disease states |
| Ligand | Receptor | LRpair | Pathway | Tissue | Disease Stage |
| Page: 1 |
Top |
Single-cell gene regulatory network inference analysis |
| Find out the significant the regulons (TFs) and the target genes of each regulon across cell types for different disease states |
| TF | Cell Type | Tissue | Disease Stage | Target Gene | RSS | Regulon Activity |
| ∗The dot plots of a searched regulon are shown for all cell subpopulations in each disease state of each tissue based on the regulon specific score inferred using pySCENIC and by calculating the average expression. |
| Page: 1 |
Top |
Somatic mutation of malignant transformation related genes |
| Annotation of somatic variants for genes involved in malignant transformation |
| Hugo Symbol | Variant Class | Variant Classification | dbSNP RS | HGVSc | HGVSp | HGVSp Short | SWISSPROT | BIOTYPE | SIFT | PolyPhen | Tumor Sample Barcode | Tissue | Histology | Sex | Age | Stage | Therapy Types | Drugs | Outcome |
| GOLGA8A | SNV | Missense_Mutation | rs776715749 | c.1657N>A | p.Glu553Lys | p.E553K | A7E2F4 | protein_coding | deleterious(0.01) | probably_damaging(0.986) | TCGA-A8-A09B-01 | Breast | breast invasive carcinoma | Female | <65 | III/IV | Chemotherapy | 5-fluorouracil | SD |
| GOLGA8A | SNV | Missense_Mutation | c.1573N>T | p.Ala525Ser | p.A525S | A7E2F4 | protein_coding | deleterious(0.03) | probably_damaging(0.987) | TCGA-D8-A1XK-01 | Breast | breast invasive carcinoma | Female | <65 | I/II | Chemotherapy | doxorubicine+cyclophosphamide | SD | |
| GOLGA8A | SNV | Missense_Mutation | c.1771N>T | p.Pro591Ser | p.P591S | A7E2F4 | protein_coding | deleterious(0) | probably_damaging(0.999) | TCGA-F4-6856-01 | Colorectum | colon adenocarcinoma | Male | <65 | I/II | Ancillary | leucovorin | CR | |
| GOLGA8A | SNV | Missense_Mutation | novel | c.619N>T | p.Arg207Trp | p.R207W | A7E2F4 | protein_coding | deleterious(0.01) | possibly_damaging(0.827) | TCGA-A5-A0G2-01 | Endometrium | uterine corpus endometrioid carcinoma | Female | <65 | III/IV | Unknown | Unknown | SD |
| GOLGA8A | SNV | Missense_Mutation | rs756650329 | c.209N>T | p.Pro70Leu | p.P70L | A7E2F4 | protein_coding | tolerated(0.37) | benign(0.014) | TCGA-AJ-A3EL-01 | Endometrium | uterine corpus endometrioid carcinoma | Female | <65 | I/II | Unknown | Unknown | SD |
| GOLGA8A | SNV | Missense_Mutation | c.1622N>T | p.Ala541Val | p.A541V | A7E2F4 | protein_coding | tolerated(1) | benign(0) | TCGA-AX-A063-01 | Endometrium | uterine corpus endometrioid carcinoma | Female | <65 | I/II | Unknown | Unknown | SD | |
| GOLGA8A | SNV | Missense_Mutation | c.239C>T | p.Ser80Leu | p.S80L | A7E2F4 | protein_coding | tolerated(0.12) | probably_damaging(0.999) | TCGA-AX-A0J0-01 | Endometrium | uterine corpus endometrioid carcinoma | Female | <65 | I/II | Unknown | Unknown | SD | |
| GOLGA8A | SNV | Missense_Mutation | novel | c.193N>T | p.His65Tyr | p.H65Y | A7E2F4 | protein_coding | tolerated(0.06) | benign(0.009) | TCGA-AX-A2HA-01 | Endometrium | uterine corpus endometrioid carcinoma | Female | <65 | I/II | Unknown | Unknown | SD |
| GOLGA8A | SNV | Missense_Mutation | c.1740N>T | p.Glu580Asp | p.E580D | A7E2F4 | protein_coding | deleterious(0) | probably_damaging(0.993) | TCGA-B5-A11N-01 | Endometrium | uterine corpus endometrioid carcinoma | Female | >=65 | I/II | Unknown | Unknown | SD | |
| GOLGA8A | SNV | Missense_Mutation | c.1622N>T | p.Ala541Val | p.A541V | A7E2F4 | protein_coding | tolerated(1) | benign(0) | TCGA-B5-A3FC-01 | Endometrium | uterine corpus endometrioid carcinoma | Female | <65 | I/II | Unknown | Unknown | SD |
| Page: 1 2 |
Top |
Related drugs of malignant transformation related genes |
| Identification of chemicals and drugs interact with genes involved in malignant transfromation |
| (DGIdb 4.0) |
| Entrez ID | Symbol | Category | Interaction Types | Drug Claim Name | Drug Name | PMIDs |
| Page: 1 |

Copyright 2023-Present -The University of Texas Health Science Center at Houston |