
|
|||||
|
 | |
| |
| |
| |
| |
| |
|
Gene: GOLGA7 |
Gene summary for GOLGA7 |
| Gene information | Species | Human | Gene symbol | GOLGA7 | Gene ID | 51125 |
| Gene name | golgin A7 | |
| Gene Alias | GCP16 | |
| Cytomap | 8p11.21 | |
| Gene Type | protein-coding | GO ID | GO:0006464 | UniProtAcc | Q7Z5G4 |
Top |
Malignant transformation analysis |
| Identification of the aberrant gene expression in precancerous and cancerous lesions by comparing the gene expression of stem-like cells in diseased tissues with normal stem cells |
| Entrez ID | Symbol | Replicates | Species | Organ | Tissue | Adj P-value | Log2FC | Malignancy |
| 51125 | GOLGA7 | LZE2T | Human | Esophagus | ESCC | 2.89e-04 | 6.66e-01 | 0.082 |
| 51125 | GOLGA7 | LZE4T | Human | Esophagus | ESCC | 3.69e-24 | 7.05e-01 | 0.0811 |
| 51125 | GOLGA7 | LZE7T | Human | Esophagus | ESCC | 2.04e-14 | 5.35e-01 | 0.0667 |
| 51125 | GOLGA7 | LZE8T | Human | Esophagus | ESCC | 9.08e-16 | 4.59e-01 | 0.067 |
| 51125 | GOLGA7 | LZE20T | Human | Esophagus | ESCC | 6.77e-23 | 1.07e+00 | 0.0662 |
| 51125 | GOLGA7 | LZE22D1 | Human | Esophagus | HGIN | 6.22e-07 | 1.58e-01 | 0.0595 |
| 51125 | GOLGA7 | LZE22T | Human | Esophagus | ESCC | 8.71e-06 | 6.27e-01 | 0.068 |
| 51125 | GOLGA7 | LZE24T | Human | Esophagus | ESCC | 2.26e-34 | 1.05e+00 | 0.0596 |
| 51125 | GOLGA7 | LZE21T | Human | Esophagus | ESCC | 8.59e-05 | 4.71e-01 | 0.0655 |
| 51125 | GOLGA7 | LZE6T | Human | Esophagus | ESCC | 3.59e-13 | 4.40e-01 | 0.0845 |
| 51125 | GOLGA7 | P1T-E | Human | Esophagus | ESCC | 1.40e-07 | 5.73e-01 | 0.0875 |
| 51125 | GOLGA7 | P2T-E | Human | Esophagus | ESCC | 3.96e-56 | 1.08e+00 | 0.1177 |
| 51125 | GOLGA7 | P4T-E | Human | Esophagus | ESCC | 1.09e-47 | 1.10e+00 | 0.1323 |
| 51125 | GOLGA7 | P5T-E | Human | Esophagus | ESCC | 1.58e-15 | 3.62e-01 | 0.1327 |
| 51125 | GOLGA7 | P8T-E | Human | Esophagus | ESCC | 9.47e-33 | 6.97e-01 | 0.0889 |
| 51125 | GOLGA7 | P9T-E | Human | Esophagus | ESCC | 9.12e-21 | 4.61e-01 | 0.1131 |
| 51125 | GOLGA7 | P10T-E | Human | Esophagus | ESCC | 2.65e-72 | 1.02e+00 | 0.116 |
| 51125 | GOLGA7 | P11T-E | Human | Esophagus | ESCC | 6.36e-32 | 1.11e+00 | 0.1426 |
| 51125 | GOLGA7 | P12T-E | Human | Esophagus | ESCC | 1.40e-50 | 9.87e-01 | 0.1122 |
| 51125 | GOLGA7 | P15T-E | Human | Esophagus | ESCC | 1.99e-69 | 1.52e+00 | 0.1149 |
| Page: 1 2 3 4 5 6 7 |
| Tissue | Expression Dynamics | Abbreviation |
| Esophagus | 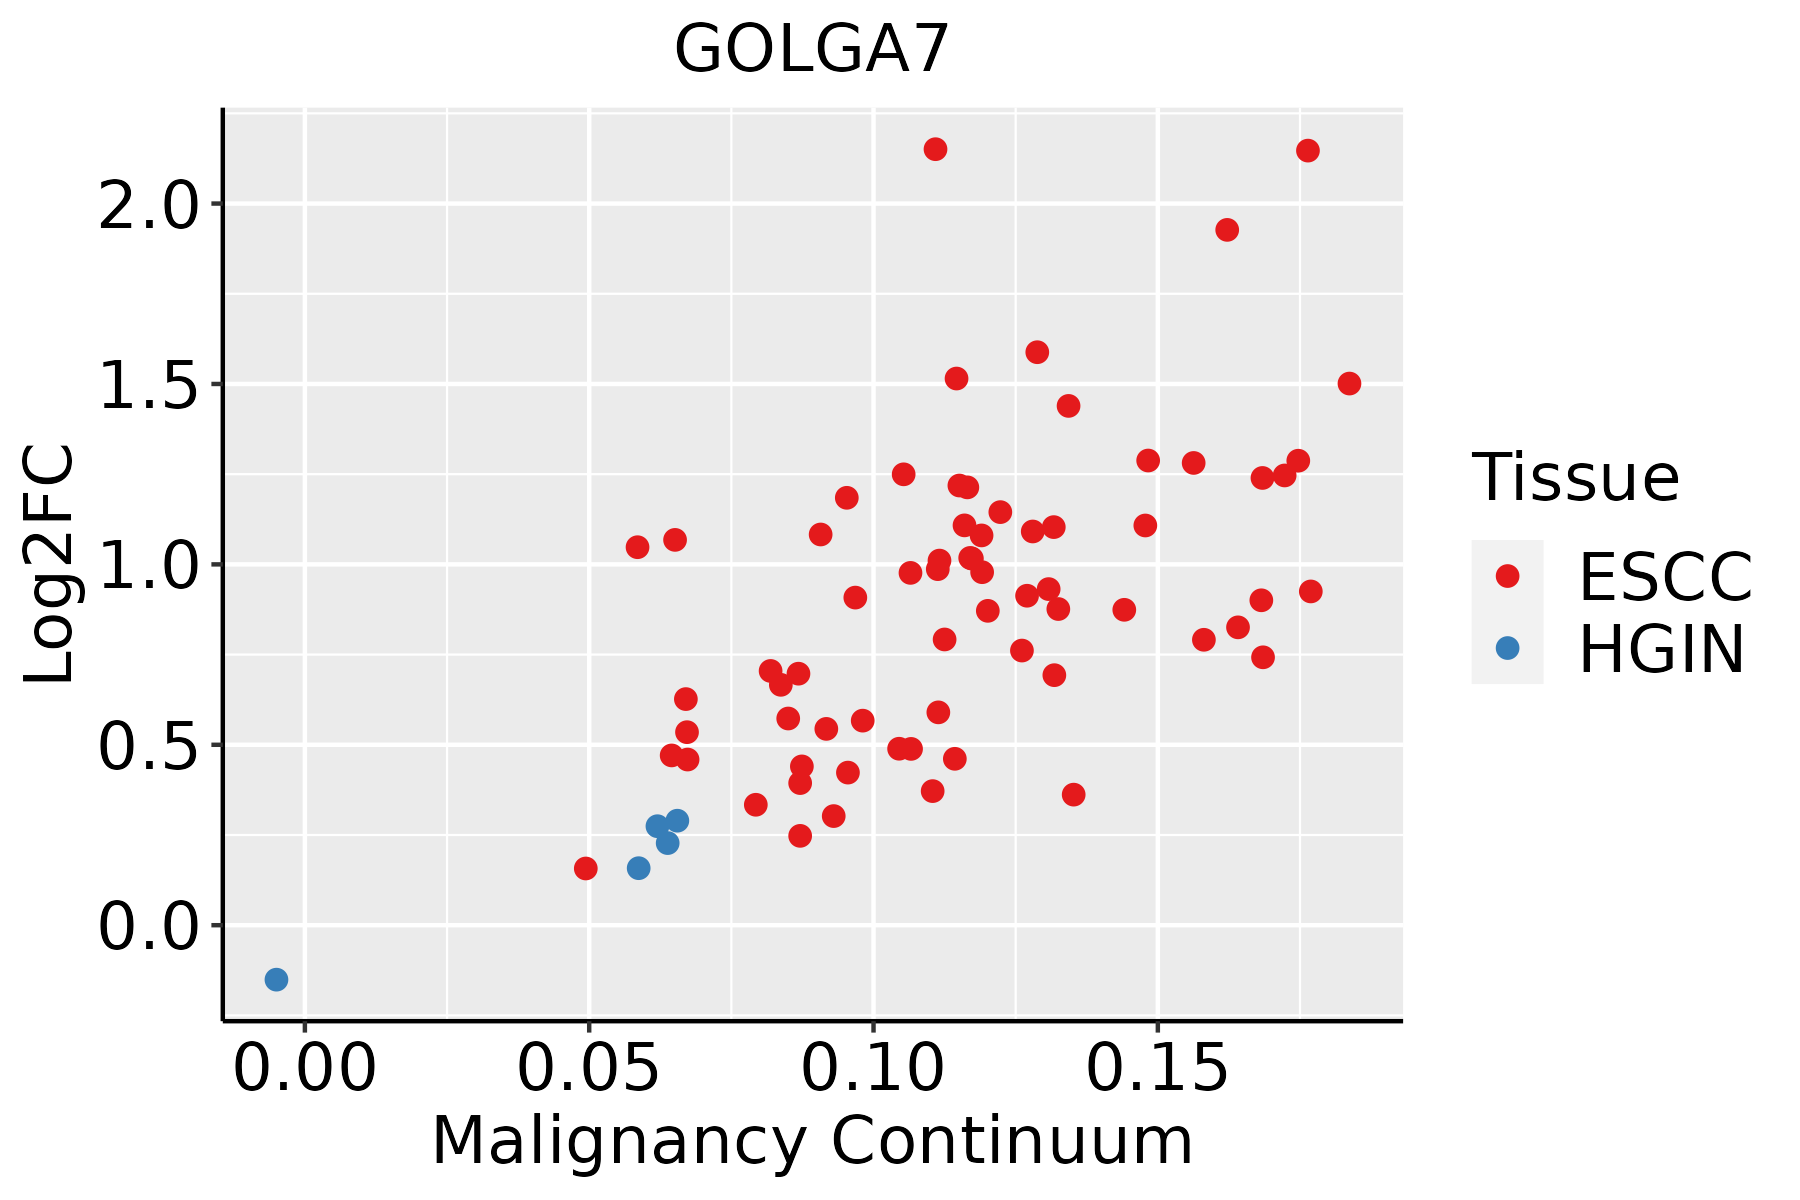 | ESCC: Esophageal squamous cell carcinoma |
| HGIN: High-grade intraepithelial neoplasias | ||
| LGIN: Low-grade intraepithelial neoplasias | ||
| Liver | 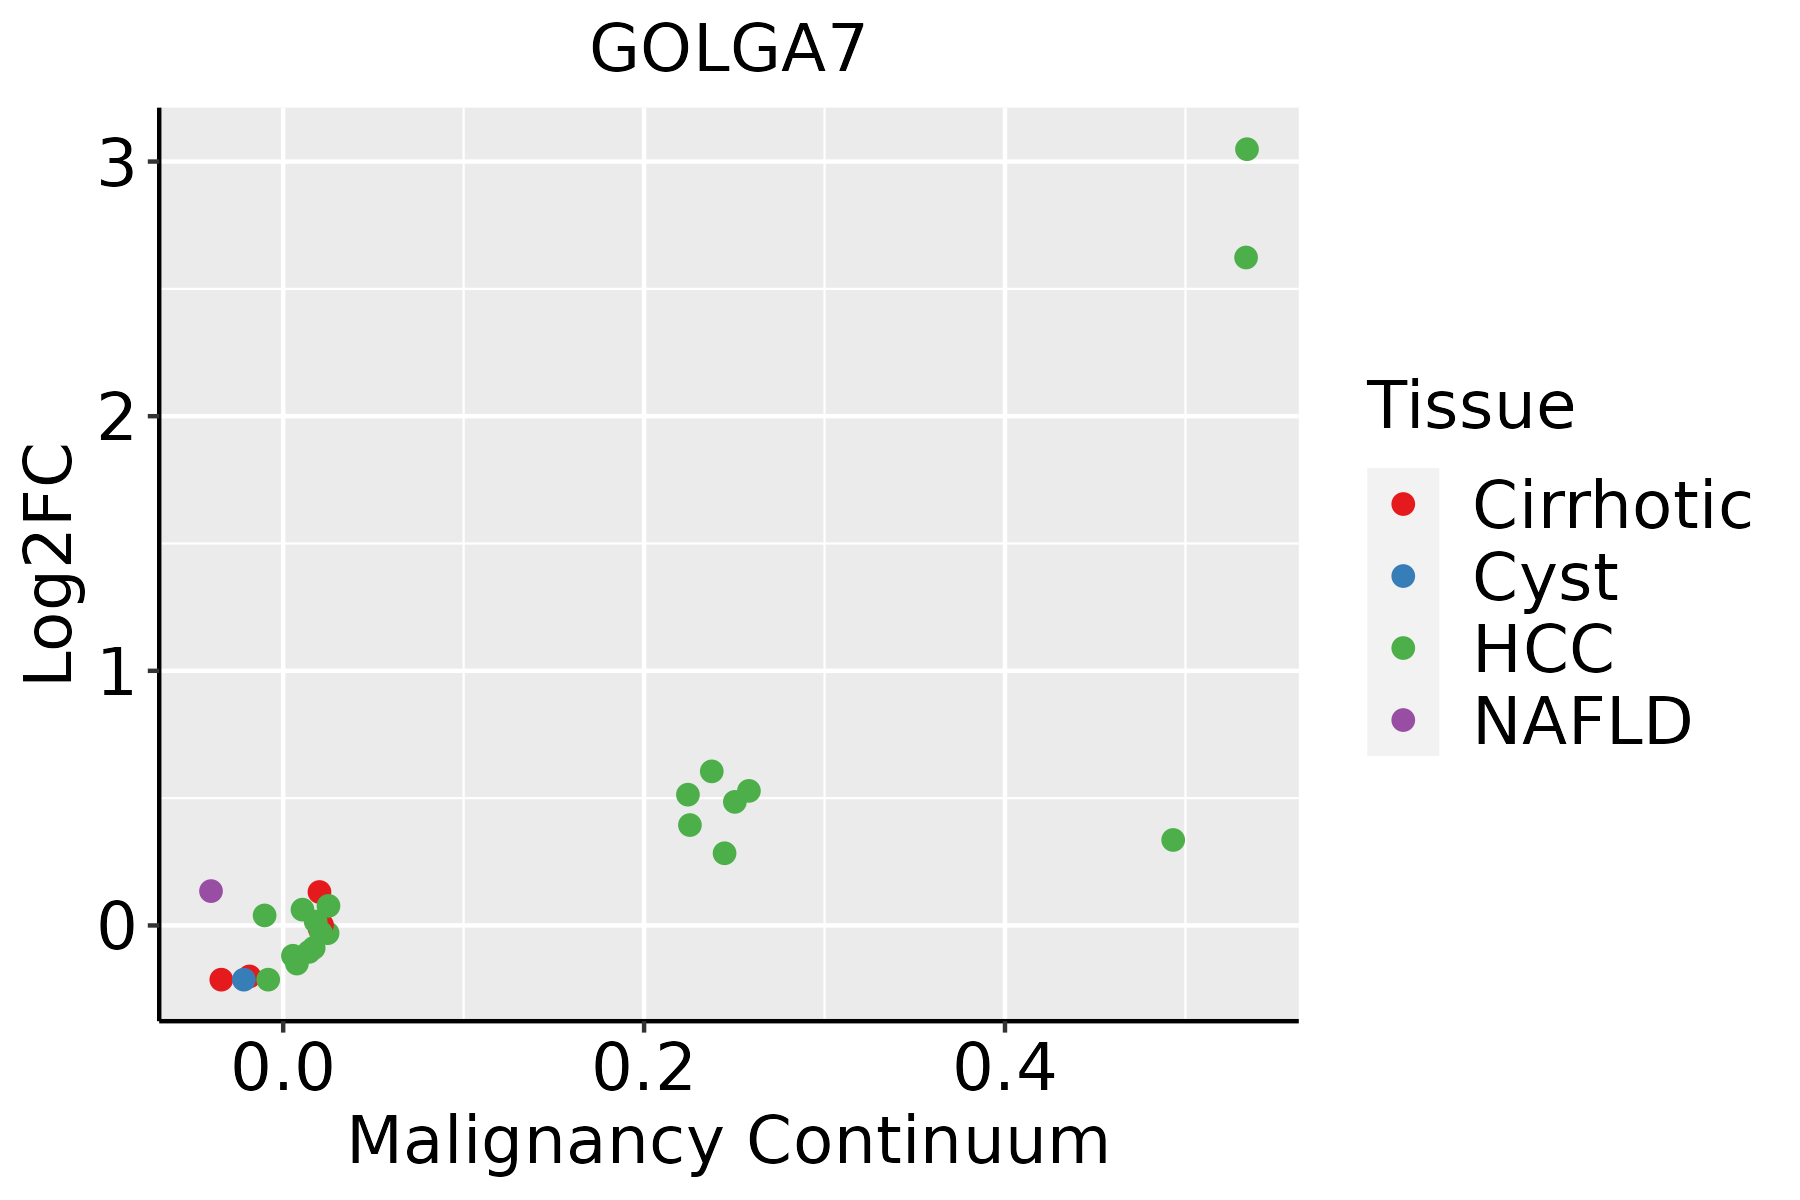 | HCC: Hepatocellular carcinoma |
| NAFLD: Non-alcoholic fatty liver disease | ||
| Oral Cavity | 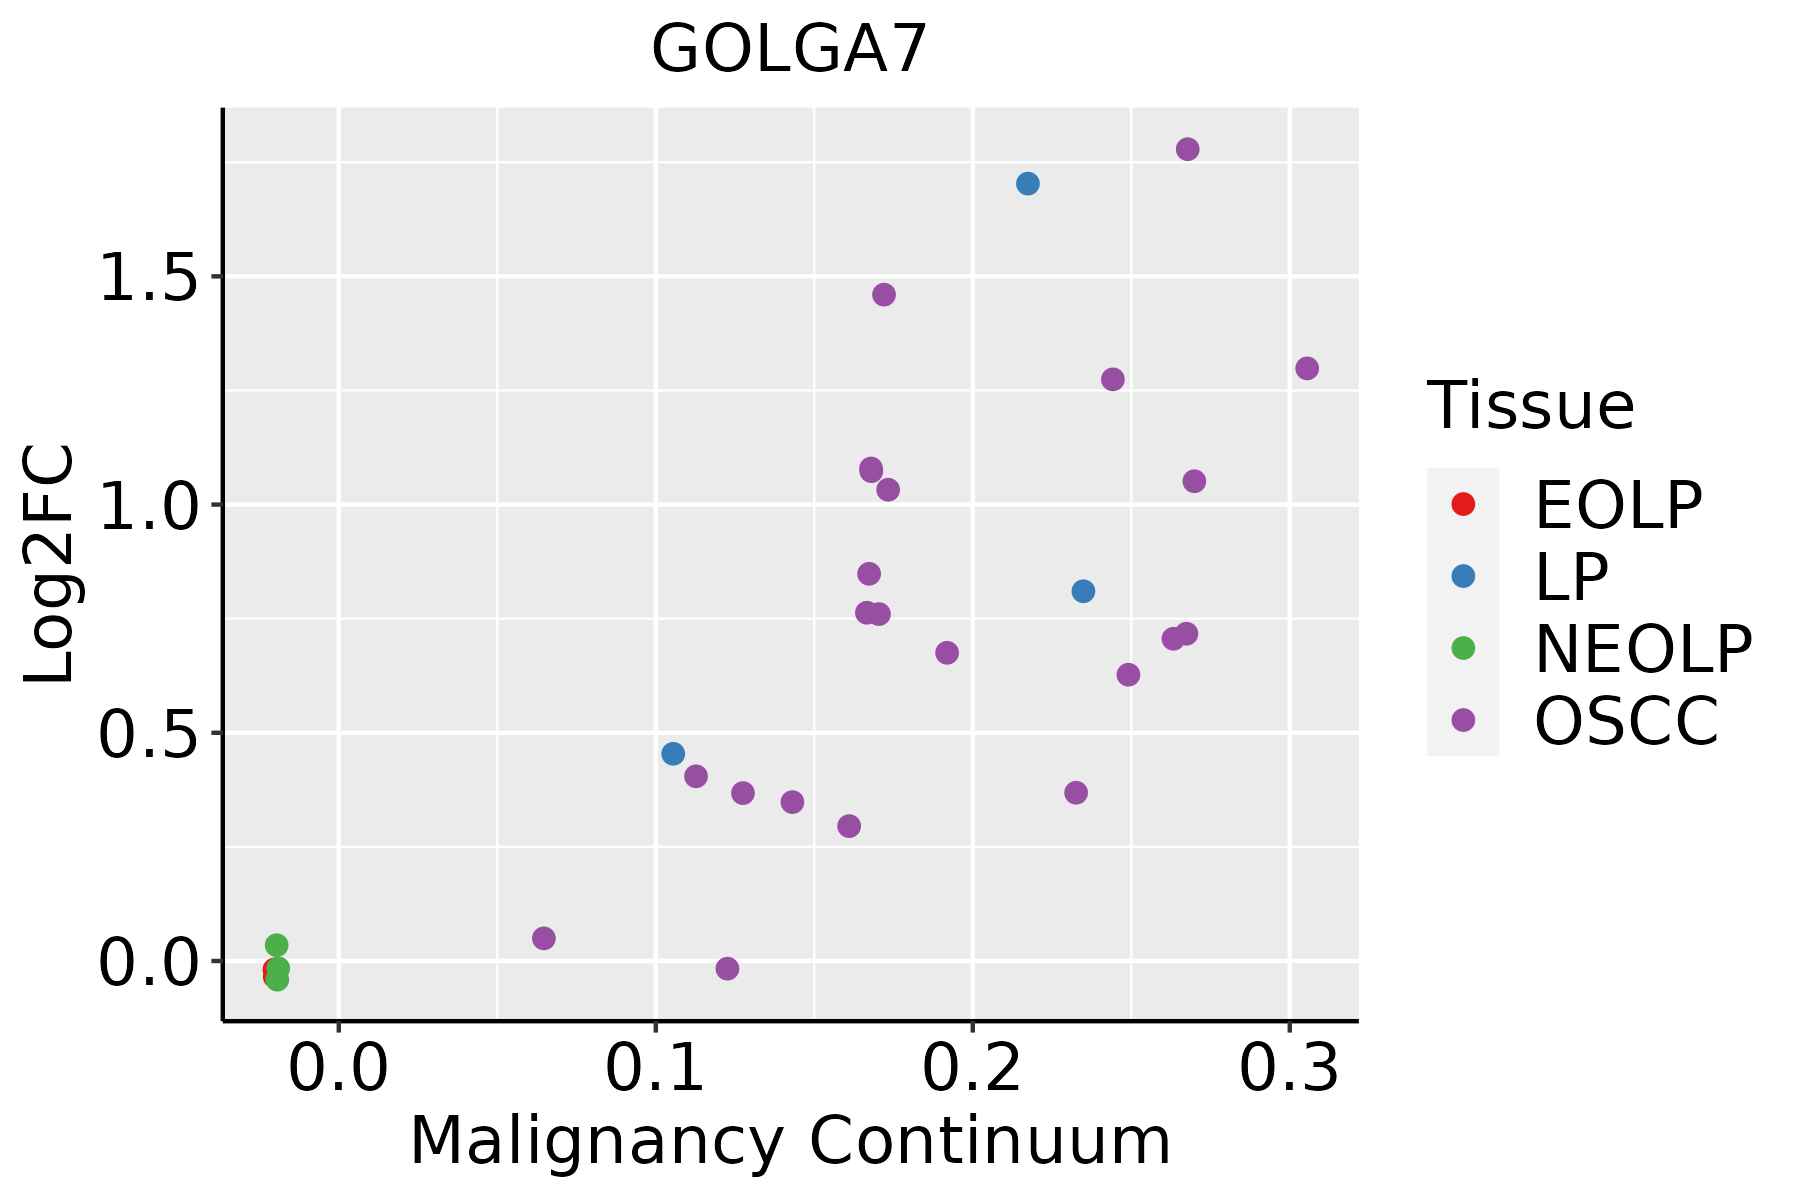 | EOLP: Erosive Oral lichen planus |
| LP: leukoplakia | ||
| NEOLP: Non-erosive oral lichen planus | ||
| OSCC: Oral squamous cell carcinoma | ||
| Skin | 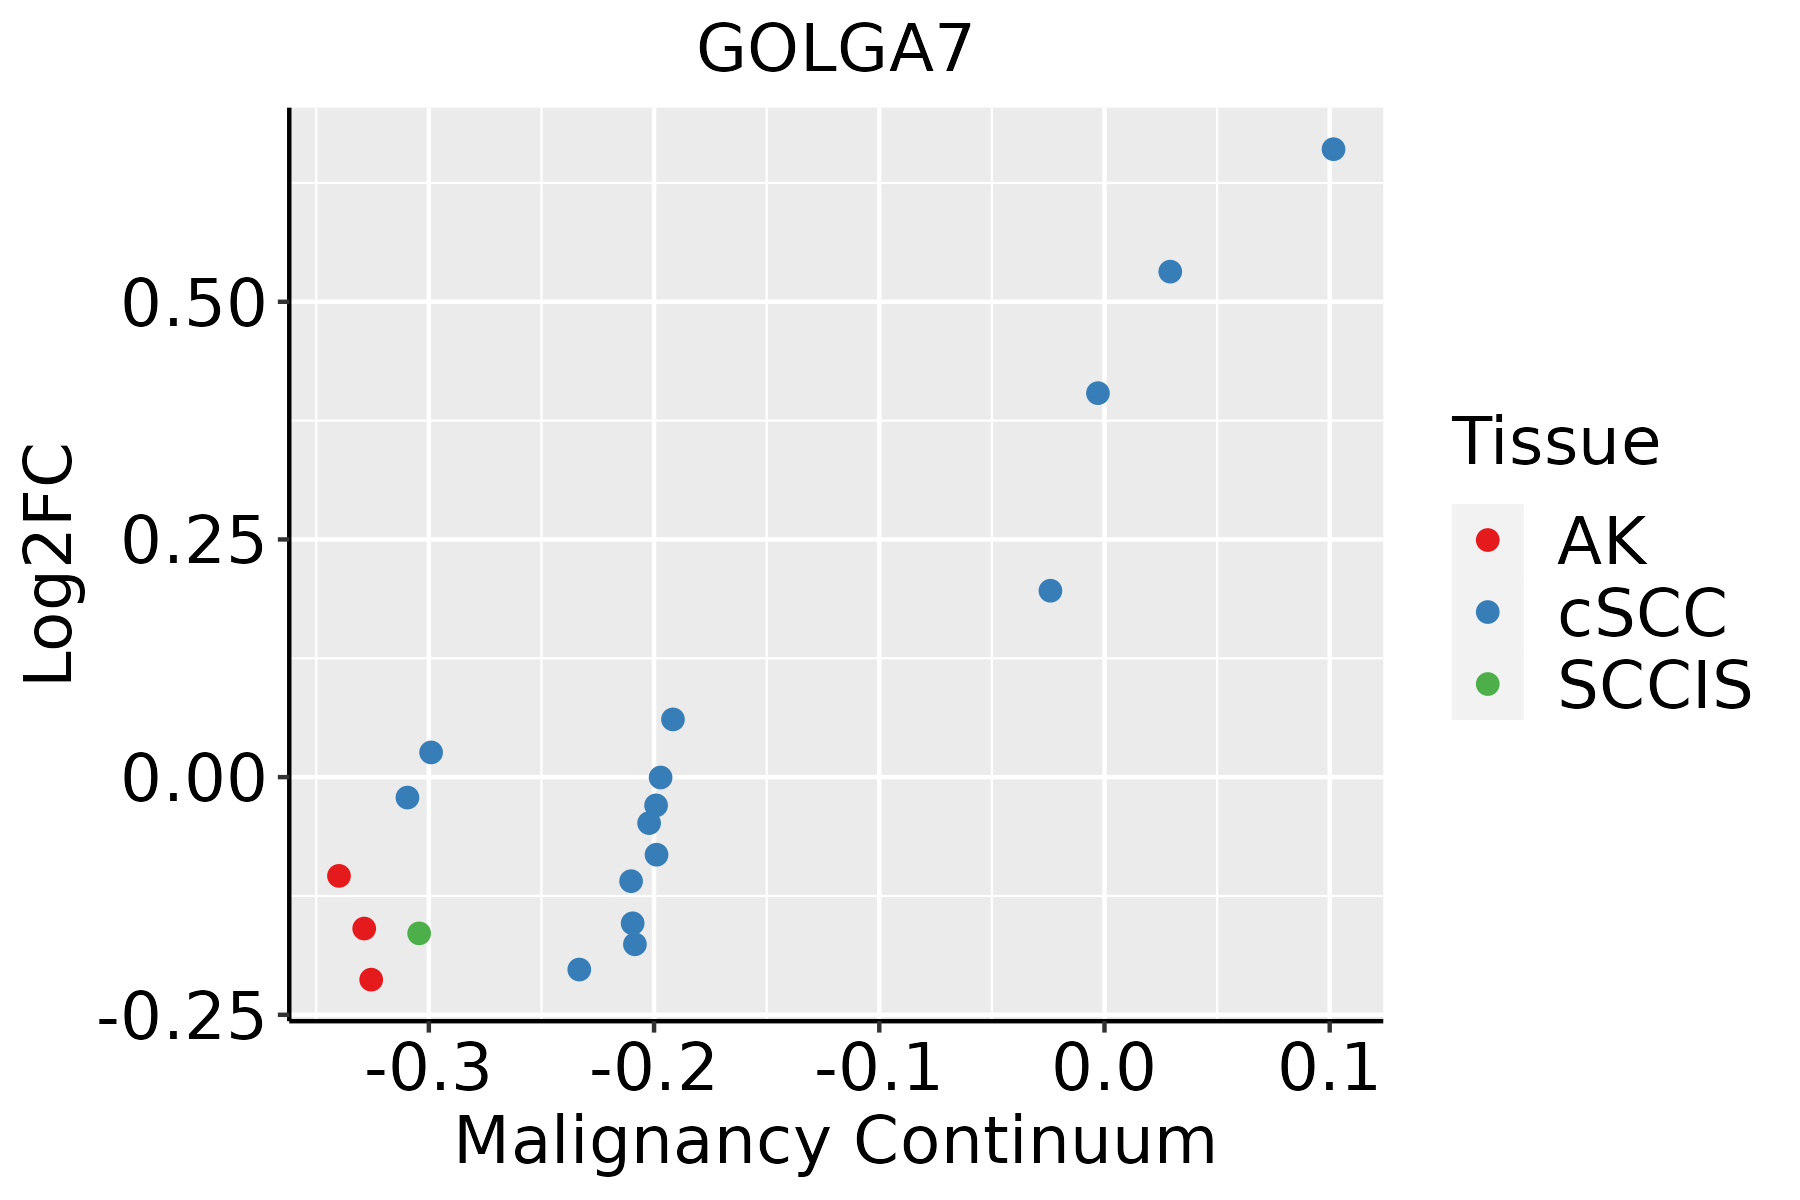 | AK: Actinic keratosis |
| cSCC: Cutaneous squamous cell carcinoma | ||
| SCCIS:squamous cell carcinoma in situ | ||
| Thyroid | 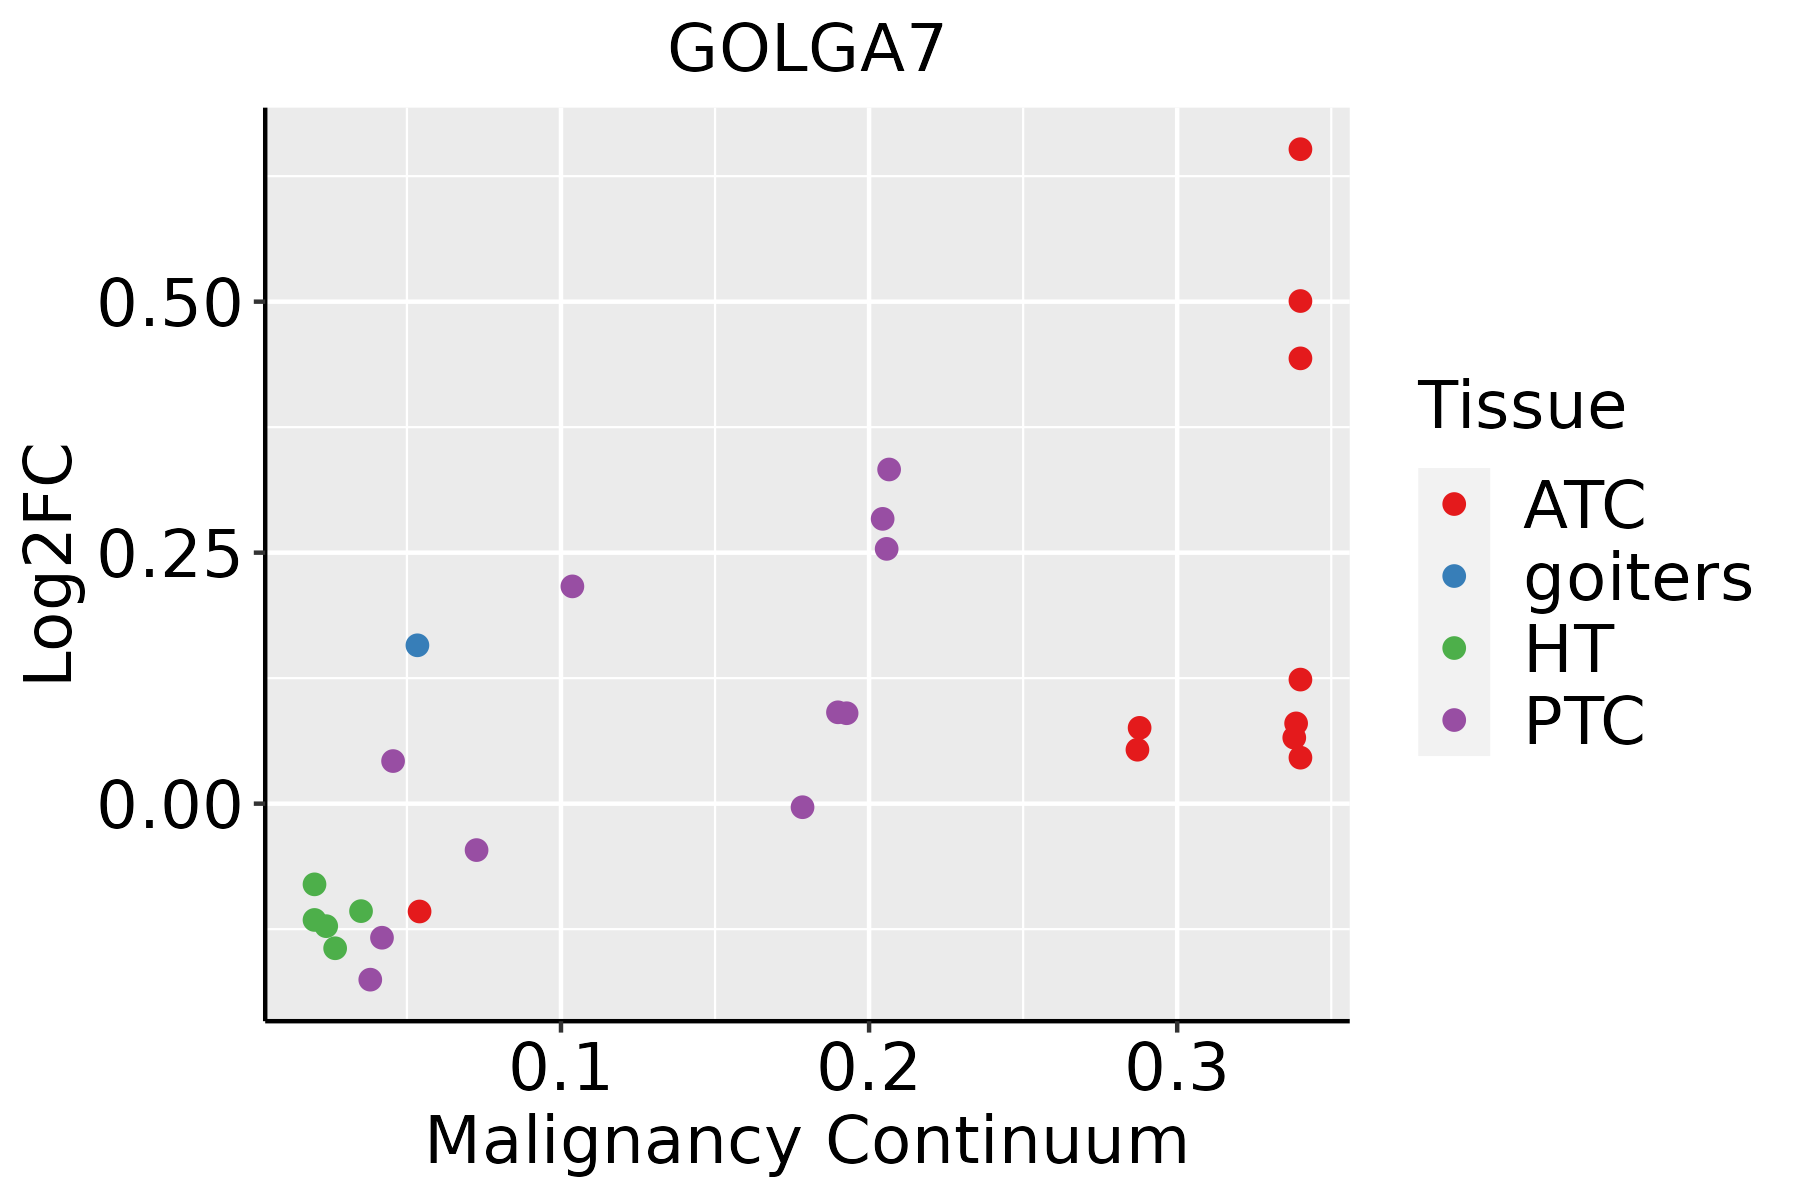 | ATC: Anaplastic thyroid cancer |
| HT: Hashimoto's thyroiditis | ||
| PTC: Papillary thyroid cancer |
| ∗log2FC in expression of this searched gene in stem-like cells from each diseased tissue sample relative to stem-like cells in normal samples in each tissue plotted against the malignancy continuum. Samples are colored based on if they are from different disease stage. |
Top |
Malignant transformation related pathway analysis |
| Find out the enriched GO biological processes and KEGG pathways involved in transition from healthy to precancer to cancer |
| Tissue | Disease Stage | Enriched GO biological Processes |
| Colorectum | AD |  |
| Colorectum | SER |  |
| Colorectum | MSS |  |
| Colorectum | MSI-H |  |
| Colorectum | FAP |  |
| ∗Top 15 enriched GO BP terms are showed in the bar plot of each disease state in each tissue. Each row represents a significant GO biological process which is colored according to the -log10(p.adjust). |
| Page: 1 2 3 4 5 6 7 8 9 |
| GO ID | Tissue | Disease Stage | Description | Gene Ratio | Bg Ratio | pvalue | p.adjust | Count |
| GO:003164727 | Esophagus | HGIN | regulation of protein stability | 96/2587 | 298/18723 | 2.21e-16 | 5.76e-14 | 96 |
| GO:005082127 | Esophagus | HGIN | protein stabilization | 64/2587 | 191/18723 | 3.11e-12 | 4.24e-10 | 64 |
| GO:004819317 | Esophagus | HGIN | Golgi vesicle transport | 83/2587 | 296/18723 | 8.59e-11 | 8.89e-09 | 83 |
| GO:000660525 | Esophagus | HGIN | protein targeting | 78/2587 | 314/18723 | 1.08e-07 | 5.47e-06 | 78 |
| GO:009015020 | Esophagus | HGIN | establishment of protein localization to membrane | 67/2587 | 260/18723 | 1.96e-07 | 9.57e-06 | 67 |
| GO:007265920 | Esophagus | HGIN | protein localization to plasma membrane | 66/2587 | 284/18723 | 1.11e-05 | 3.18e-04 | 66 |
| GO:009887610 | Esophagus | HGIN | vesicle-mediated transport to the plasma membrane | 36/2587 | 136/18723 | 6.76e-05 | 1.55e-03 | 36 |
| GO:199077818 | Esophagus | HGIN | protein localization to cell periphery | 71/2587 | 333/18723 | 1.05e-04 | 2.24e-03 | 71 |
| GO:00435435 | Esophagus | HGIN | protein acylation | 51/2587 | 243/18723 | 1.33e-03 | 1.57e-02 | 51 |
| GO:000689210 | Esophagus | HGIN | post-Golgi vesicle-mediated transport | 26/2587 | 104/18723 | 1.63e-03 | 1.81e-02 | 26 |
| GO:00430019 | Esophagus | HGIN | Golgi to plasma membrane protein transport | 13/2587 | 40/18723 | 2.04e-03 | 2.13e-02 | 13 |
| GO:00068939 | Esophagus | HGIN | Golgi to plasma membrane transport | 17/2587 | 60/18723 | 2.46e-03 | 2.45e-02 | 17 |
| GO:00619519 | Esophagus | HGIN | establishment of protein localization to plasma membrane | 17/2587 | 60/18723 | 2.46e-03 | 2.45e-02 | 17 |
| GO:004819318 | Esophagus | ESCC | Golgi vesicle transport | 231/8552 | 296/18723 | 1.82e-30 | 9.63e-28 | 231 |
| GO:0031647111 | Esophagus | ESCC | regulation of protein stability | 223/8552 | 298/18723 | 5.76e-25 | 1.52e-22 | 223 |
| GO:0006605111 | Esophagus | ESCC | protein targeting | 229/8552 | 314/18723 | 4.93e-23 | 1.01e-20 | 229 |
| GO:0090150110 | Esophagus | ESCC | establishment of protein localization to membrane | 182/8552 | 260/18723 | 1.27e-15 | 8.19e-14 | 182 |
| GO:0050821111 | Esophagus | ESCC | protein stabilization | 140/8552 | 191/18723 | 6.50e-15 | 3.61e-13 | 140 |
| GO:0072659110 | Esophagus | ESCC | protein localization to plasma membrane | 193/8552 | 284/18723 | 1.95e-14 | 1.03e-12 | 193 |
| GO:199077819 | Esophagus | ESCC | protein localization to cell periphery | 217/8552 | 333/18723 | 4.08e-13 | 1.88e-11 | 217 |
| Page: 1 2 3 4 5 6 7 8 |
| Pathway ID | Tissue | Disease Stage | Description | Gene Ratio | Bg Ratio | pvalue | p.adjust | qvalue | Count |
| Page: 1 |
Top |
Cell-cell communication analysis |
| Identification of potential cell-cell interactions between two cell types and their ligand-receptor pairs for different disease states |
| Ligand | Receptor | LRpair | Pathway | Tissue | Disease Stage |
| Page: 1 |
Top |
Single-cell gene regulatory network inference analysis |
| Find out the significant the regulons (TFs) and the target genes of each regulon across cell types for different disease states |
| TF | Cell Type | Tissue | Disease Stage | Target Gene | RSS | Regulon Activity |
| ∗The dot plots of a searched regulon are shown for all cell subpopulations in each disease state of each tissue based on the regulon specific score inferred using pySCENIC and by calculating the average expression. |
| Page: 1 |
Top |
Somatic mutation of malignant transformation related genes |
| Annotation of somatic variants for genes involved in malignant transformation |
| Hugo Symbol | Variant Class | Variant Classification | dbSNP RS | HGVSc | HGVSp | HGVSp Short | SWISSPROT | BIOTYPE | SIFT | PolyPhen | Tumor Sample Barcode | Tissue | Histology | Sex | Age | Stage | Therapy Types | Drugs | Outcome |
| GOLGA7 | SNV | Missense_Mutation | novel | c.362G>A | p.Arg121Gln | p.R121Q | Q7Z5G4 | protein_coding | deleterious(0) | probably_damaging(0.994) | TCGA-BH-A6R8-01 | Breast | breast invasive carcinoma | Female | <65 | I/II | Unknown | Unknown | SD |
| GOLGA7 | SNV | Missense_Mutation | c.185G>A | p.Gly62Asp | p.G62D | Q7Z5G4 | protein_coding | tolerated(0.12) | possibly_damaging(0.493) | TCGA-QG-A5YX-01 | Colorectum | colon adenocarcinoma | Female | <65 | I/II | Chemotherapy | xeloda | CR | |
| GOLGA7 | SNV | Missense_Mutation | novel | c.362G>A | p.Arg121Gln | p.R121Q | Q7Z5G4 | protein_coding | deleterious(0) | probably_damaging(0.994) | TCGA-A5-A0G2-01 | Endometrium | uterine corpus endometrioid carcinoma | Female | <65 | III/IV | Unknown | Unknown | SD |
| GOLGA7 | SNV | Missense_Mutation | novel | c.281N>T | p.Ser94Phe | p.S94F | Q7Z5G4 | protein_coding | deleterious(0) | possibly_damaging(0.748) | TCGA-AJ-A3EK-01 | Endometrium | uterine corpus endometrioid carcinoma | Female | <65 | I/II | Chemotherapy | carboplatin | CR |
| GOLGA7 | SNV | Missense_Mutation | novel | c.158T>A | p.Leu53His | p.L53H | Q7Z5G4 | protein_coding | tolerated(0.15) | possibly_damaging(0.821) | TCGA-BS-A0UF-01 | Endometrium | uterine corpus endometrioid carcinoma | Female | >=65 | I/II | Unknown | Unknown | SD |
| GOLGA7 | SNV | Missense_Mutation | c.199G>A | p.Glu67Lys | p.E67K | Q7Z5G4 | protein_coding | deleterious(0) | probably_damaging(0.989) | TCGA-D1-A167-01 | Endometrium | uterine corpus endometrioid carcinoma | Female | >=65 | I/II | Unknown | Unknown | SD | |
| GOLGA7 | SNV | Missense_Mutation | novel | c.241T>G | p.Cys81Gly | p.C81G | Q7Z5G4 | protein_coding | deleterious(0) | probably_damaging(0.998) | TCGA-EO-A3B0-01 | Endometrium | uterine corpus endometrioid carcinoma | Female | <65 | III/IV | Unknown | Unknown | SD |
| GOLGA7 | SNV | Missense_Mutation | c.353G>A | p.Arg118Gln | p.R118Q | Q7Z5G4 | protein_coding | deleterious(0) | probably_damaging(0.936) | TCGA-BR-6452-01 | Stomach | stomach adenocarcinoma | Female | >=65 | I/II | Unknown | Unknown | SD |
| Page: 1 |
Top |
Related drugs of malignant transformation related genes |
| Identification of chemicals and drugs interact with genes involved in malignant transfromation |
| (DGIdb 4.0) |
| Entrez ID | Symbol | Category | Interaction Types | Drug Claim Name | Drug Name | PMIDs |
| Page: 1 |

Copyright 2023-Present -The University of Texas Health Science Center at Houston |