
|
|||||
|
 | |
| |
| |
| |
| |
| |
|
Gene: GOLGA1 |
Gene summary for GOLGA1 |
| Gene information | Species | Human | Gene symbol | GOLGA1 | Gene ID | 2800 |
| Gene name | golgin A1 | |
| Gene Alias | golgin-97 | |
| Cytomap | 9q33.3 | |
| Gene Type | protein-coding | GO ID | GO:0000139 | UniProtAcc | A0A024R869 |
Top |
Malignant transformation analysis |
| Identification of the aberrant gene expression in precancerous and cancerous lesions by comparing the gene expression of stem-like cells in diseased tissues with normal stem cells |
| Entrez ID | Symbol | Replicates | Species | Organ | Tissue | Adj P-value | Log2FC | Malignancy |
| 2800 | GOLGA1 | C21 | Human | Oral cavity | OSCC | 1.57e-09 | 3.55e-01 | 0.2678 |
| 2800 | GOLGA1 | C30 | Human | Oral cavity | OSCC | 2.81e-14 | 5.69e-01 | 0.3055 |
| 2800 | GOLGA1 | C06 | Human | Oral cavity | OSCC | 3.42e-03 | 5.43e-01 | 0.2699 |
| 2800 | GOLGA1 | EOLP-1 | Human | Oral cavity | EOLP | 4.55e-05 | 1.21e-01 | -0.0202 |
| 2800 | GOLGA1 | SYSMH1 | Human | Oral cavity | OSCC | 6.85e-05 | 1.68e-01 | 0.1127 |
| 2800 | GOLGA1 | SYSMH2 | Human | Oral cavity | OSCC | 3.46e-04 | 1.75e-01 | 0.2326 |
| 2800 | GOLGA1 | SYSMH3 | Human | Oral cavity | OSCC | 6.52e-08 | 1.90e-01 | 0.2442 |
| Page: 1 |
| Tissue | Expression Dynamics | Abbreviation |
| Oral Cavity | 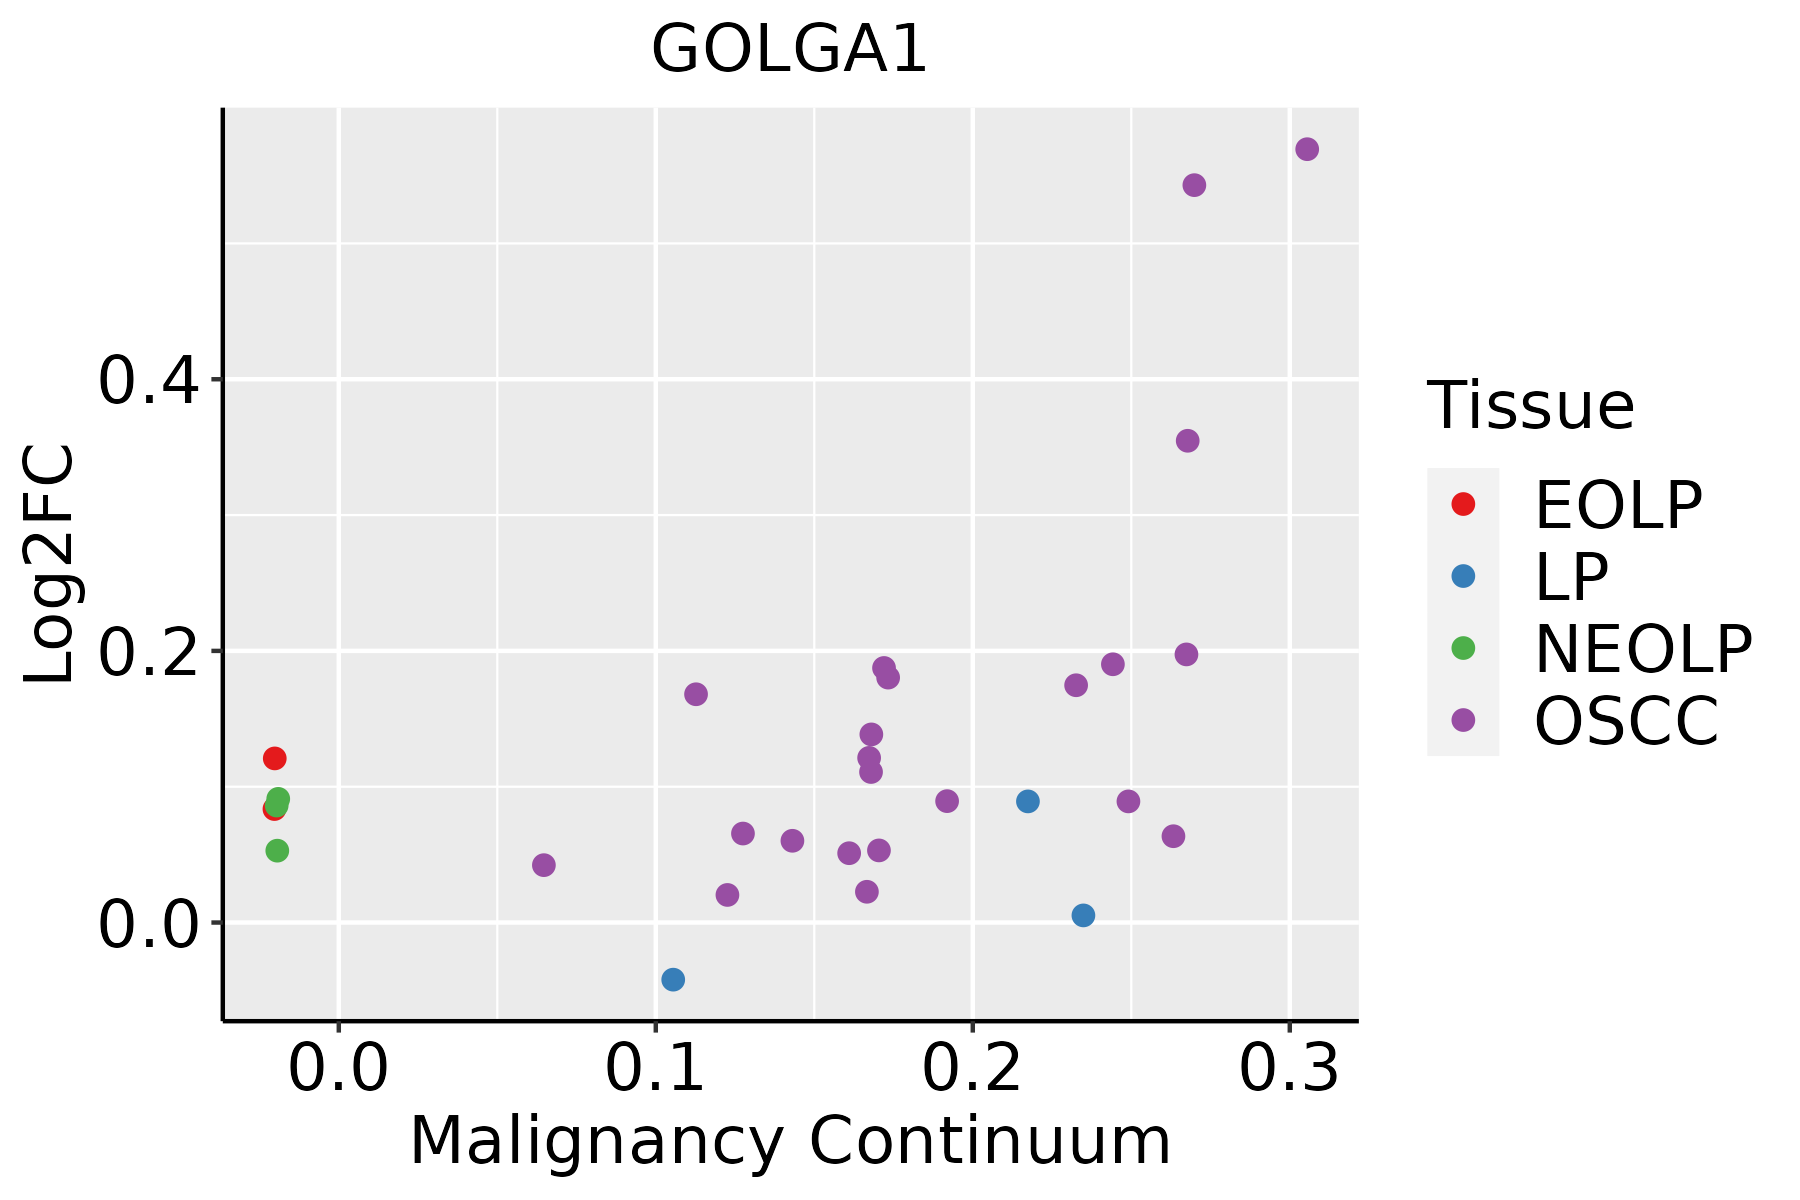 | EOLP: Erosive Oral lichen planus |
| LP: leukoplakia | ||
| NEOLP: Non-erosive oral lichen planus | ||
| OSCC: Oral squamous cell carcinoma |
| ∗log2FC in expression of this searched gene in stem-like cells from each diseased tissue sample relative to stem-like cells in normal samples in each tissue plotted against the malignancy continuum. Samples are colored based on if they are from different disease stage. |
Top |
Malignant transformation related pathway analysis |
| Find out the enriched GO biological processes and KEGG pathways involved in transition from healthy to precancer to cancer |
| Tissue | Disease Stage | Enriched GO biological Processes |
| Colorectum | AD |  |
| Colorectum | SER |  |
| Colorectum | MSS |  |
| Colorectum | MSI-H |  |
| Colorectum | FAP |  |
| ∗Top 15 enriched GO BP terms are showed in the bar plot of each disease state in each tissue. Each row represents a significant GO biological process which is colored according to the -log10(p.adjust). |
| Page: 1 2 3 4 5 6 7 8 9 |
| GO ID | Tissue | Disease Stage | Description | Gene Ratio | Bg Ratio | pvalue | p.adjust | Count |
| Page: 1 |
| Pathway ID | Tissue | Disease Stage | Description | Gene Ratio | Bg Ratio | pvalue | p.adjust | qvalue | Count |
| Page: 1 |
Top |
Cell-cell communication analysis |
| Identification of potential cell-cell interactions between two cell types and their ligand-receptor pairs for different disease states |
| Ligand | Receptor | LRpair | Pathway | Tissue | Disease Stage |
| Page: 1 |
Top |
Single-cell gene regulatory network inference analysis |
| Find out the significant the regulons (TFs) and the target genes of each regulon across cell types for different disease states |
| TF | Cell Type | Tissue | Disease Stage | Target Gene | RSS | Regulon Activity |
| ∗The dot plots of a searched regulon are shown for all cell subpopulations in each disease state of each tissue based on the regulon specific score inferred using pySCENIC and by calculating the average expression. |
| Page: 1 |
Top |
Somatic mutation of malignant transformation related genes |
| Annotation of somatic variants for genes involved in malignant transformation |
| Hugo Symbol | Variant Class | Variant Classification | dbSNP RS | HGVSc | HGVSp | HGVSp Short | SWISSPROT | BIOTYPE | SIFT | PolyPhen | Tumor Sample Barcode | Tissue | Histology | Sex | Age | Stage | Therapy Types | Drugs | Outcome |
| GOLGA1 | SNV | Missense_Mutation | novel | c.755N>A | p.Thr252Lys | p.T252K | Q92805 | protein_coding | tolerated(0.47) | benign(0.116) | TCGA-A2-A04Y-01 | Breast | breast invasive carcinoma | Female | <65 | I/II | Chemotherapy | cytoxan | SD |
| GOLGA1 | SNV | Missense_Mutation | c.125G>C | p.Gly42Ala | p.G42A | Q92805 | protein_coding | deleterious(0.01) | probably_damaging(0.997) | TCGA-AN-A0AL-01 | Breast | breast invasive carcinoma | Female | <65 | III/IV | Unknown | Unknown | SD | |
| GOLGA1 | SNV | Missense_Mutation | c.814N>G | p.Ile272Val | p.I272V | Q92805 | protein_coding | tolerated(0.08) | probably_damaging(0.952) | TCGA-C8-A12M-01 | Breast | breast invasive carcinoma | Female | >=65 | I/II | Unknown | Unknown | SD | |
| GOLGA1 | SNV | Missense_Mutation | novel | c.600A>T | p.Gln200His | p.Q200H | Q92805 | protein_coding | tolerated(0.05) | benign(0.003) | TCGA-C8-A3M7-01 | Breast | breast invasive carcinoma | Female | <65 | III/IV | Unknown | Unknown | PD |
| GOLGA1 | SNV | Missense_Mutation | c.1262N>T | p.Ala421Val | p.A421V | Q92805 | protein_coding | deleterious(0.01) | benign(0.115) | TCGA-D8-A1XQ-01 | Breast | breast invasive carcinoma | Female | >=65 | I/II | Unknown | Unknown | SD | |
| GOLGA1 | SNV | Missense_Mutation | novel | c.1261N>T | p.Ala421Ser | p.A421S | Q92805 | protein_coding | tolerated(0.15) | benign(0.007) | TCGA-D8-A1XQ-01 | Breast | breast invasive carcinoma | Female | >=65 | I/II | Unknown | Unknown | SD |
| GOLGA1 | insertion | Frame_Shift_Ins | novel | c.1831_1832insGGATAATAATGGCACCTACCTTGCAGAA | p.Val611GlyfsTer34 | p.V611Gfs*34 | Q92805 | protein_coding | TCGA-A8-A08P-01 | Breast | breast invasive carcinoma | Female | >=65 | III/IV | Chemotherapy | 5-fluorouracil | CR | ||
| GOLGA1 | insertion | Frame_Shift_Ins | novel | c.1333_1334insTC | p.Ala445ValfsTer22 | p.A445Vfs*22 | Q92805 | protein_coding | TCGA-A8-A0A4-01 | Breast | breast invasive carcinoma | Female | >=65 | I/II | Hormone Therapy | tamoxiphen | CR | ||
| GOLGA1 | insertion | Frame_Shift_Ins | novel | c.1331_1332insGATCTTATTGATCCCTTGGCAGCAGTCTTCTCTGAGAG | p.Asn444LysfsTer35 | p.N444Kfs*35 | Q92805 | protein_coding | TCGA-A8-A0A4-01 | Breast | breast invasive carcinoma | Female | >=65 | I/II | Hormone Therapy | tamoxiphen | CR | ||
| GOLGA1 | deletion | Frame_Shift_Del | novel | c.1066delN | p.Val356Ter | p.V356* | Q92805 | protein_coding | TCGA-D8-A27V-01 | Breast | breast invasive carcinoma | Female | <65 | I/II | Hormone Therapy | tamoxiphen | SD |
| Page: 1 2 3 4 5 6 7 8 |
Top |
Related drugs of malignant transformation related genes |
| Identification of chemicals and drugs interact with genes involved in malignant transfromation |
| (DGIdb 4.0) |
| Entrez ID | Symbol | Category | Interaction Types | Drug Claim Name | Drug Name | PMIDs |
| Page: 1 |

Copyright 2023-Present -The University of Texas Health Science Center at Houston |