
|
|||||
|
 | |
| |
| |
| |
| |
| |
|
Gene: GNS |
Gene summary for GNS |
| Gene information | Species | Human | Gene symbol | GNS | Gene ID | 2799 |
| Gene name | glucosamine (N-acetyl)-6-sulfatase | |
| Gene Alias | G6S | |
| Cytomap | 12q14.3 | |
| Gene Type | protein-coding | GO ID | GO:0006022 | UniProtAcc | A0A024RBC5 |
Top |
Malignant transformation analysis |
| Identification of the aberrant gene expression in precancerous and cancerous lesions by comparing the gene expression of stem-like cells in diseased tissues with normal stem cells |
| Entrez ID | Symbol | Replicates | Species | Organ | Tissue | Adj P-value | Log2FC | Malignancy |
| 2799 | GNS | HTA11_3410_2000001011 | Human | Colorectum | AD | 1.08e-03 | 1.51e-01 | 0.0155 |
| 2799 | GNS | HTA11_1938_2000001011 | Human | Colorectum | AD | 2.45e-13 | 5.78e-01 | -0.0811 |
| 2799 | GNS | HTA11_78_2000001011 | Human | Colorectum | AD | 3.52e-05 | 3.12e-01 | -0.1088 |
| 2799 | GNS | HTA11_347_2000001011 | Human | Colorectum | AD | 1.60e-20 | 5.20e-01 | -0.1954 |
| 2799 | GNS | HTA11_411_2000001011 | Human | Colorectum | SER | 2.42e-02 | 6.96e-01 | -0.2602 |
| 2799 | GNS | HTA11_83_2000001011 | Human | Colorectum | SER | 2.70e-03 | 3.72e-01 | -0.1526 |
| 2799 | GNS | HTA11_696_2000001011 | Human | Colorectum | AD | 1.33e-06 | 2.60e-01 | -0.1464 |
| 2799 | GNS | HTA11_1391_2000001011 | Human | Colorectum | AD | 8.80e-08 | 4.63e-01 | -0.059 |
| 2799 | GNS | HTA11_866_3004761011 | Human | Colorectum | AD | 1.93e-07 | 3.63e-01 | 0.096 |
| 2799 | GNS | HTA11_6818_2000001021 | Human | Colorectum | AD | 2.41e-04 | 3.34e-01 | 0.0588 |
| 2799 | GNS | HTA11_99999970781_79442 | Human | Colorectum | MSS | 6.45e-23 | 4.81e-01 | 0.294 |
| 2799 | GNS | HTA11_99999965062_69753 | Human | Colorectum | MSI-H | 8.16e-11 | 1.22e+00 | 0.3487 |
| 2799 | GNS | HTA11_99999965104_69814 | Human | Colorectum | MSS | 1.58e-07 | 4.50e-01 | 0.281 |
| 2799 | GNS | HTA11_99999971662_82457 | Human | Colorectum | MSS | 4.40e-13 | 5.53e-01 | 0.3859 |
| 2799 | GNS | LZE4T | Human | Esophagus | ESCC | 1.81e-06 | 1.47e-01 | 0.0811 |
| 2799 | GNS | LZE5T | Human | Esophagus | ESCC | 7.21e-04 | 2.18e-01 | 0.0514 |
| 2799 | GNS | LZE7T | Human | Esophagus | ESCC | 5.69e-03 | 1.37e-01 | 0.0667 |
| 2799 | GNS | LZE8T | Human | Esophagus | ESCC | 3.79e-05 | 5.74e-02 | 0.067 |
| 2799 | GNS | LZE20T | Human | Esophagus | ESCC | 2.90e-03 | 1.05e-01 | 0.0662 |
| 2799 | GNS | LZE22D1 | Human | Esophagus | HGIN | 5.92e-03 | 3.50e-03 | 0.0595 |
| Page: 1 2 3 4 5 6 7 |
| Tissue | Expression Dynamics | Abbreviation |
| Colorectum (GSE201348) | 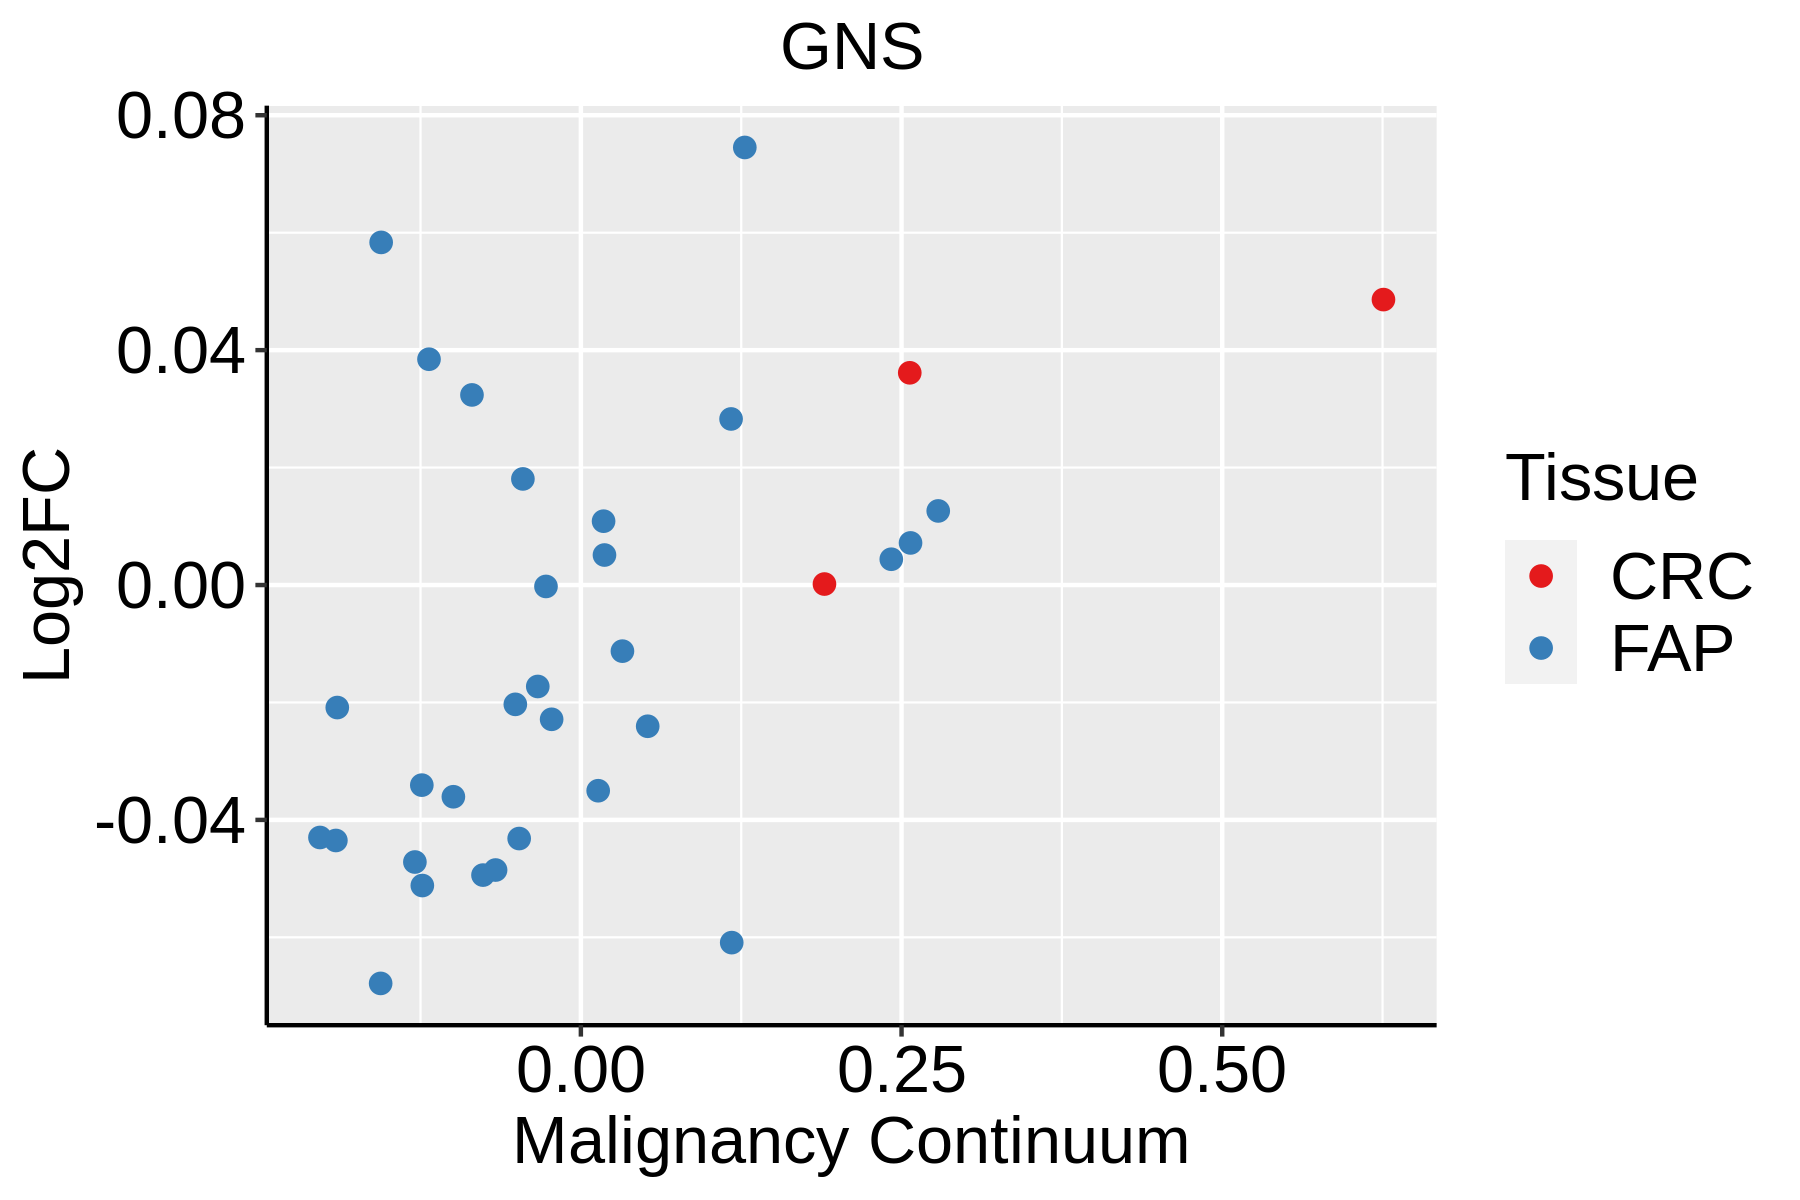 | FAP: Familial adenomatous polyposis |
| CRC: Colorectal cancer | ||
| Colorectum (HTA11) |  | AD: Adenomas |
| SER: Sessile serrated lesions | ||
| MSI-H: Microsatellite-high colorectal cancer | ||
| MSS: Microsatellite stable colorectal cancer | ||
| Esophagus | 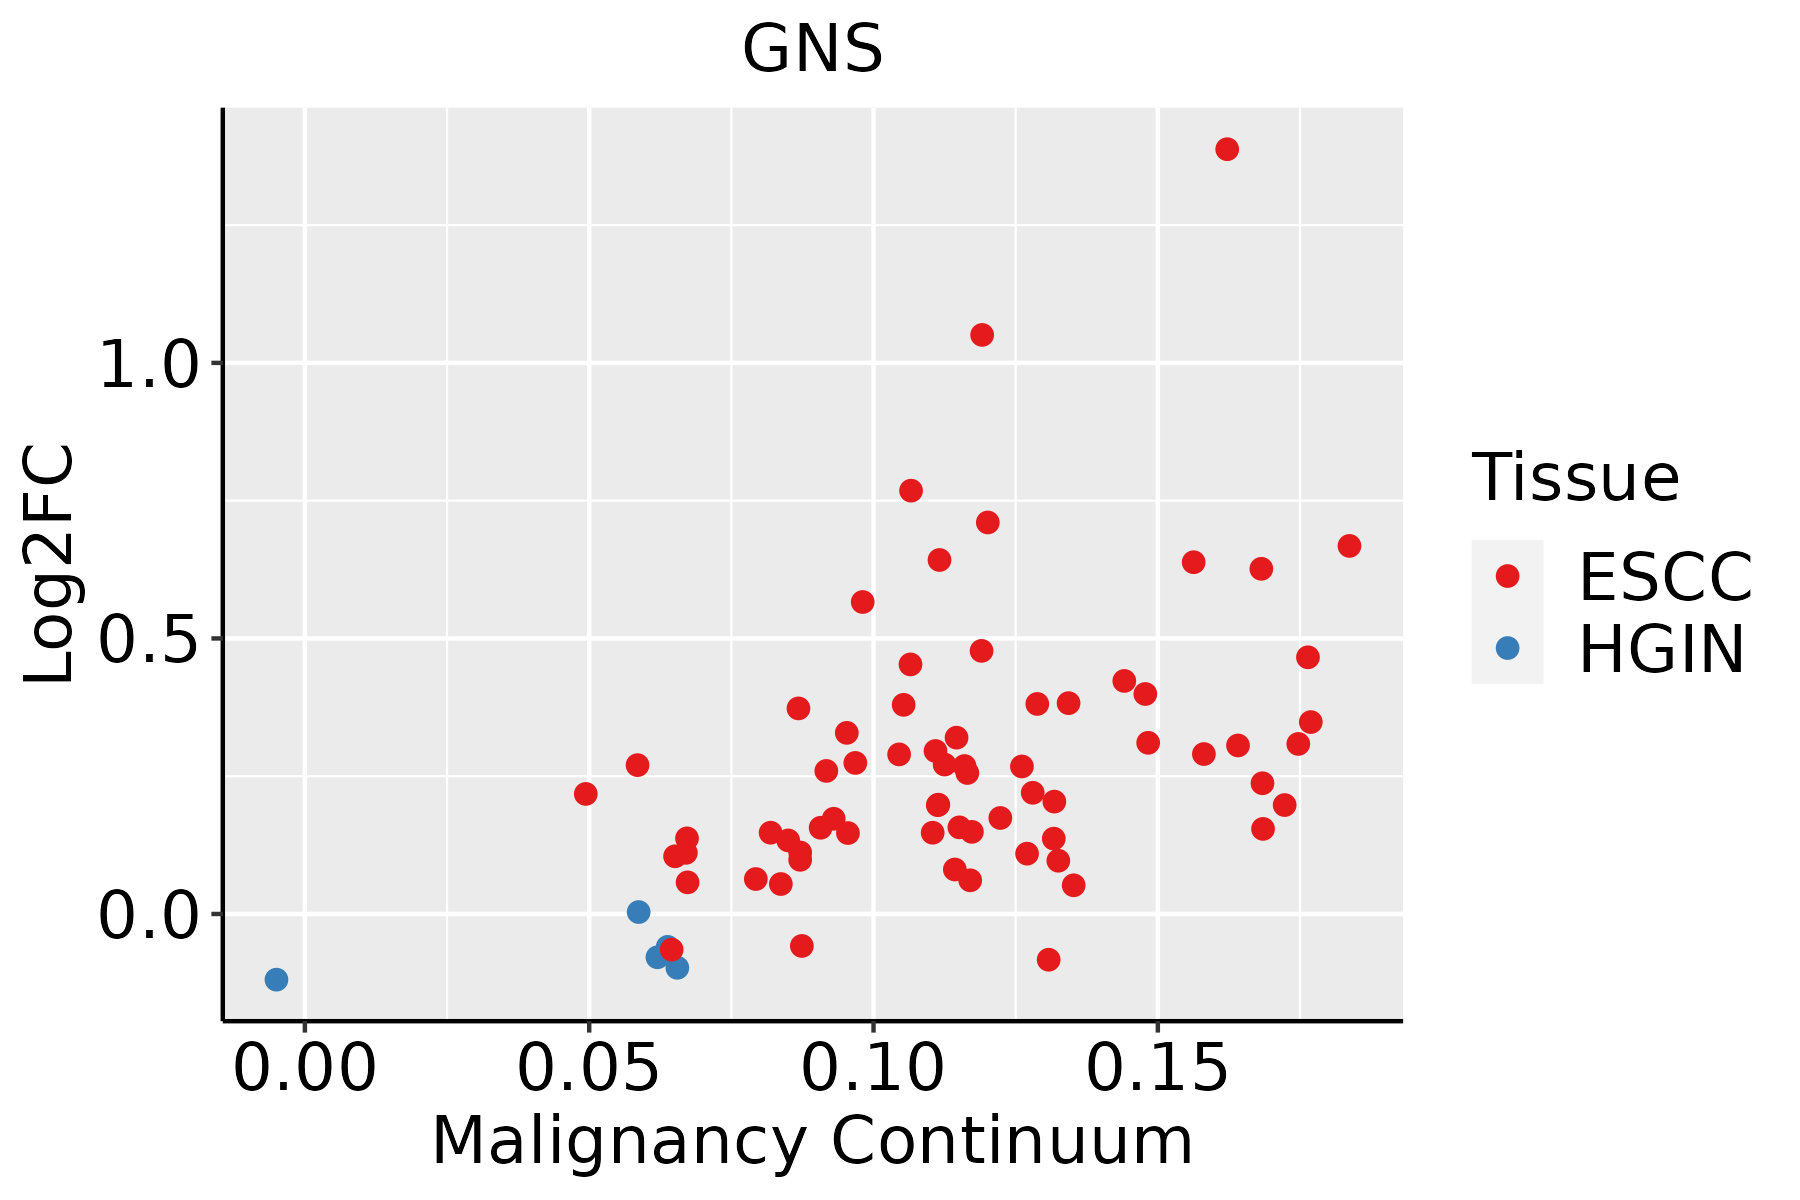 | ESCC: Esophageal squamous cell carcinoma |
| HGIN: High-grade intraepithelial neoplasias | ||
| LGIN: Low-grade intraepithelial neoplasias | ||
| Liver | 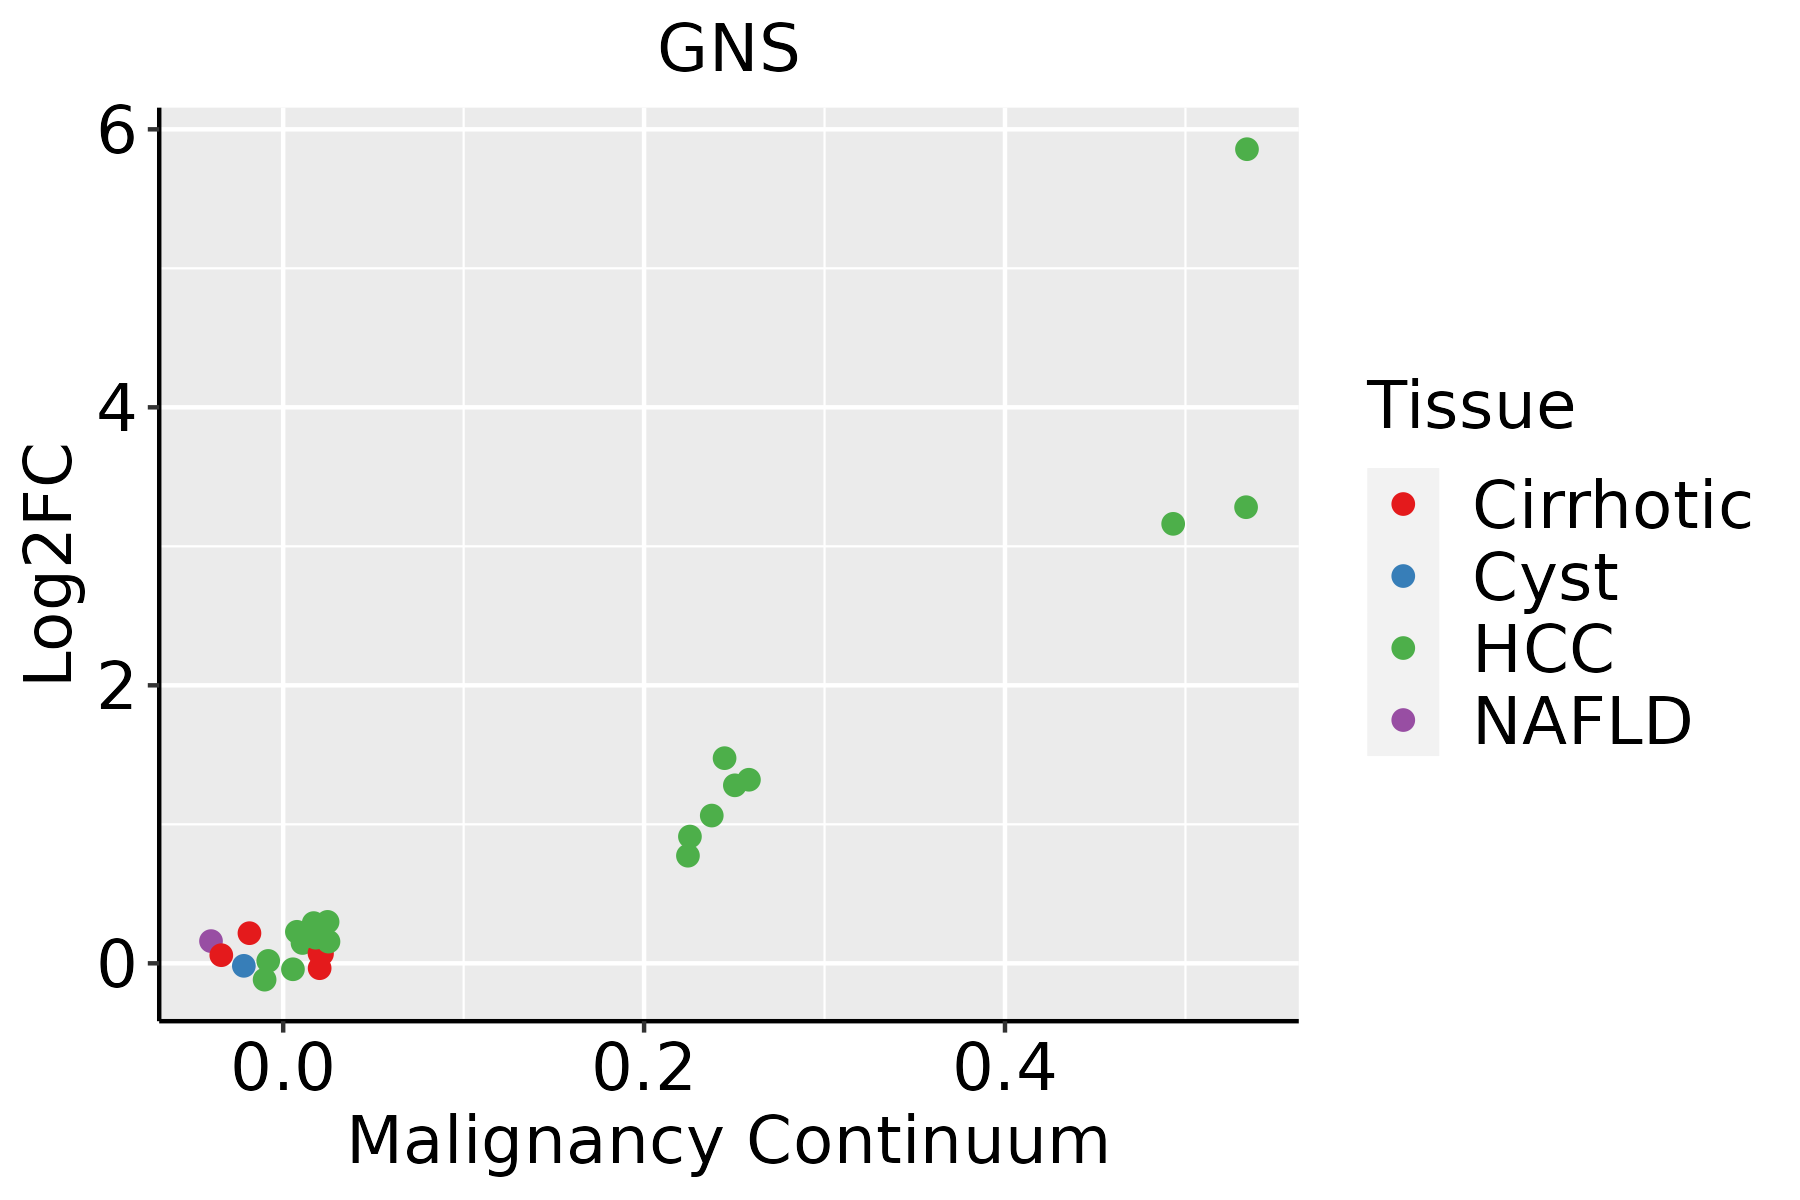 | HCC: Hepatocellular carcinoma |
| NAFLD: Non-alcoholic fatty liver disease | ||
| Oral Cavity | 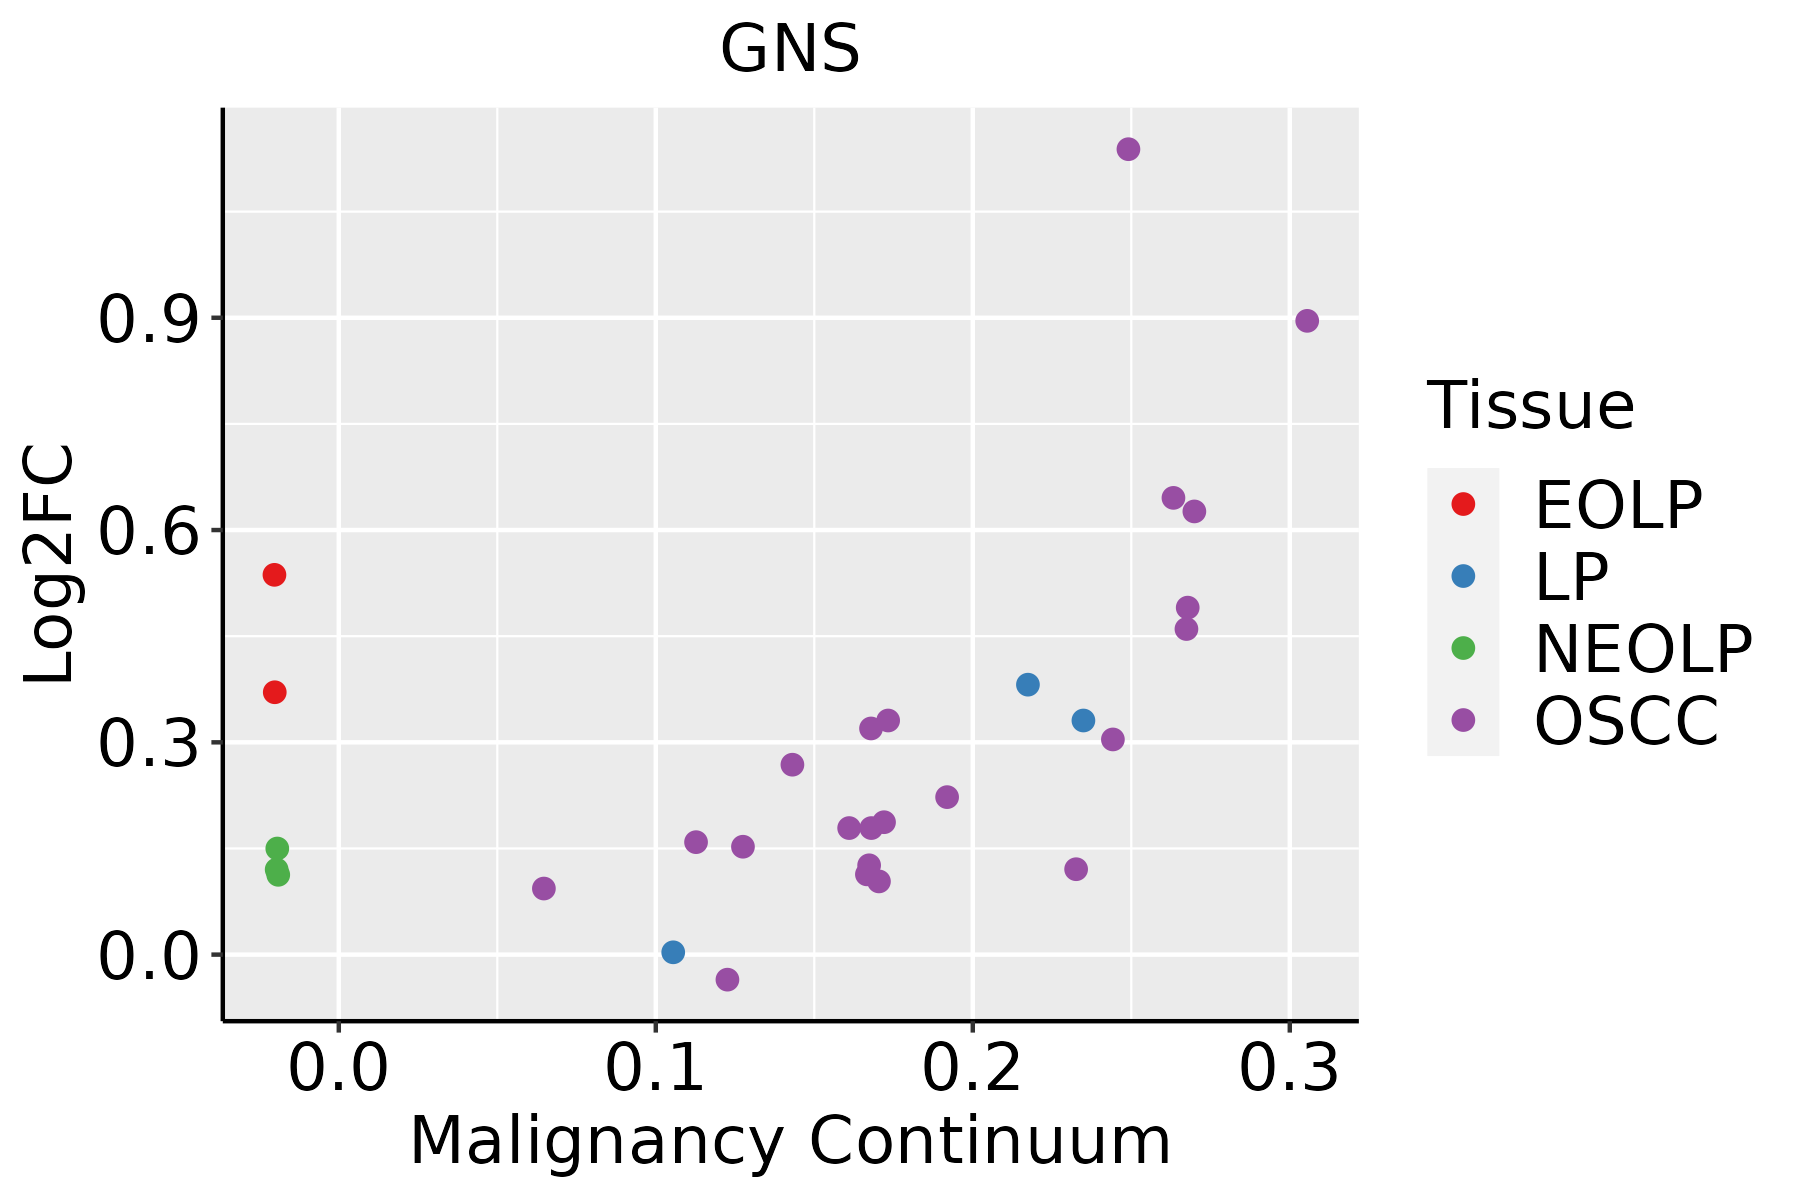 | EOLP: Erosive Oral lichen planus |
| LP: leukoplakia | ||
| NEOLP: Non-erosive oral lichen planus | ||
| OSCC: Oral squamous cell carcinoma | ||
| Thyroid | 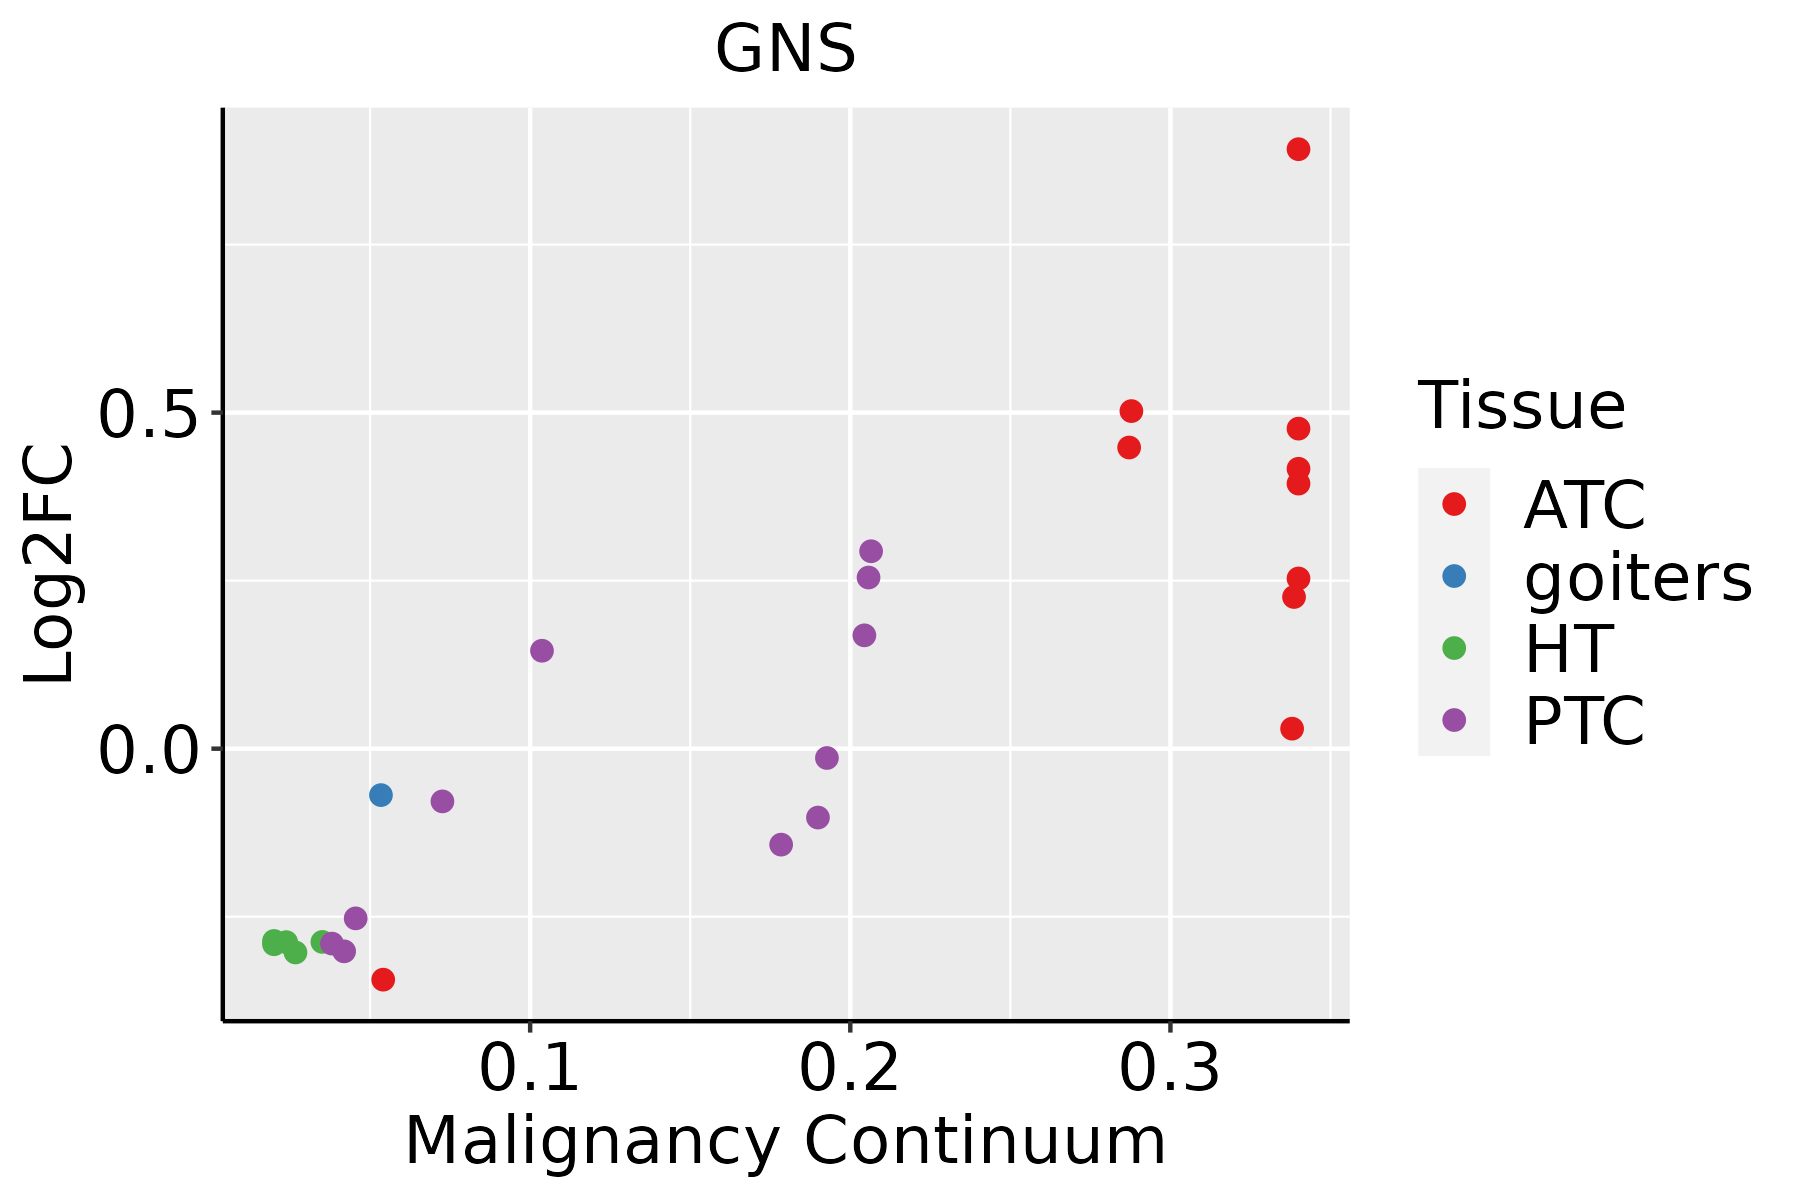 | ATC: Anaplastic thyroid cancer |
| HT: Hashimoto's thyroiditis | ||
| PTC: Papillary thyroid cancer |
| ∗log2FC in expression of this searched gene in stem-like cells from each diseased tissue sample relative to stem-like cells in normal samples in each tissue plotted against the malignancy continuum. Samples are colored based on if they are from different disease stage. |
Top |
Malignant transformation related pathway analysis |
| Find out the enriched GO biological processes and KEGG pathways involved in transition from healthy to precancer to cancer |
| Tissue | Disease Stage | Enriched GO biological Processes |
| Colorectum | AD |  |
| Colorectum | SER |  |
| Colorectum | MSS |  |
| Colorectum | MSI-H |  |
| Colorectum | FAP |  |
| ∗Top 15 enriched GO BP terms are showed in the bar plot of each disease state in each tissue. Each row represents a significant GO biological process which is colored according to the -log10(p.adjust). |
| Page: 1 2 3 4 5 6 7 8 9 |
| GO ID | Tissue | Disease Stage | Description | Gene Ratio | Bg Ratio | pvalue | p.adjust | Count |
| GO:0006790 | Colorectum | AD | sulfur compound metabolic process | 101/3918 | 339/18723 | 6.46e-05 | 1.07e-03 | 101 |
| GO:00067901 | Colorectum | SER | sulfur compound metabolic process | 73/2897 | 339/18723 | 1.75e-03 | 1.81e-02 | 73 |
| GO:00067902 | Colorectum | MSS | sulfur compound metabolic process | 85/3467 | 339/18723 | 1.52e-03 | 1.39e-02 | 85 |
| GO:00067906 | Esophagus | ESCC | sulfur compound metabolic process | 201/8552 | 339/18723 | 2.64e-07 | 3.94e-06 | 201 |
| GO:19011362 | Esophagus | ESCC | carbohydrate derivative catabolic process | 99/8552 | 172/18723 | 1.11e-03 | 5.54e-03 | 99 |
| GO:000679011 | Liver | Cirrhotic | sulfur compound metabolic process | 129/4634 | 339/18723 | 3.06e-08 | 1.04e-06 | 129 |
| GO:000679021 | Liver | HCC | sulfur compound metabolic process | 212/7958 | 339/18723 | 5.60e-14 | 3.39e-12 | 212 |
| GO:1901136 | Liver | HCC | carbohydrate derivative catabolic process | 98/7958 | 172/18723 | 8.71e-05 | 7.62e-04 | 98 |
| GO:00067905 | Oral cavity | OSCC | sulfur compound metabolic process | 168/7305 | 339/18723 | 4.50e-05 | 3.84e-04 | 168 |
| GO:19011361 | Oral cavity | OSCC | carbohydrate derivative catabolic process | 89/7305 | 172/18723 | 4.52e-04 | 2.73e-03 | 89 |
| GO:000679012 | Oral cavity | LP | sulfur compound metabolic process | 106/4623 | 339/18723 | 3.36e-03 | 2.25e-02 | 106 |
| GO:19011363 | Thyroid | ATC | carbohydrate derivative catabolic process | 73/6293 | 172/18723 | 9.43e-03 | 3.47e-02 | 73 |
| Page: 1 |
| Pathway ID | Tissue | Disease Stage | Description | Gene Ratio | Bg Ratio | pvalue | p.adjust | qvalue | Count |
| hsa04142 | Colorectum | SER | Lysosome | 38/1580 | 132/8465 | 2.87e-03 | 2.03e-02 | 1.47e-02 | 38 |
| hsa041421 | Colorectum | SER | Lysosome | 38/1580 | 132/8465 | 2.87e-03 | 2.03e-02 | 1.47e-02 | 38 |
| hsa041426 | Esophagus | HGIN | Lysosome | 33/1383 | 132/8465 | 6.65e-03 | 4.37e-02 | 3.47e-02 | 33 |
| hsa0414213 | Esophagus | HGIN | Lysosome | 33/1383 | 132/8465 | 6.65e-03 | 4.37e-02 | 3.47e-02 | 33 |
| hsa0414222 | Esophagus | ESCC | Lysosome | 102/4205 | 132/8465 | 5.11e-11 | 7.13e-10 | 3.65e-10 | 102 |
| hsa0414232 | Esophagus | ESCC | Lysosome | 102/4205 | 132/8465 | 5.11e-11 | 7.13e-10 | 3.65e-10 | 102 |
| hsa041424 | Liver | Cirrhotic | Lysosome | 68/2530 | 132/8465 | 1.34e-07 | 1.97e-06 | 1.21e-06 | 68 |
| hsa0414211 | Liver | Cirrhotic | Lysosome | 68/2530 | 132/8465 | 1.34e-07 | 1.97e-06 | 1.21e-06 | 68 |
| hsa041422 | Liver | HCC | Lysosome | 100/4020 | 132/8465 | 2.32e-11 | 4.31e-10 | 2.40e-10 | 100 |
| hsa041423 | Liver | HCC | Lysosome | 100/4020 | 132/8465 | 2.32e-11 | 4.31e-10 | 2.40e-10 | 100 |
| hsa041425 | Oral cavity | OSCC | Lysosome | 87/3704 | 132/8465 | 1.97e-07 | 1.35e-06 | 6.86e-07 | 87 |
| hsa0414212 | Oral cavity | OSCC | Lysosome | 87/3704 | 132/8465 | 1.97e-07 | 1.35e-06 | 6.86e-07 | 87 |
| hsa0414221 | Oral cavity | LP | Lysosome | 67/2418 | 132/8465 | 5.13e-08 | 7.77e-07 | 5.01e-07 | 67 |
| hsa0414231 | Oral cavity | LP | Lysosome | 67/2418 | 132/8465 | 5.13e-08 | 7.77e-07 | 5.01e-07 | 67 |
| Page: 1 |
Top |
Cell-cell communication analysis |
| Identification of potential cell-cell interactions between two cell types and their ligand-receptor pairs for different disease states |
| Ligand | Receptor | LRpair | Pathway | Tissue | Disease Stage |
| Page: 1 |
Top |
Single-cell gene regulatory network inference analysis |
| Find out the significant the regulons (TFs) and the target genes of each regulon across cell types for different disease states |
| TF | Cell Type | Tissue | Disease Stage | Target Gene | RSS | Regulon Activity |
| ∗The dot plots of a searched regulon are shown for all cell subpopulations in each disease state of each tissue based on the regulon specific score inferred using pySCENIC and by calculating the average expression. |
| Page: 1 |
Top |
Somatic mutation of malignant transformation related genes |
| Annotation of somatic variants for genes involved in malignant transformation |
| Hugo Symbol | Variant Class | Variant Classification | dbSNP RS | HGVSc | HGVSp | HGVSp Short | SWISSPROT | BIOTYPE | SIFT | PolyPhen | Tumor Sample Barcode | Tissue | Histology | Sex | Age | Stage | Therapy Types | Drugs | Outcome |
| GNS | SNV | Missense_Mutation | rs759333610 | c.1226N>A | p.Arg409Gln | p.R409Q | P15586 | protein_coding | deleterious(0.01) | probably_damaging(0.934) | TCGA-A2-A3XZ-01 | Breast | breast invasive carcinoma | Female | <65 | I/II | Chemotherapy | carboplatin | CR |
| GNS | SNV | Missense_Mutation | novel | c.1492G>A | p.Glu498Lys | p.E498K | P15586 | protein_coding | tolerated(0.7) | benign(0.013) | TCGA-PE-A5DE-01 | Breast | breast invasive carcinoma | Female | <65 | I/II | Chemotherapy | taxotere | CR |
| GNS | SNV | Missense_Mutation | rs759333610 | c.1226N>A | p.Arg409Gln | p.R409Q | P15586 | protein_coding | deleterious(0.01) | probably_damaging(0.934) | TCGA-S3-AA11-01 | Breast | breast invasive carcinoma | Female | >=65 | I/II | Hormone Therapy | letrozole | CR |
| GNS | insertion | Frame_Shift_Ins | novel | c.1019_1020insTCTGTGGGAAGAGTGTCCTGAGCAGGACGGT | p.Lys340AsnfsTer16 | p.K340Nfs*16 | P15586 | protein_coding | TCGA-AO-A0JD-01 | Breast | breast invasive carcinoma | Female | <65 | III/IV | Chemotherapy | cyclophosphamide | SD | ||
| GNS | insertion | Frame_Shift_Ins | novel | c.703_704insGAGGTGACATGATTAAGAACCACAACAACCCATGT | p.His235ArgfsTer47 | p.H235Rfs*47 | P15586 | protein_coding | TCGA-AQ-A04J-01 | Breast | breast invasive carcinoma | Female | <65 | I/II | Chemotherapy | cytoxan | SD | ||
| GNS | SNV | Missense_Mutation | c.1321N>A | p.Asp441Asn | p.D441N | P15586 | protein_coding | tolerated(0.07) | possibly_damaging(0.549) | TCGA-DS-A0VM-01 | Cervix | cervical & endocervical cancer | Female | <65 | I/II | Chemotherapy | cisplatin | PD | |
| GNS | SNV | Missense_Mutation | rs371990029 | c.223N>A | p.Gly75Arg | p.G75R | P15586 | protein_coding | deleterious(0) | benign(0.15) | TCGA-EA-A3HS-01 | Cervix | cervical & endocervical cancer | Female | <65 | I/II | Unknown | Unknown | SD |
| GNS | SNV | Missense_Mutation | c.1020G>C | p.Lys340Asn | p.K340N | P15586 | protein_coding | deleterious(0) | probably_damaging(1) | TCGA-JW-A5VL-01 | Cervix | cervical & endocervical cancer | Female | <65 | I/II | Unknown | Unknown | SD | |
| GNS | SNV | Missense_Mutation | rs767876998 | c.1579N>A | p.Gly527Arg | p.G527R | P15586 | protein_coding | tolerated_low_confidence(1) | benign(0) | TCGA-A6-6781-01 | Colorectum | colon adenocarcinoma | Male | <65 | III/IV | Chemotherapy | oxaliplatin | SD |
| GNS | SNV | Missense_Mutation | rs768332556 | c.1516N>T | p.Arg506Trp | p.R506W | P15586 | protein_coding | deleterious(0.03) | probably_damaging(0.951) | TCGA-AZ-4315-01 | Colorectum | colon adenocarcinoma | Male | <65 | I/II | Unknown | Unknown | SD |
| Page: 1 2 3 4 5 |
Top |
Related drugs of malignant transformation related genes |
| Identification of chemicals and drugs interact with genes involved in malignant transfromation |
| (DGIdb 4.0) |
| Entrez ID | Symbol | Category | Interaction Types | Drug Claim Name | Drug Name | PMIDs |
| Page: 1 |

Copyright 2023-Present -The University of Texas Health Science Center at Houston |