
|
|||||
|
 | |
| |
| |
| |
| |
| |
|
Gene: GNPTG |
Gene summary for GNPTG |
| Gene information | Species | Human | Gene symbol | GNPTG | Gene ID | 84572 |
| Gene name | N-acetylglucosamine-1-phosphate transferase subunit gamma | |
| Gene Alias | C16orf27 | |
| Cytomap | 16p13.3 | |
| Gene Type | protein-coding | GO ID | GO:0005975 | UniProtAcc | Q9UJJ9 |
Top |
Malignant transformation analysis |
| Identification of the aberrant gene expression in precancerous and cancerous lesions by comparing the gene expression of stem-like cells in diseased tissues with normal stem cells |
| Entrez ID | Symbol | Replicates | Species | Organ | Tissue | Adj P-value | Log2FC | Malignancy |
| 84572 | GNPTG | LZE4T | Human | Esophagus | ESCC | 2.37e-06 | 2.29e-01 | 0.0811 |
| 84572 | GNPTG | LZE7T | Human | Esophagus | ESCC | 9.79e-03 | 2.13e-01 | 0.0667 |
| 84572 | GNPTG | LZE8T | Human | Esophagus | ESCC | 6.19e-04 | 5.81e-02 | 0.067 |
| 84572 | GNPTG | LZE20T | Human | Esophagus | ESCC | 1.63e-12 | 5.26e-01 | 0.0662 |
| 84572 | GNPTG | LZE22D1 | Human | Esophagus | HGIN | 2.04e-03 | 3.18e-01 | 0.0595 |
| 84572 | GNPTG | LZE22T | Human | Esophagus | ESCC | 5.58e-04 | 5.09e-01 | 0.068 |
| 84572 | GNPTG | LZE24T | Human | Esophagus | ESCC | 2.27e-22 | 7.86e-01 | 0.0596 |
| 84572 | GNPTG | LZE21T | Human | Esophagus | ESCC | 1.11e-03 | 2.01e-01 | 0.0655 |
| 84572 | GNPTG | P1T-E | Human | Esophagus | ESCC | 3.40e-13 | 9.20e-01 | 0.0875 |
| 84572 | GNPTG | P2T-E | Human | Esophagus | ESCC | 1.30e-51 | 9.48e-01 | 0.1177 |
| 84572 | GNPTG | P4T-E | Human | Esophagus | ESCC | 1.88e-38 | 8.51e-01 | 0.1323 |
| 84572 | GNPTG | P5T-E | Human | Esophagus | ESCC | 1.88e-28 | 4.84e-01 | 0.1327 |
| 84572 | GNPTG | P8T-E | Human | Esophagus | ESCC | 2.07e-50 | 8.63e-01 | 0.0889 |
| 84572 | GNPTG | P9T-E | Human | Esophagus | ESCC | 3.79e-15 | 4.74e-01 | 0.1131 |
| 84572 | GNPTG | P10T-E | Human | Esophagus | ESCC | 3.72e-30 | 4.27e-01 | 0.116 |
| 84572 | GNPTG | P11T-E | Human | Esophagus | ESCC | 5.85e-34 | 1.27e+00 | 0.1426 |
| 84572 | GNPTG | P12T-E | Human | Esophagus | ESCC | 9.53e-57 | 1.10e+00 | 0.1122 |
| 84572 | GNPTG | P15T-E | Human | Esophagus | ESCC | 4.85e-44 | 8.95e-01 | 0.1149 |
| 84572 | GNPTG | P16T-E | Human | Esophagus | ESCC | 1.32e-34 | 5.30e-01 | 0.1153 |
| 84572 | GNPTG | P17T-E | Human | Esophagus | ESCC | 4.34e-19 | 7.96e-01 | 0.1278 |
| Page: 1 2 3 4 5 6 |
| Tissue | Expression Dynamics | Abbreviation |
| Esophagus | 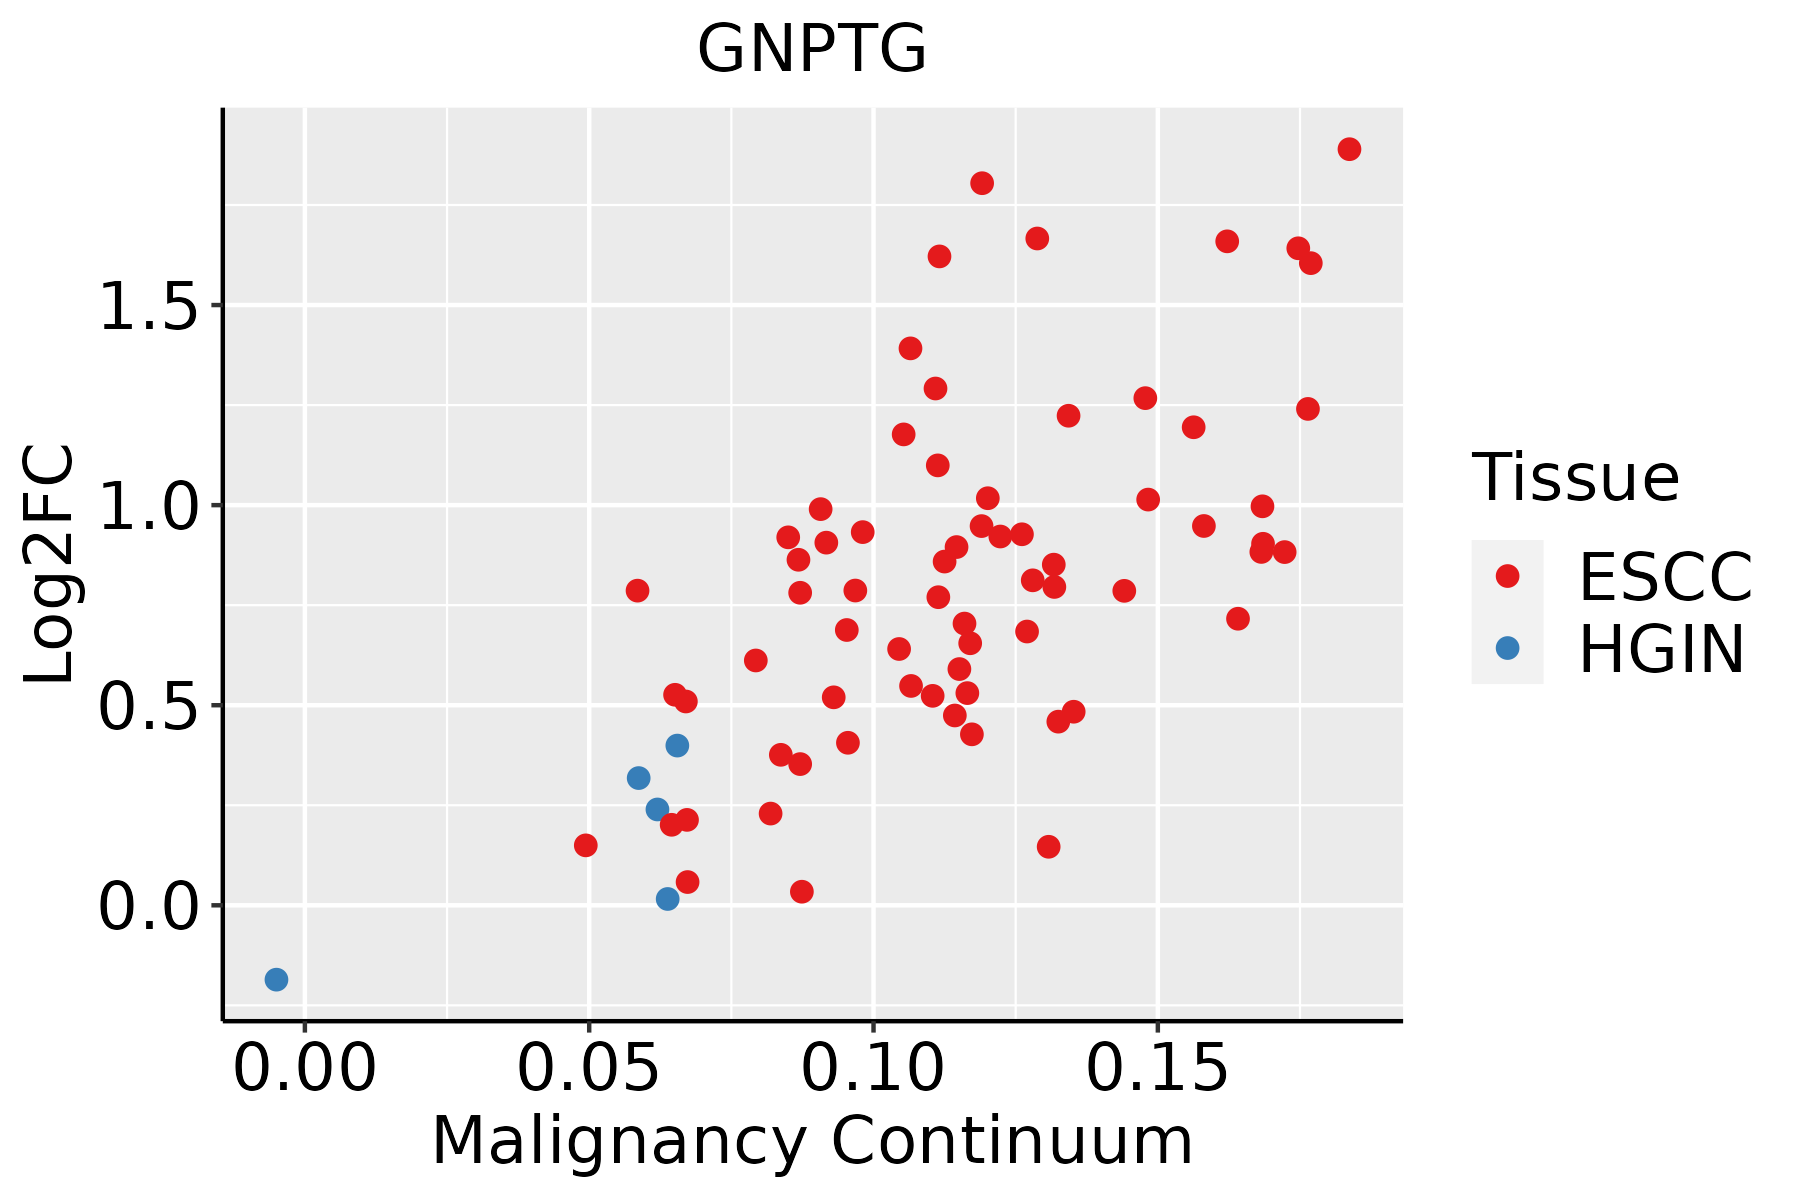 | ESCC: Esophageal squamous cell carcinoma |
| HGIN: High-grade intraepithelial neoplasias | ||
| LGIN: Low-grade intraepithelial neoplasias | ||
| Liver | 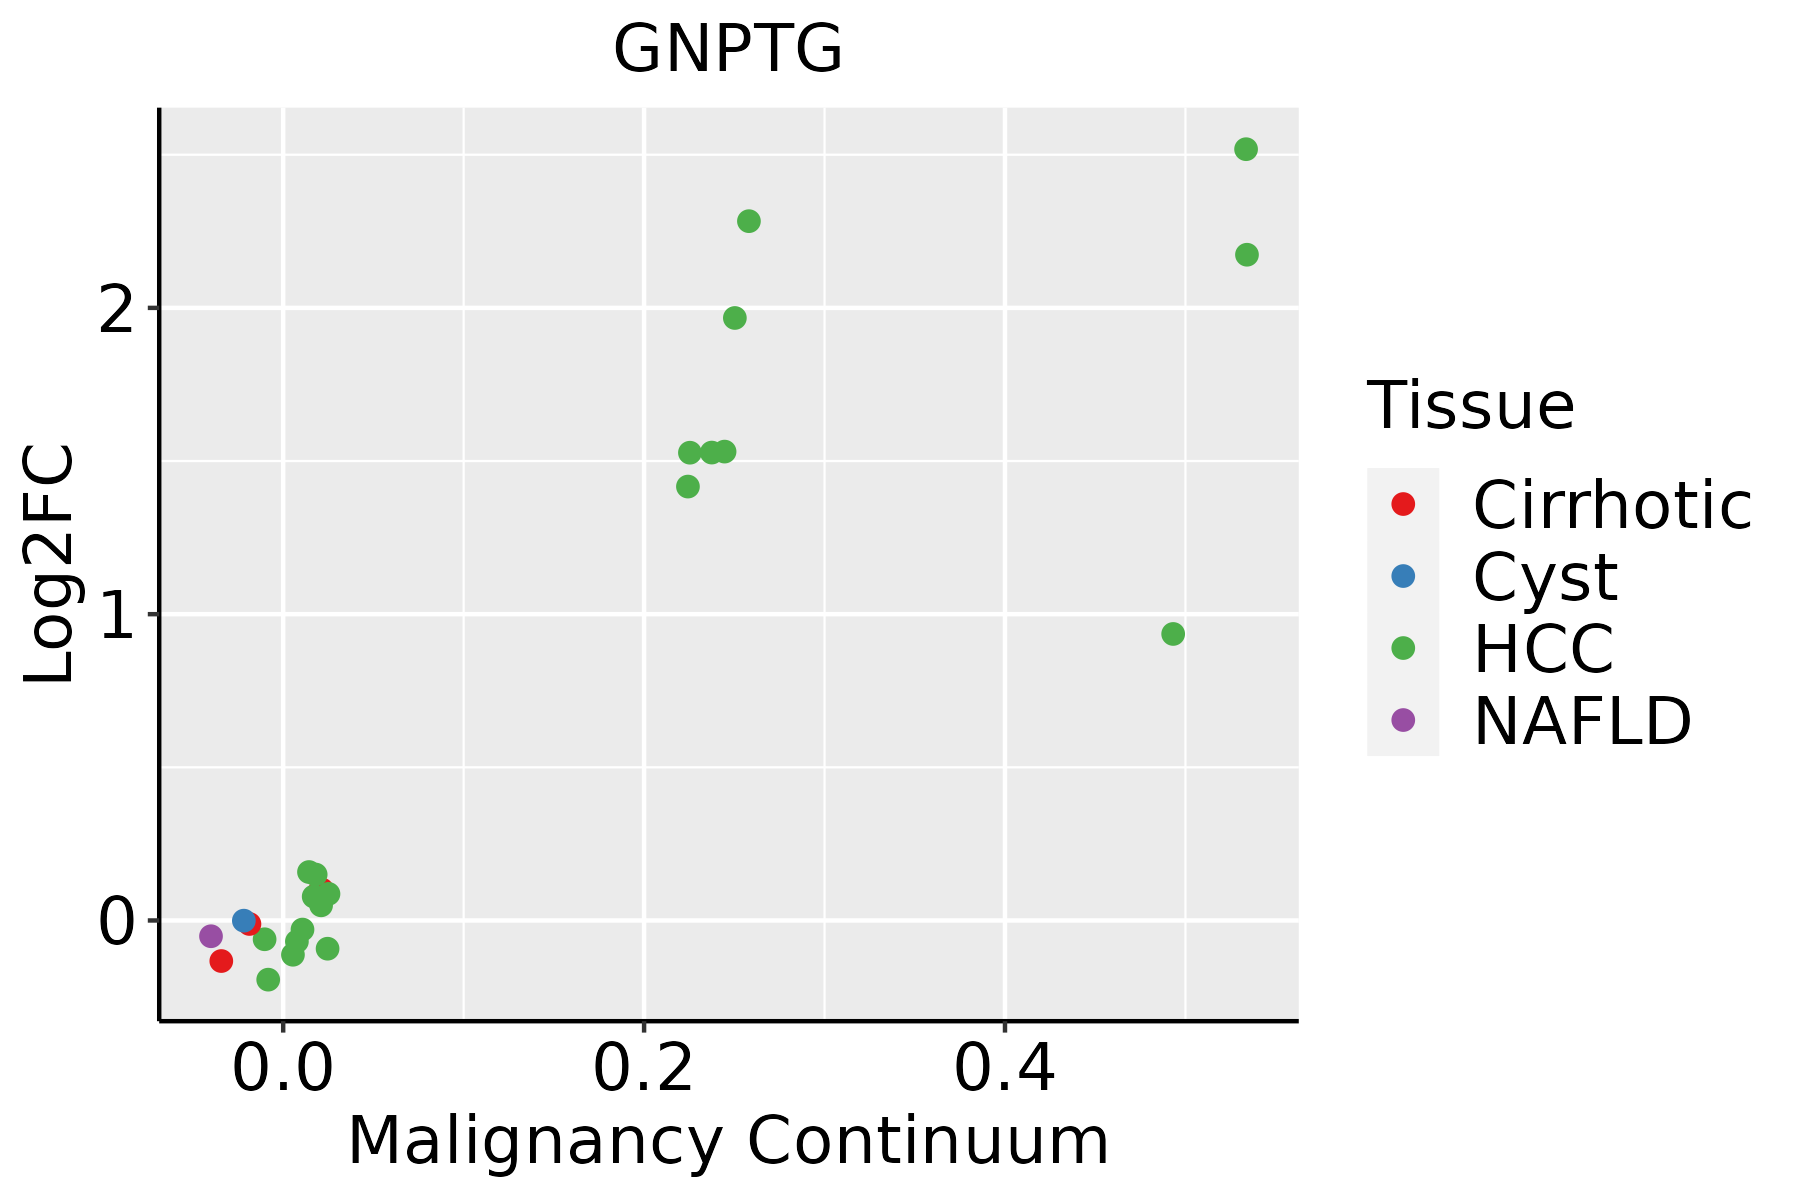 | HCC: Hepatocellular carcinoma |
| NAFLD: Non-alcoholic fatty liver disease | ||
| Oral Cavity | 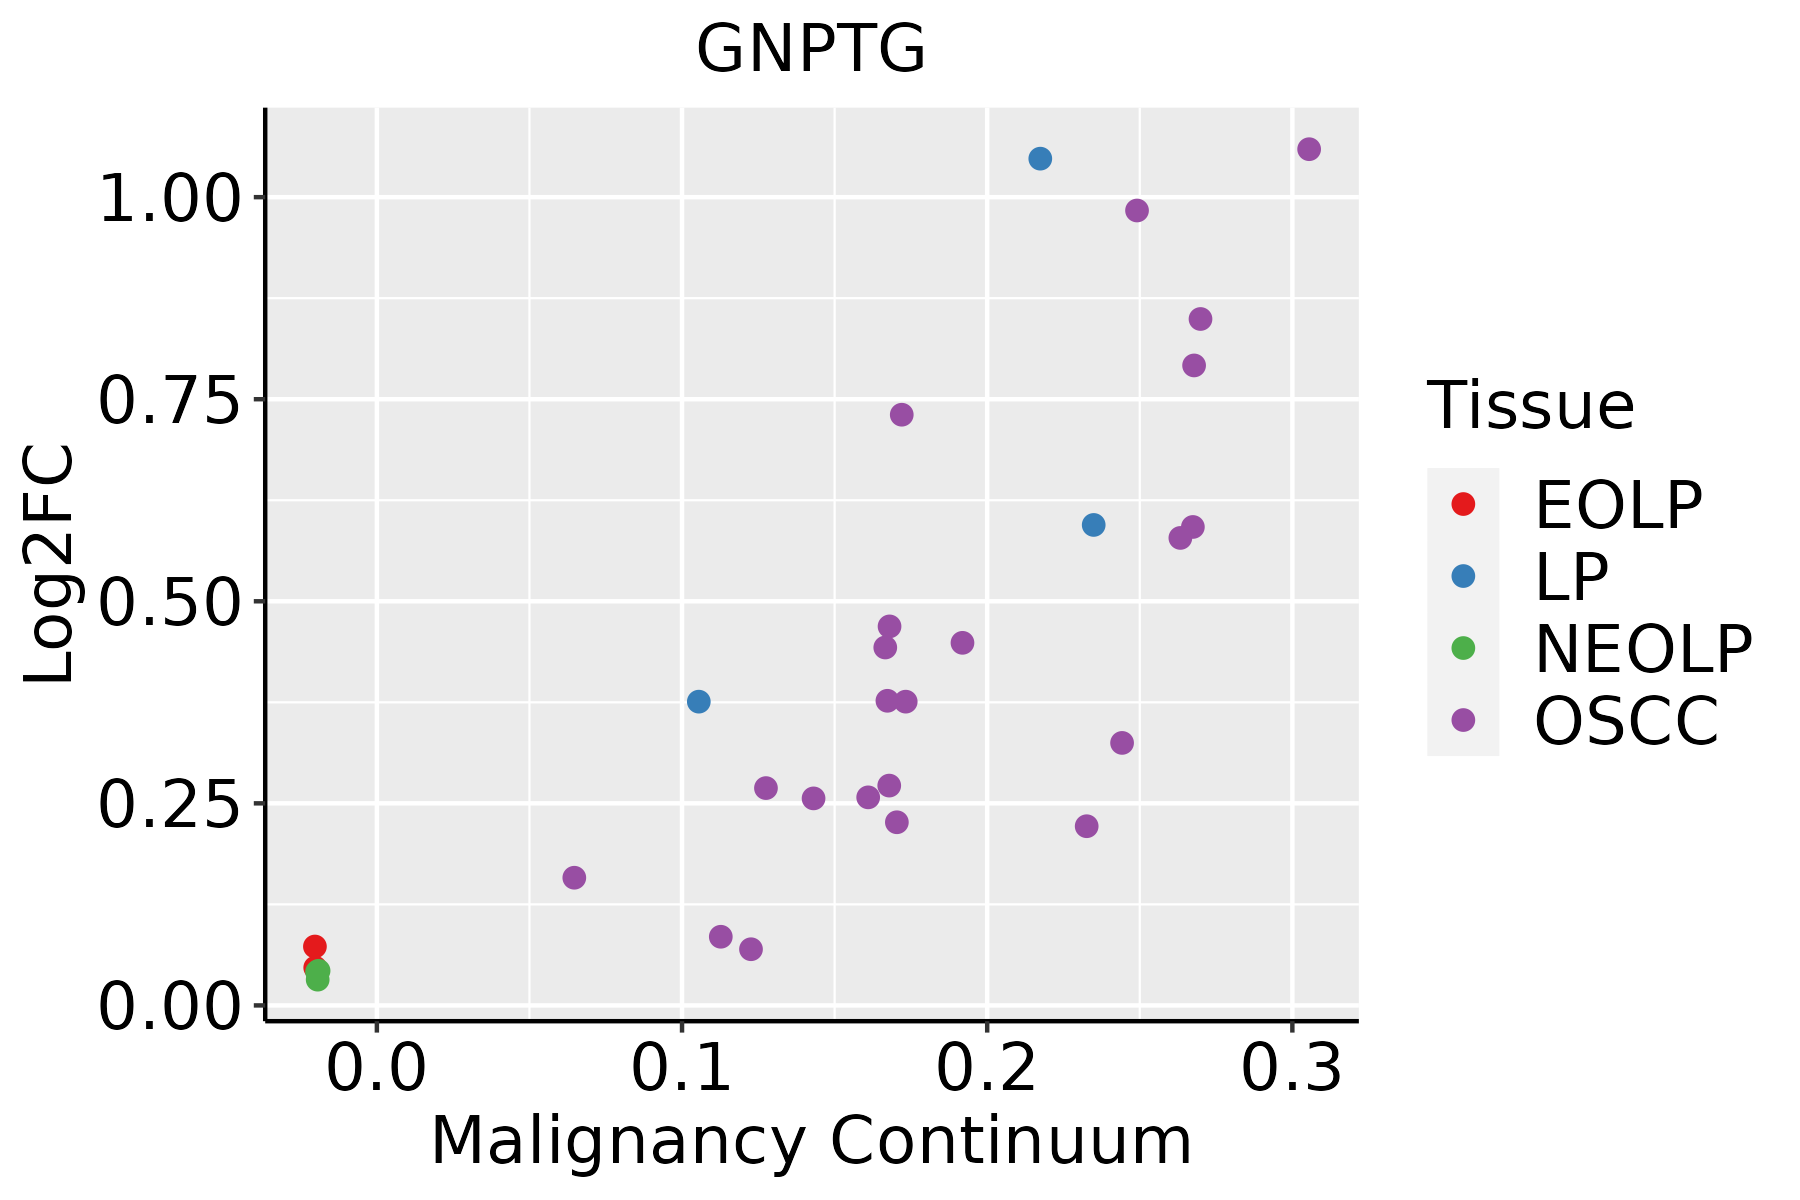 | EOLP: Erosive Oral lichen planus |
| LP: leukoplakia | ||
| NEOLP: Non-erosive oral lichen planus | ||
| OSCC: Oral squamous cell carcinoma | ||
| Thyroid |  | ATC: Anaplastic thyroid cancer |
| HT: Hashimoto's thyroiditis | ||
| PTC: Papillary thyroid cancer |
| ∗log2FC in expression of this searched gene in stem-like cells from each diseased tissue sample relative to stem-like cells in normal samples in each tissue plotted against the malignancy continuum. Samples are colored based on if they are from different disease stage. |
Top |
Malignant transformation related pathway analysis |
| Find out the enriched GO biological processes and KEGG pathways involved in transition from healthy to precancer to cancer |
| Tissue | Disease Stage | Enriched GO biological Processes |
| Colorectum | AD |  |
| Colorectum | SER |  |
| Colorectum | MSS |  |
| Colorectum | MSI-H |  |
| Colorectum | FAP |  |
| ∗Top 15 enriched GO BP terms are showed in the bar plot of each disease state in each tissue. Each row represents a significant GO biological process which is colored according to the -log10(p.adjust). |
| Page: 1 2 3 4 5 6 7 8 9 |
| GO ID | Tissue | Disease Stage | Description | Gene Ratio | Bg Ratio | pvalue | p.adjust | Count |
| GO:00442626 | Esophagus | ESCC | cellular carbohydrate metabolic process | 160/8552 | 283/18723 | 1.43e-04 | 9.66e-04 | 160 |
| GO:004426211 | Liver | Cirrhotic | cellular carbohydrate metabolic process | 97/4634 | 283/18723 | 1.89e-04 | 1.76e-03 | 97 |
| GO:004426221 | Liver | HCC | cellular carbohydrate metabolic process | 153/7958 | 283/18723 | 5.27e-05 | 5.00e-04 | 153 |
| GO:00442625 | Oral cavity | OSCC | cellular carbohydrate metabolic process | 130/7305 | 283/18723 | 9.98e-03 | 3.49e-02 | 130 |
| Page: 1 |
| Pathway ID | Tissue | Disease Stage | Description | Gene Ratio | Bg Ratio | pvalue | p.adjust | qvalue | Count |
| hsa041426 | Esophagus | HGIN | Lysosome | 33/1383 | 132/8465 | 6.65e-03 | 4.37e-02 | 3.47e-02 | 33 |
| hsa0414213 | Esophagus | HGIN | Lysosome | 33/1383 | 132/8465 | 6.65e-03 | 4.37e-02 | 3.47e-02 | 33 |
| hsa0414222 | Esophagus | ESCC | Lysosome | 102/4205 | 132/8465 | 5.11e-11 | 7.13e-10 | 3.65e-10 | 102 |
| hsa0414232 | Esophagus | ESCC | Lysosome | 102/4205 | 132/8465 | 5.11e-11 | 7.13e-10 | 3.65e-10 | 102 |
| hsa041424 | Liver | Cirrhotic | Lysosome | 68/2530 | 132/8465 | 1.34e-07 | 1.97e-06 | 1.21e-06 | 68 |
| hsa0414211 | Liver | Cirrhotic | Lysosome | 68/2530 | 132/8465 | 1.34e-07 | 1.97e-06 | 1.21e-06 | 68 |
| hsa041422 | Liver | HCC | Lysosome | 100/4020 | 132/8465 | 2.32e-11 | 4.31e-10 | 2.40e-10 | 100 |
| hsa041423 | Liver | HCC | Lysosome | 100/4020 | 132/8465 | 2.32e-11 | 4.31e-10 | 2.40e-10 | 100 |
| hsa041425 | Oral cavity | OSCC | Lysosome | 87/3704 | 132/8465 | 1.97e-07 | 1.35e-06 | 6.86e-07 | 87 |
| hsa0414212 | Oral cavity | OSCC | Lysosome | 87/3704 | 132/8465 | 1.97e-07 | 1.35e-06 | 6.86e-07 | 87 |
| hsa0414221 | Oral cavity | LP | Lysosome | 67/2418 | 132/8465 | 5.13e-08 | 7.77e-07 | 5.01e-07 | 67 |
| hsa0414231 | Oral cavity | LP | Lysosome | 67/2418 | 132/8465 | 5.13e-08 | 7.77e-07 | 5.01e-07 | 67 |
| Page: 1 |
Top |
Cell-cell communication analysis |
| Identification of potential cell-cell interactions between two cell types and their ligand-receptor pairs for different disease states |
| Ligand | Receptor | LRpair | Pathway | Tissue | Disease Stage |
| Page: 1 |
Top |
Single-cell gene regulatory network inference analysis |
| Find out the significant the regulons (TFs) and the target genes of each regulon across cell types for different disease states |
| TF | Cell Type | Tissue | Disease Stage | Target Gene | RSS | Regulon Activity |
| ∗The dot plots of a searched regulon are shown for all cell subpopulations in each disease state of each tissue based on the regulon specific score inferred using pySCENIC and by calculating the average expression. |
| Page: 1 |
Top |
Somatic mutation of malignant transformation related genes |
| Annotation of somatic variants for genes involved in malignant transformation |
| Hugo Symbol | Variant Class | Variant Classification | dbSNP RS | HGVSc | HGVSp | HGVSp Short | SWISSPROT | BIOTYPE | SIFT | PolyPhen | Tumor Sample Barcode | Tissue | Histology | Sex | Age | Stage | Therapy Types | Drugs | Outcome |
| GNPTG | SNV | Missense_Mutation | c.455C>G | p.Ser152Cys | p.S152C | Q9UJJ9 | protein_coding | deleterious(0) | probably_damaging(0.992) | TCGA-AN-A04D-01 | Breast | breast invasive carcinoma | Female | <65 | I/II | Unknown | Unknown | SD | |
| GNPTG | SNV | Missense_Mutation | c.646N>A | p.Ala216Thr | p.A216T | Q9UJJ9 | protein_coding | deleterious(0) | probably_damaging(0.974) | TCGA-AA-3492-01 | Colorectum | colon adenocarcinoma | Female | >=65 | I/II | Unknown | Unknown | SD | |
| GNPTG | SNV | Missense_Mutation | rs764395288 | c.265G>A | p.Val89Met | p.V89M | Q9UJJ9 | protein_coding | deleterious(0) | probably_damaging(0.995) | TCGA-AD-5900-01 | Colorectum | colon adenocarcinoma | Male | >=65 | I/II | Unknown | Unknown | SD |
| GNPTG | SNV | Missense_Mutation | rs367672512 | c.589N>A | p.Asp197Asn | p.D197N | Q9UJJ9 | protein_coding | tolerated(0.07) | possibly_damaging(0.63) | TCGA-NH-A50V-01 | Colorectum | colon adenocarcinoma | Male | >=65 | III/IV | Chemotherapy | fluorouracil | CR |
| GNPTG | SNV | Missense_Mutation | novel | c.779N>C | p.Lys260Thr | p.K260T | Q9UJJ9 | protein_coding | tolerated(0.23) | benign(0.01) | TCGA-F5-6814-01 | Colorectum | rectum adenocarcinoma | Male | <65 | I/II | Unknown | Unknown | SD |
| GNPTG | insertion | Frame_Shift_Ins | rs754893828 | c.780dupA | p.Gly261ArgfsTer38 | p.G261Rfs*38 | Q9UJJ9 | protein_coding | TCGA-AA-3812-01 | Colorectum | colon adenocarcinoma | Female | >=65 | I/II | Unknown | Unknown | PD | ||
| GNPTG | SNV | Missense_Mutation | novel | c.632N>T | p.Thr211Ile | p.T211I | Q9UJJ9 | protein_coding | tolerated(0.12) | benign(0.11) | TCGA-A5-A7WJ-01 | Endometrium | uterine corpus endometrioid carcinoma | Female | <65 | I/II | Unknown | Unknown | SD |
| GNPTG | SNV | Missense_Mutation | novel | c.161A>G | p.Asp54Gly | p.D54G | Q9UJJ9 | protein_coding | tolerated(0.09) | benign(0.173) | TCGA-AP-A1DK-01 | Endometrium | uterine corpus endometrioid carcinoma | Female | <65 | I/II | Unknown | Unknown | SD |
| GNPTG | SNV | Missense_Mutation | rs753205380 | c.400N>T | p.Arg134Trp | p.R134W | Q9UJJ9 | protein_coding | deleterious(0) | probably_damaging(1) | TCGA-AX-A2HD-01 | Endometrium | uterine corpus endometrioid carcinoma | Female | >=65 | III/IV | Unknown | Unknown | SD |
| GNPTG | SNV | Missense_Mutation | rs778810991 | c.197G>A | p.Arg66Gln | p.R66Q | Q9UJJ9 | protein_coding | tolerated(0.06) | possibly_damaging(0.511) | TCGA-B5-A11O-01 | Endometrium | uterine corpus endometrioid carcinoma | Female | <65 | I/II | Unknown | Unknown | PD |
| Page: 1 2 3 |
Top |
Related drugs of malignant transformation related genes |
| Identification of chemicals and drugs interact with genes involved in malignant transfromation |
| (DGIdb 4.0) |
| Entrez ID | Symbol | Category | Interaction Types | Drug Claim Name | Drug Name | PMIDs |
| Page: 1 |

Copyright 2023-Present -The University of Texas Health Science Center at Houston |