
|
|||||
|
 | |
| |
| |
| |
| |
| |
|
Gene: GNPTAB |
Gene summary for GNPTAB |
| Gene information | Species | Human | Gene symbol | GNPTAB | Gene ID | 79158 |
| Gene name | N-acetylglucosamine-1-phosphate transferase subunits alpha and beta | |
| Gene Alias | GNPTA | |
| Cytomap | 12q23.2 | |
| Gene Type | protein-coding | GO ID | GO:0005975 | UniProtAcc | Q3T906 |
Top |
Malignant transformation analysis |
| Identification of the aberrant gene expression in precancerous and cancerous lesions by comparing the gene expression of stem-like cells in diseased tissues with normal stem cells |
| Entrez ID | Symbol | Replicates | Species | Organ | Tissue | Adj P-value | Log2FC | Malignancy |
| 79158 | GNPTAB | HTA11_347_2000001011 | Human | Colorectum | AD | 6.20e-23 | 9.14e-01 | -0.1954 |
| 79158 | GNPTAB | HTA11_99999970781_79442 | Human | Colorectum | MSS | 7.82e-08 | -3.36e-01 | 0.294 |
| 79158 | GNPTAB | HTA11_99999965062_69753 | Human | Colorectum | MSI-H | 2.26e-04 | 8.85e-01 | 0.3487 |
| 79158 | GNPTAB | HTA11_99999974143_84620 | Human | Colorectum | MSS | 2.10e-11 | -4.48e-01 | 0.3005 |
| 79158 | GNPTAB | F007 | Human | Colorectum | FAP | 1.23e-04 | -3.87e-01 | 0.1176 |
| 79158 | GNPTAB | A002-C-010 | Human | Colorectum | FAP | 3.74e-07 | -2.98e-01 | 0.242 |
| 79158 | GNPTAB | A001-C-207 | Human | Colorectum | FAP | 1.02e-07 | -4.66e-01 | 0.1278 |
| 79158 | GNPTAB | A015-C-203 | Human | Colorectum | FAP | 2.66e-24 | -4.17e-01 | -0.1294 |
| 79158 | GNPTAB | A015-C-204 | Human | Colorectum | FAP | 4.30e-08 | -3.21e-01 | -0.0228 |
| 79158 | GNPTAB | A014-C-040 | Human | Colorectum | FAP | 2.65e-04 | -4.76e-01 | -0.1184 |
| 79158 | GNPTAB | A002-C-201 | Human | Colorectum | FAP | 8.26e-20 | -5.65e-01 | 0.0324 |
| 79158 | GNPTAB | A002-C-203 | Human | Colorectum | FAP | 9.45e-15 | -4.16e-01 | 0.2786 |
| 79158 | GNPTAB | A001-C-119 | Human | Colorectum | FAP | 1.29e-07 | -3.60e-01 | -0.1557 |
| 79158 | GNPTAB | A001-C-108 | Human | Colorectum | FAP | 5.33e-18 | -3.70e-01 | -0.0272 |
| 79158 | GNPTAB | A002-C-205 | Human | Colorectum | FAP | 1.14e-23 | -4.19e-01 | -0.1236 |
| 79158 | GNPTAB | A001-C-104 | Human | Colorectum | FAP | 8.56e-10 | -4.09e-01 | 0.0184 |
| 79158 | GNPTAB | A015-C-005 | Human | Colorectum | FAP | 1.11e-05 | -2.64e-01 | -0.0336 |
| 79158 | GNPTAB | A015-C-006 | Human | Colorectum | FAP | 1.34e-16 | -5.02e-01 | -0.0994 |
| 79158 | GNPTAB | A015-C-106 | Human | Colorectum | FAP | 4.86e-15 | -3.48e-01 | -0.0511 |
| 79158 | GNPTAB | A002-C-114 | Human | Colorectum | FAP | 5.26e-17 | -3.98e-01 | -0.1561 |
| Page: 1 2 3 4 5 6 7 8 |
| Tissue | Expression Dynamics | Abbreviation |
| Colorectum (GSE201348) |  | FAP: Familial adenomatous polyposis |
| CRC: Colorectal cancer | ||
| Colorectum (HTA11) |  | AD: Adenomas |
| SER: Sessile serrated lesions | ||
| MSI-H: Microsatellite-high colorectal cancer | ||
| MSS: Microsatellite stable colorectal cancer | ||
| Esophagus | 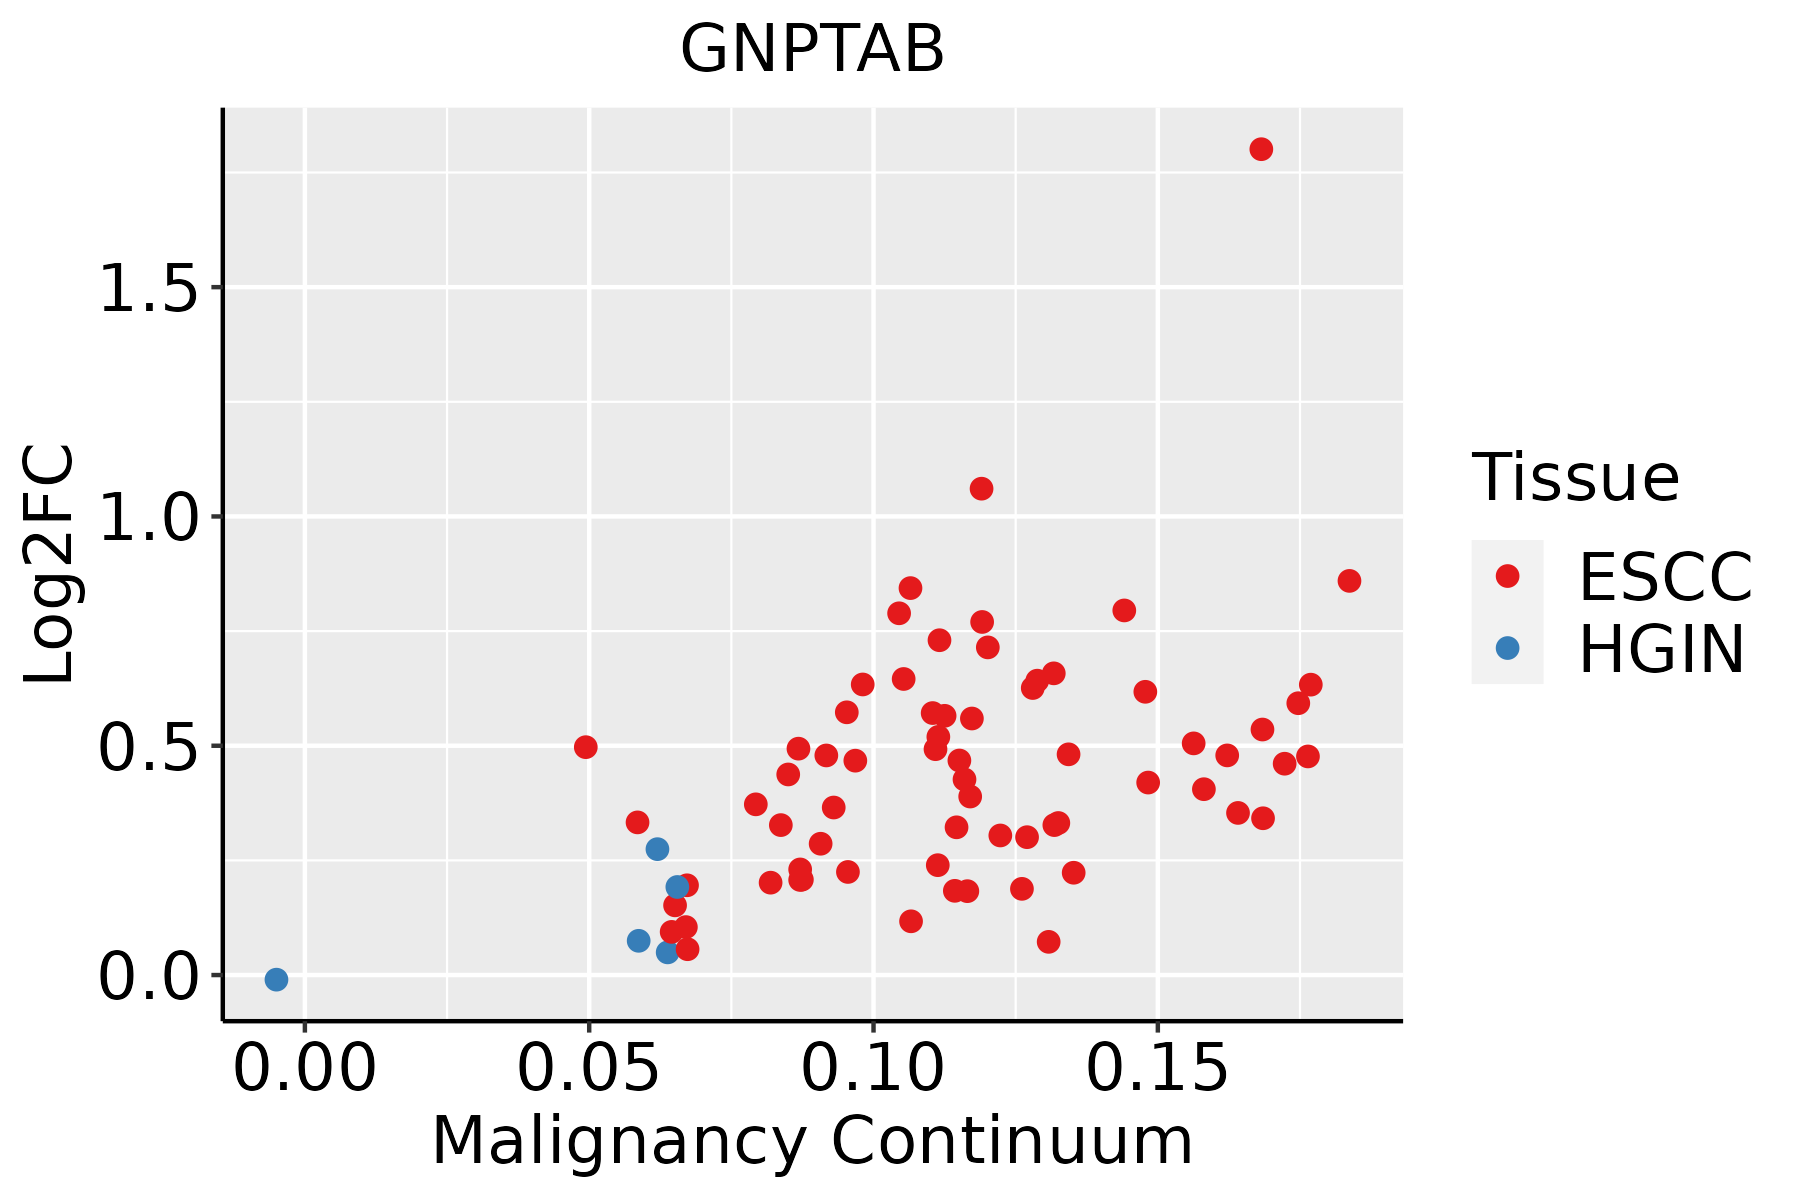 | ESCC: Esophageal squamous cell carcinoma |
| HGIN: High-grade intraepithelial neoplasias | ||
| LGIN: Low-grade intraepithelial neoplasias | ||
| Lung | 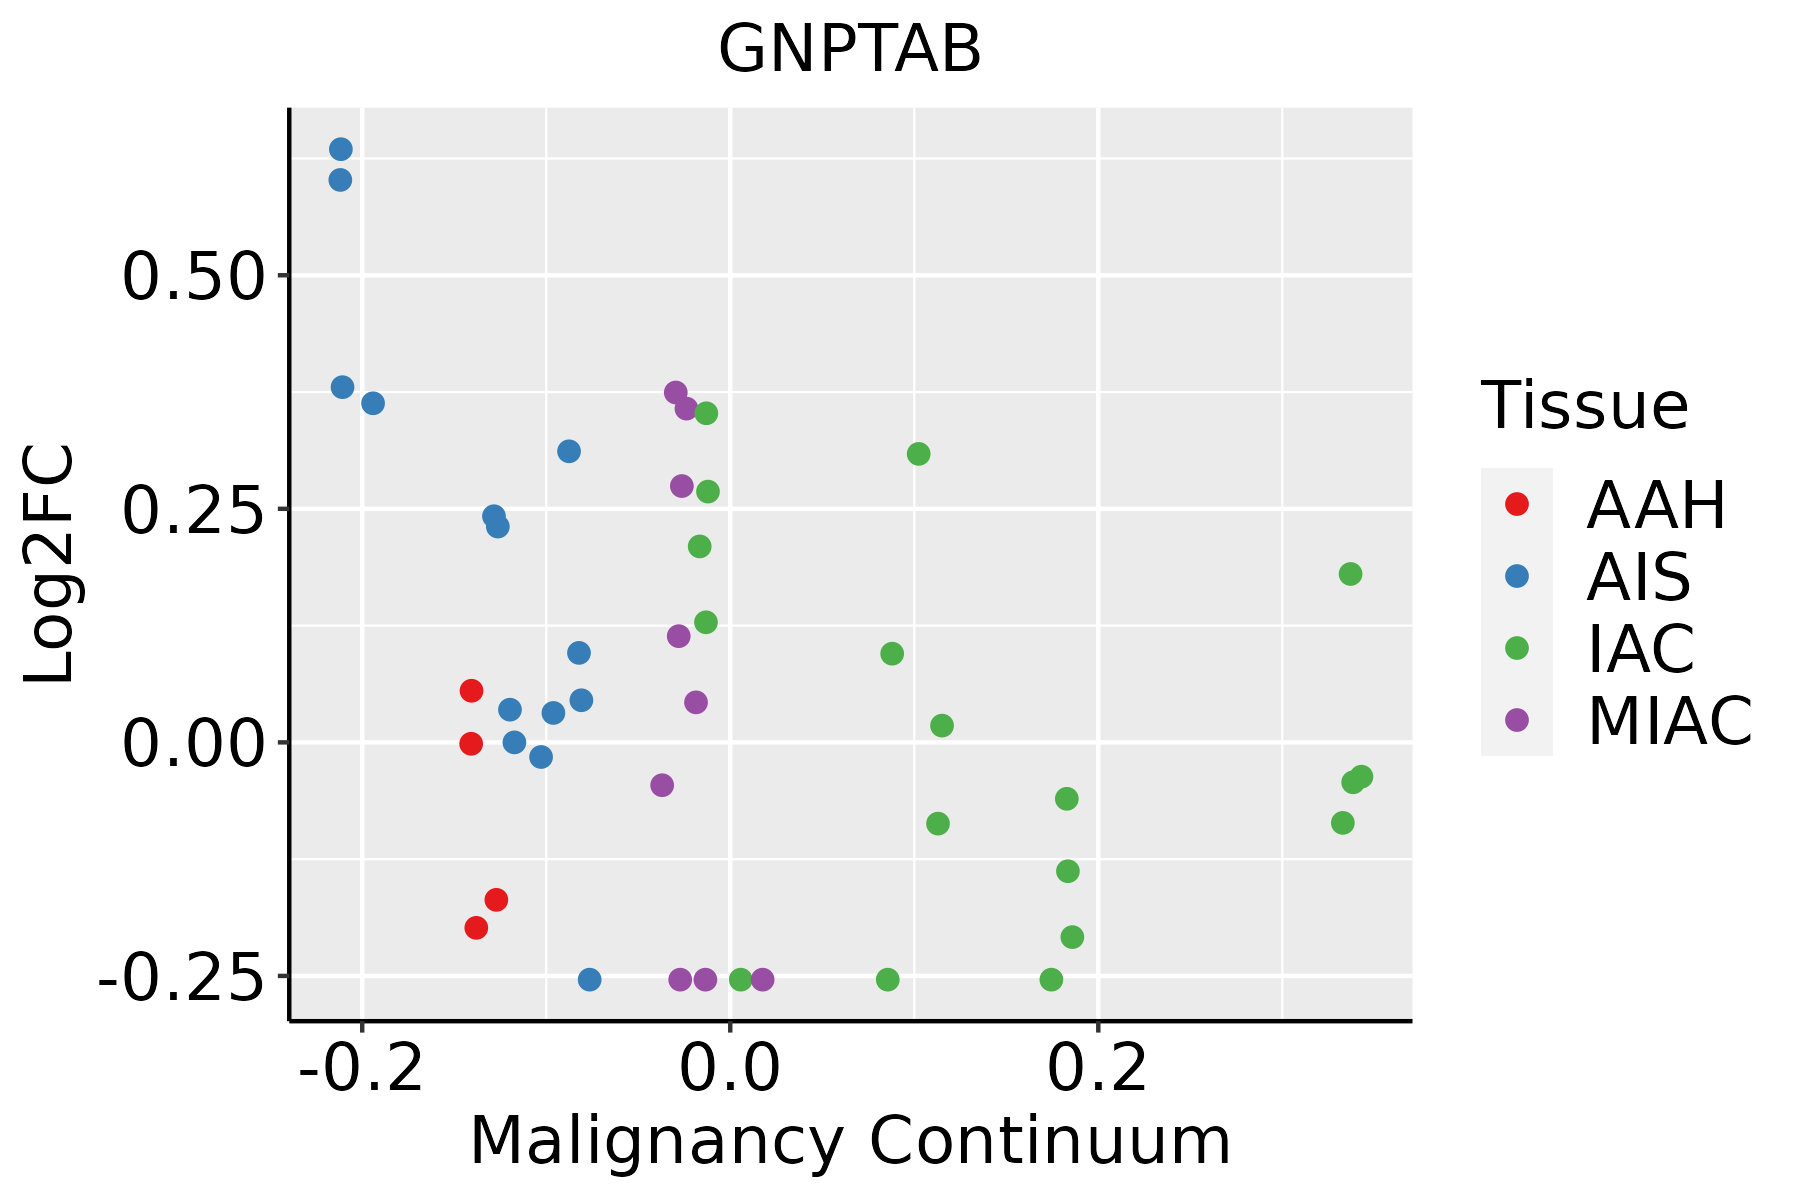 | AAH: Atypical adenomatous hyperplasia |
| AIS: Adenocarcinoma in situ | ||
| IAC: Invasive lung adenocarcinoma | ||
| MIA: Minimally invasive adenocarcinoma | ||
| Oral Cavity | 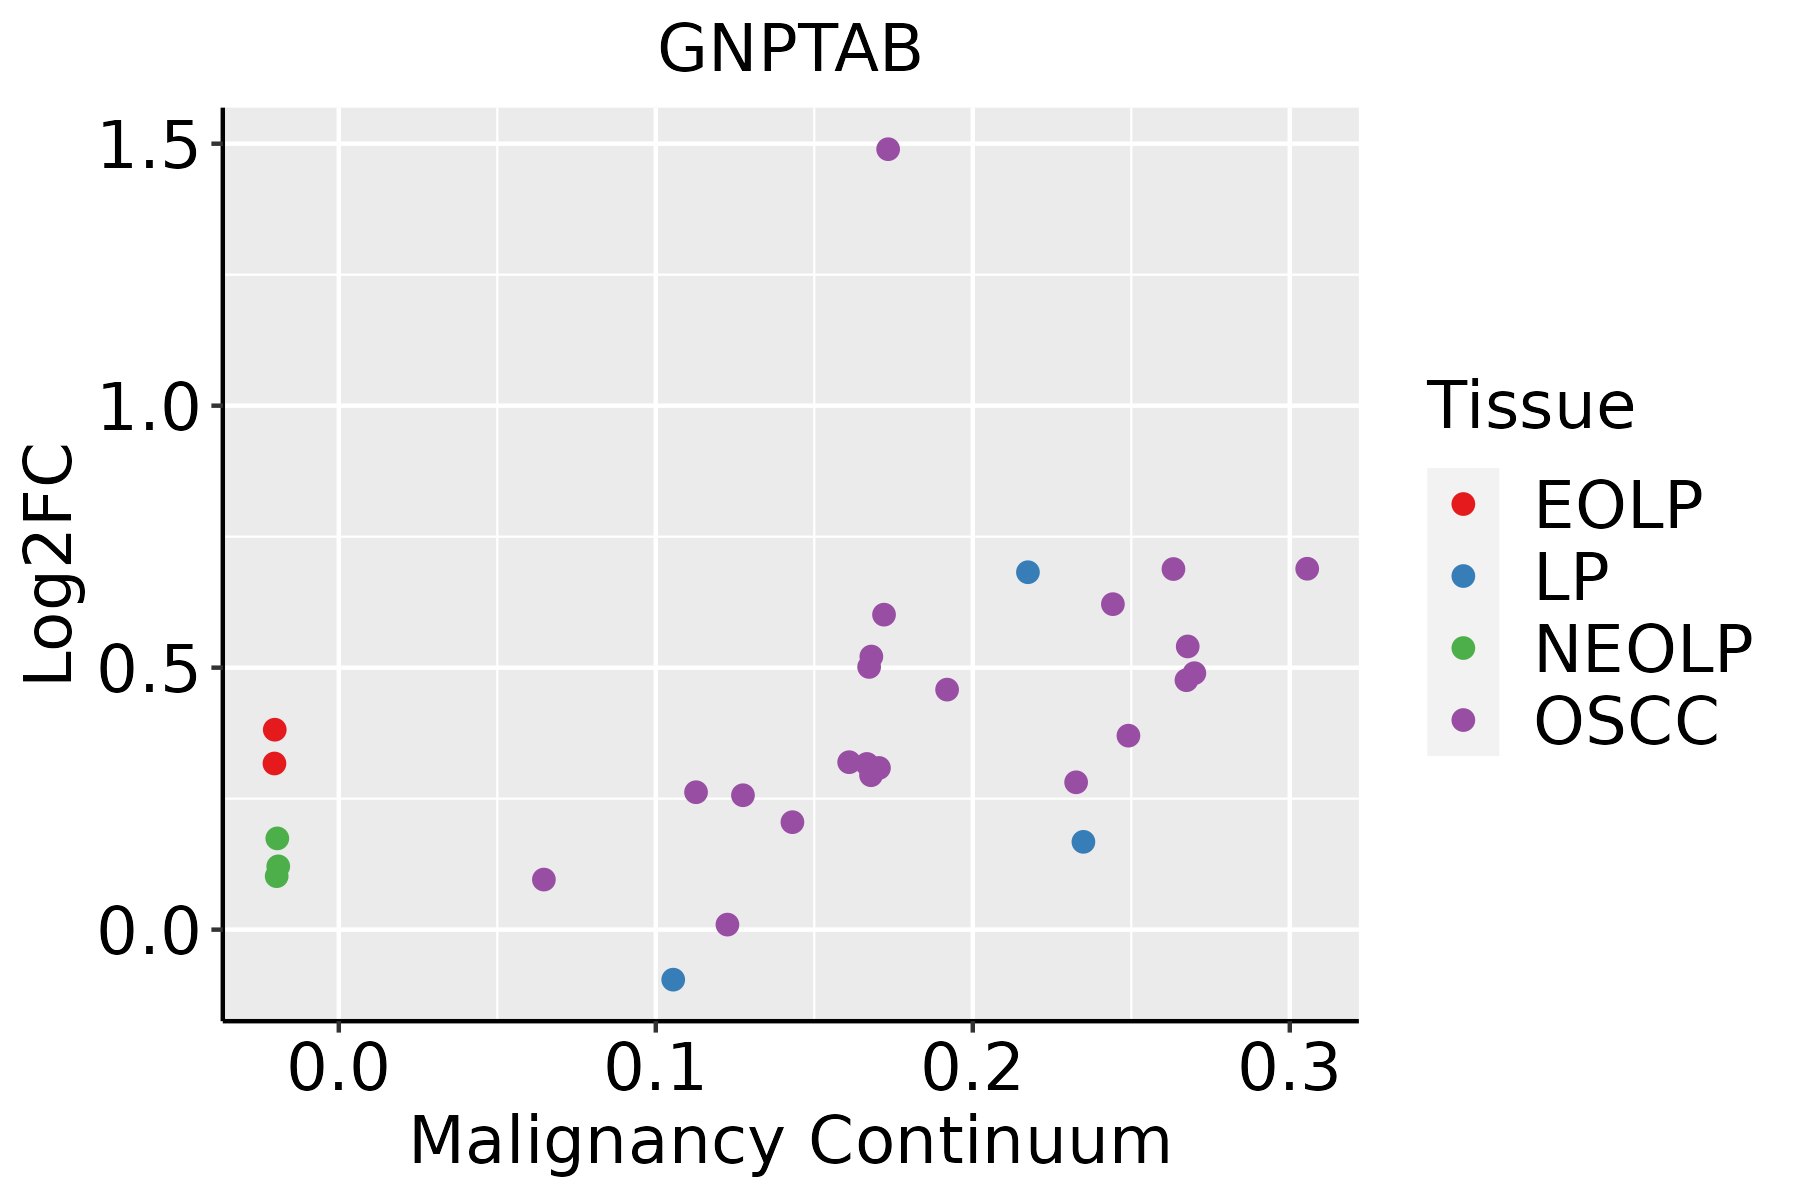 | EOLP: Erosive Oral lichen planus |
| LP: leukoplakia | ||
| NEOLP: Non-erosive oral lichen planus | ||
| OSCC: Oral squamous cell carcinoma | ||
| Prostate | 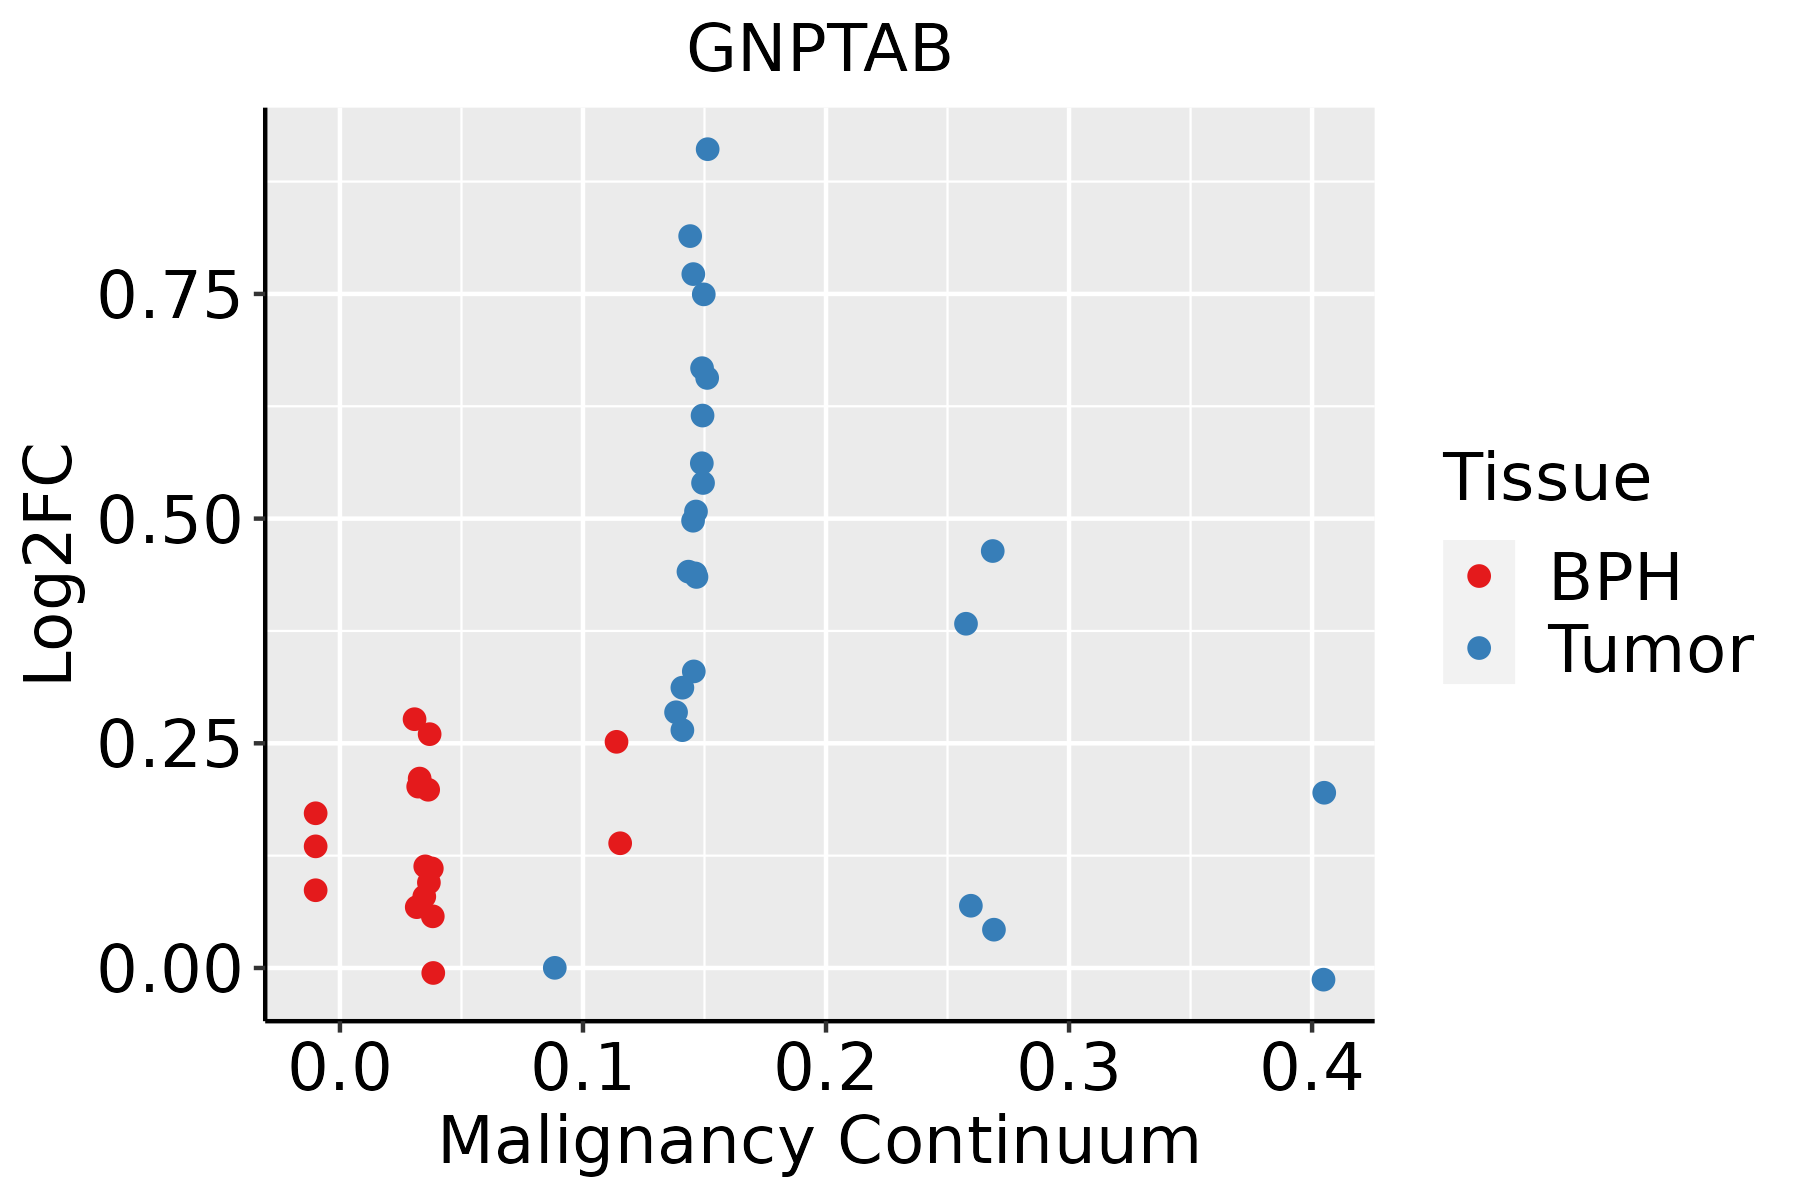 | BPH: Benign Prostatic Hyperplasia |
| Thyroid | 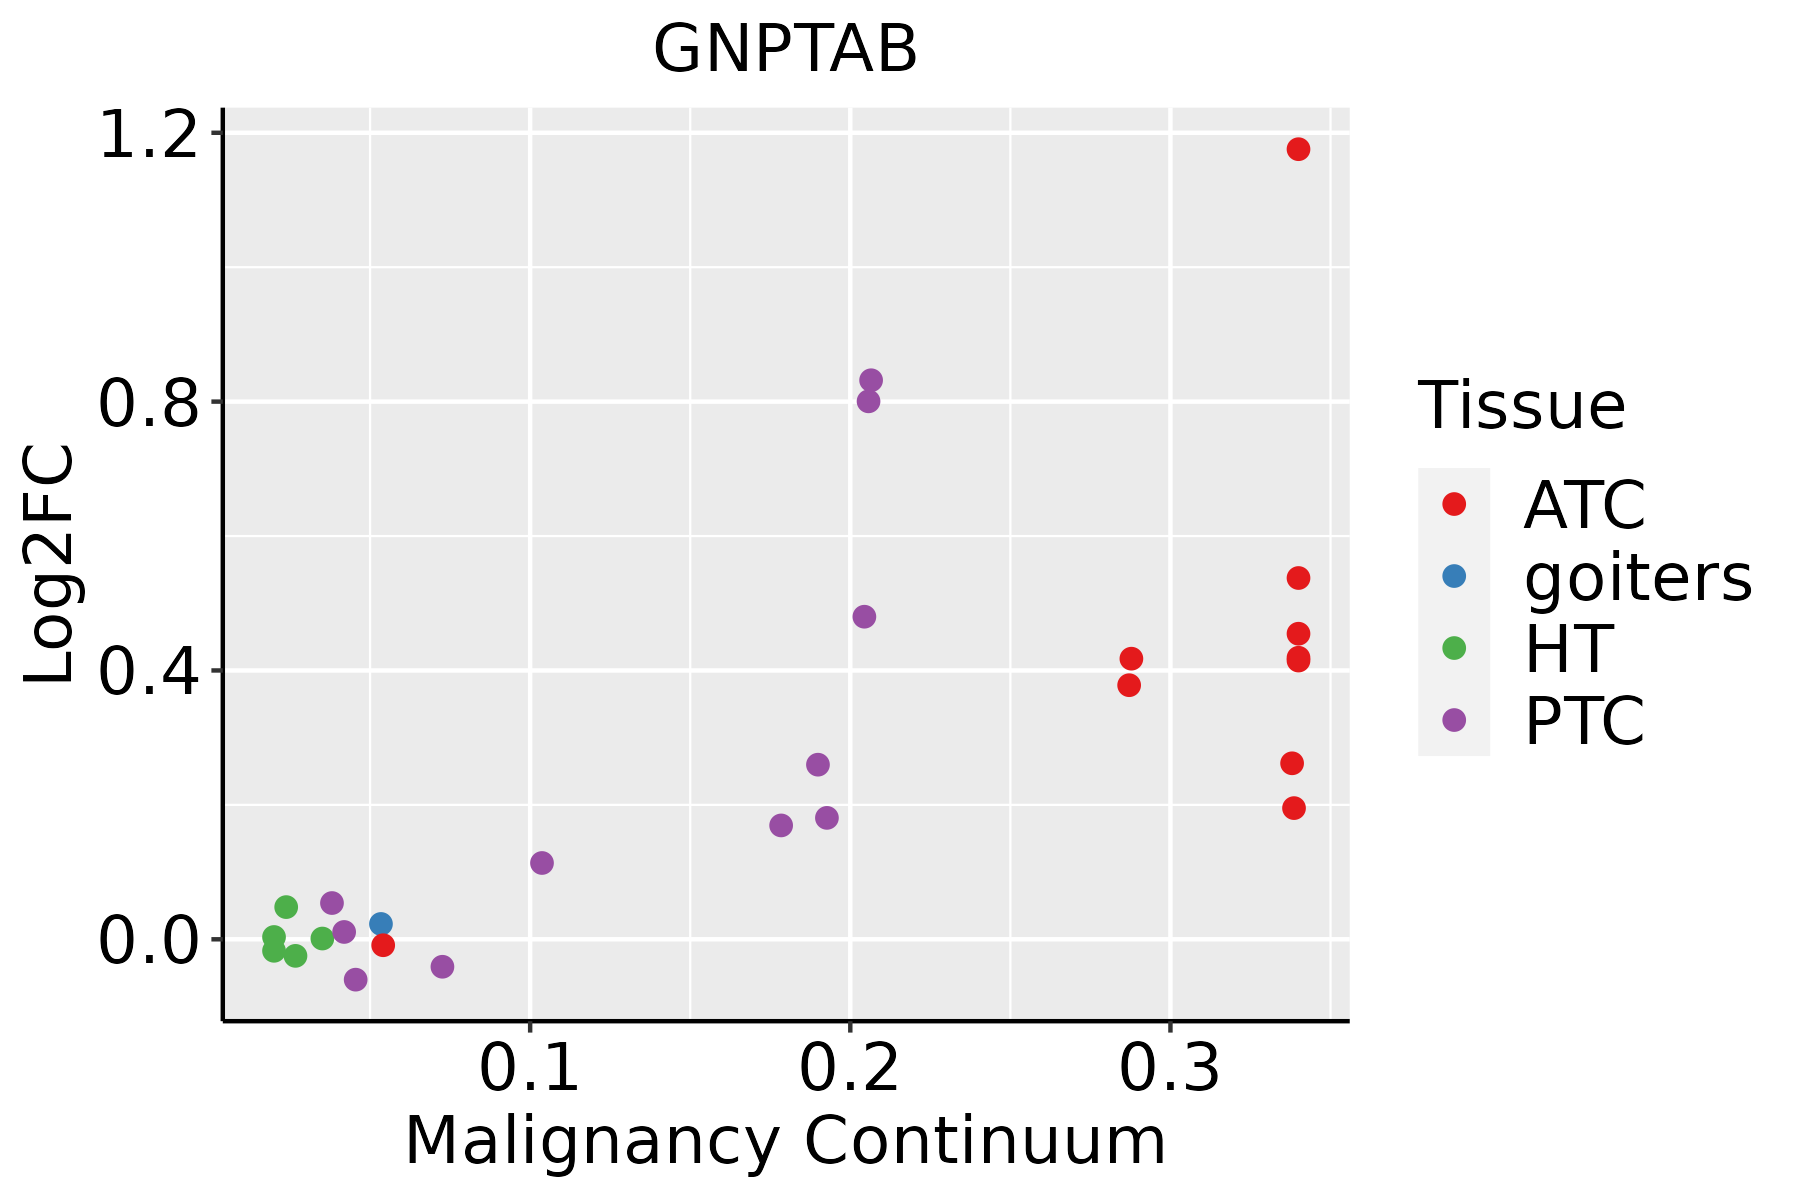 | ATC: Anaplastic thyroid cancer |
| HT: Hashimoto's thyroiditis | ||
| PTC: Papillary thyroid cancer |
| ∗log2FC in expression of this searched gene in stem-like cells from each diseased tissue sample relative to stem-like cells in normal samples in each tissue plotted against the malignancy continuum. Samples are colored based on if they are from different disease stage. |
Top |
Malignant transformation related pathway analysis |
| Find out the enriched GO biological processes and KEGG pathways involved in transition from healthy to precancer to cancer |
| Tissue | Disease Stage | Enriched GO biological Processes |
| Colorectum | AD |  |
| Colorectum | SER |  |
| Colorectum | MSS |  |
| Colorectum | MSI-H |  |
| Colorectum | FAP |  |
| ∗Top 15 enriched GO BP terms are showed in the bar plot of each disease state in each tissue. Each row represents a significant GO biological process which is colored according to the -log10(p.adjust). |
| Page: 1 2 3 4 5 6 7 8 9 |
| GO ID | Tissue | Disease Stage | Description | Gene Ratio | Bg Ratio | pvalue | p.adjust | Count |
| GO:0072594 | Colorectum | AD | establishment of protein localization to organelle | 148/3918 | 422/18723 | 7.95e-12 | 1.04e-09 | 148 |
| GO:0006605 | Colorectum | AD | protein targeting | 105/3918 | 314/18723 | 1.39e-07 | 6.44e-06 | 105 |
| GO:0007034 | Colorectum | AD | vacuolar transport | 60/3918 | 157/18723 | 4.97e-07 | 1.85e-05 | 60 |
| GO:0044262 | Colorectum | AD | cellular carbohydrate metabolic process | 87/3918 | 283/18723 | 6.00e-05 | 1.01e-03 | 87 |
| GO:0007041 | Colorectum | AD | lysosomal transport | 42/3918 | 114/18723 | 6.61e-05 | 1.07e-03 | 42 |
| GO:0009306 | Colorectum | AD | protein secretion | 105/3918 | 359/18723 | 1.05e-04 | 1.57e-03 | 105 |
| GO:0035592 | Colorectum | AD | establishment of protein localization to extracellular region | 105/3918 | 360/18723 | 1.18e-04 | 1.73e-03 | 105 |
| GO:0071692 | Colorectum | AD | protein localization to extracellular region | 106/3918 | 368/18723 | 1.86e-04 | 2.49e-03 | 106 |
| GO:0072665 | Colorectum | AD | protein localization to vacuole | 27/3918 | 67/18723 | 2.40e-04 | 3.04e-03 | 27 |
| GO:0061462 | Colorectum | AD | protein localization to lysosome | 19/3918 | 46/18723 | 1.36e-03 | 1.19e-02 | 19 |
| GO:0007033 | Colorectum | AD | vacuole organization | 53/3918 | 180/18723 | 4.18e-03 | 2.89e-02 | 53 |
| GO:0006623 | Colorectum | AD | protein targeting to vacuole | 15/3918 | 37/18723 | 5.24e-03 | 3.47e-02 | 15 |
| GO:0072666 | Colorectum | AD | establishment of protein localization to vacuole | 18/3918 | 49/18723 | 7.93e-03 | 4.73e-02 | 18 |
| GO:00725942 | Colorectum | MSS | establishment of protein localization to organelle | 139/3467 | 422/18723 | 5.75e-13 | 1.12e-10 | 139 |
| GO:00066052 | Colorectum | MSS | protein targeting | 97/3467 | 314/18723 | 6.76e-08 | 3.46e-06 | 97 |
| GO:00070342 | Colorectum | MSS | vacuolar transport | 52/3467 | 157/18723 | 8.25e-06 | 2.07e-04 | 52 |
| GO:00093062 | Colorectum | MSS | protein secretion | 98/3467 | 359/18723 | 2.43e-05 | 5.09e-04 | 98 |
| GO:00355922 | Colorectum | MSS | establishment of protein localization to extracellular region | 98/3467 | 360/18723 | 2.75e-05 | 5.58e-04 | 98 |
| GO:00716922 | Colorectum | MSS | protein localization to extracellular region | 99/3467 | 368/18723 | 4.17e-05 | 7.83e-04 | 99 |
| GO:00070411 | Colorectum | MSS | lysosomal transport | 36/3467 | 114/18723 | 5.38e-04 | 6.04e-03 | 36 |
| Page: 1 2 3 4 5 6 7 8 |
| Pathway ID | Tissue | Disease Stage | Description | Gene Ratio | Bg Ratio | pvalue | p.adjust | qvalue | Count |
| hsa0414222 | Esophagus | ESCC | Lysosome | 102/4205 | 132/8465 | 5.11e-11 | 7.13e-10 | 3.65e-10 | 102 |
| hsa0414232 | Esophagus | ESCC | Lysosome | 102/4205 | 132/8465 | 5.11e-11 | 7.13e-10 | 3.65e-10 | 102 |
| hsa041425 | Oral cavity | OSCC | Lysosome | 87/3704 | 132/8465 | 1.97e-07 | 1.35e-06 | 6.86e-07 | 87 |
| hsa0414212 | Oral cavity | OSCC | Lysosome | 87/3704 | 132/8465 | 1.97e-07 | 1.35e-06 | 6.86e-07 | 87 |
| Page: 1 |
Top |
Cell-cell communication analysis |
| Identification of potential cell-cell interactions between two cell types and their ligand-receptor pairs for different disease states |
| Ligand | Receptor | LRpair | Pathway | Tissue | Disease Stage |
| Page: 1 |
Top |
Single-cell gene regulatory network inference analysis |
| Find out the significant the regulons (TFs) and the target genes of each regulon across cell types for different disease states |
| TF | Cell Type | Tissue | Disease Stage | Target Gene | RSS | Regulon Activity |
| ∗The dot plots of a searched regulon are shown for all cell subpopulations in each disease state of each tissue based on the regulon specific score inferred using pySCENIC and by calculating the average expression. |
| Page: 1 |
Top |
Somatic mutation of malignant transformation related genes |
| Annotation of somatic variants for genes involved in malignant transformation |
| Hugo Symbol | Variant Class | Variant Classification | dbSNP RS | HGVSc | HGVSp | HGVSp Short | SWISSPROT | BIOTYPE | SIFT | PolyPhen | Tumor Sample Barcode | Tissue | Histology | Sex | Age | Stage | Therapy Types | Drugs | Outcome |
| GNPTAB | SNV | Missense_Mutation | c.1376C>T | p.Ser459Leu | p.S459L | Q3T906 | protein_coding | deleterious(0) | probably_damaging(0.977) | TCGA-A1-A0SJ-01 | Breast | breast invasive carcinoma | Female | <65 | III/IV | Unknown | Unknown | SD | |
| GNPTAB | SNV | Missense_Mutation | novel | c.2668N>T | p.Gly890Cys | p.G890C | Q3T906 | protein_coding | deleterious(0) | probably_damaging(1) | TCGA-A7-A0CJ-01 | Breast | breast invasive carcinoma | Female | <65 | I/II | Chemotherapy | cytoxan | SD |
| GNPTAB | SNV | Missense_Mutation | c.487N>C | p.Ser163Pro | p.S163P | Q3T906 | protein_coding | tolerated(0.07) | benign(0.085) | TCGA-A8-A06Z-01 | Breast | breast invasive carcinoma | Female | >=65 | I/II | Unknown | Unknown | SD | |
| GNPTAB | SNV | Missense_Mutation | c.1547A>G | p.Asp516Gly | p.D516G | Q3T906 | protein_coding | deleterious(0) | probably_damaging(0.999) | TCGA-A8-A076-01 | Breast | breast invasive carcinoma | Female | >=65 | I/II | Hormone Therapy | anastrozole | SD | |
| GNPTAB | SNV | Missense_Mutation | novel | c.1672N>G | p.Pro558Ala | p.P558A | Q3T906 | protein_coding | deleterious(0) | probably_damaging(0.937) | TCGA-AN-A04D-01 | Breast | breast invasive carcinoma | Female | <65 | I/II | Unknown | Unknown | SD |
| GNPTAB | SNV | Missense_Mutation | c.3226G>A | p.Glu1076Lys | p.E1076K | Q3T906 | protein_coding | deleterious(0.01) | probably_damaging(0.996) | TCGA-AN-A0XW-01 | Breast | breast invasive carcinoma | Female | <65 | III/IV | Unknown | Unknown | SD | |
| GNPTAB | SNV | Missense_Mutation | rs749361169 | c.3380G>A | p.Arg1127His | p.R1127H | Q3T906 | protein_coding | tolerated(0.12) | benign(0.167) | TCGA-AO-A128-01 | Breast | breast invasive carcinoma | Female | <65 | I/II | Chemotherapy | doxorubicin | SD |
| GNPTAB | SNV | Missense_Mutation | c.3355N>A | p.Glu1119Lys | p.E1119K | Q3T906 | protein_coding | deleterious(0.02) | possibly_damaging(0.755) | TCGA-EW-A1IX-01 | Breast | breast invasive carcinoma | Female | <65 | I/II | Hormone Therapy | femara | SD | |
| GNPTAB | SNV | Missense_Mutation | c.1723N>A | p.Gly575Arg | p.G575R | Q3T906 | protein_coding | tolerated(0.14) | possibly_damaging(0.569) | TCGA-EW-A1P3-01 | Breast | breast invasive carcinoma | Female | <65 | I/II | Chemotherapy | fluorouracil | SD | |
| GNPTAB | insertion | Frame_Shift_Ins | novel | c.2457_2458insGTGTTCTTGACTATGTTTATTTCCTCAGTTTCCCCCATTTT | p.Thr820ValfsTer21 | p.T820Vfs*21 | Q3T906 | protein_coding | TCGA-A7-A0CG-01 | Breast | breast invasive carcinoma | Female | >=65 | I/II | Unknown | Unknown | SD |
| Page: 1 2 3 4 5 6 7 8 9 10 11 12 13 14 15 16 17 |
Top |
Related drugs of malignant transformation related genes |
| Identification of chemicals and drugs interact with genes involved in malignant transfromation |
| (DGIdb 4.0) |
| Entrez ID | Symbol | Category | Interaction Types | Drug Claim Name | Drug Name | PMIDs |
| Page: 1 |

Copyright 2023-Present -The University of Texas Health Science Center at Houston |