
|
|||||
|
 | |
| |
| |
| |
| |
| |
|
Gene: GNPNAT1 |
Gene summary for GNPNAT1 |
| Gene information | Species | Human | Gene symbol | GNPNAT1 | Gene ID | 64841 |
| Gene name | glucosamine-phosphate N-acetyltransferase 1 | |
| Gene Alias | GNA1 | |
| Cytomap | 14q22.1 | |
| Gene Type | protein-coding | GO ID | GO:0001889 | UniProtAcc | A0A024R649 |
Top |
Malignant transformation analysis |
| Identification of the aberrant gene expression in precancerous and cancerous lesions by comparing the gene expression of stem-like cells in diseased tissues with normal stem cells |
| Entrez ID | Symbol | Replicates | Species | Organ | Tissue | Adj P-value | Log2FC | Malignancy |
| 64841 | GNPNAT1 | LZE4T | Human | Esophagus | ESCC | 4.88e-08 | 2.88e-01 | 0.0811 |
| 64841 | GNPNAT1 | LZE7T | Human | Esophagus | ESCC | 7.71e-09 | 2.75e-01 | 0.0667 |
| 64841 | GNPNAT1 | LZE8T | Human | Esophagus | ESCC | 4.23e-03 | 9.71e-02 | 0.067 |
| 64841 | GNPNAT1 | LZE20T | Human | Esophagus | ESCC | 2.81e-07 | 1.37e-01 | 0.0662 |
| 64841 | GNPNAT1 | LZE24T | Human | Esophagus | ESCC | 2.19e-04 | 2.06e-01 | 0.0596 |
| 64841 | GNPNAT1 | LZE6T | Human | Esophagus | ESCC | 2.88e-03 | 2.48e-01 | 0.0845 |
| 64841 | GNPNAT1 | P2T-E | Human | Esophagus | ESCC | 8.63e-19 | 2.86e-01 | 0.1177 |
| 64841 | GNPNAT1 | P4T-E | Human | Esophagus | ESCC | 2.57e-23 | 5.80e-01 | 0.1323 |
| 64841 | GNPNAT1 | P5T-E | Human | Esophagus | ESCC | 5.23e-26 | 5.13e-01 | 0.1327 |
| 64841 | GNPNAT1 | P8T-E | Human | Esophagus | ESCC | 1.18e-13 | 2.82e-01 | 0.0889 |
| 64841 | GNPNAT1 | P9T-E | Human | Esophagus | ESCC | 1.85e-06 | 1.29e-01 | 0.1131 |
| 64841 | GNPNAT1 | P10T-E | Human | Esophagus | ESCC | 3.15e-09 | 1.25e-01 | 0.116 |
| 64841 | GNPNAT1 | P11T-E | Human | Esophagus | ESCC | 9.04e-07 | 4.10e-01 | 0.1426 |
| 64841 | GNPNAT1 | P12T-E | Human | Esophagus | ESCC | 4.68e-19 | 2.73e-01 | 0.1122 |
| 64841 | GNPNAT1 | P15T-E | Human | Esophagus | ESCC | 4.25e-14 | 2.98e-01 | 0.1149 |
| 64841 | GNPNAT1 | P16T-E | Human | Esophagus | ESCC | 3.74e-13 | 2.04e-01 | 0.1153 |
| 64841 | GNPNAT1 | P17T-E | Human | Esophagus | ESCC | 2.18e-02 | 2.52e-01 | 0.1278 |
| 64841 | GNPNAT1 | P19T-E | Human | Esophagus | ESCC | 2.65e-10 | 8.07e-01 | 0.1662 |
| 64841 | GNPNAT1 | P20T-E | Human | Esophagus | ESCC | 8.77e-06 | 1.16e-01 | 0.1124 |
| 64841 | GNPNAT1 | P21T-E | Human | Esophagus | ESCC | 6.83e-18 | 4.16e-01 | 0.1617 |
| Page: 1 2 3 4 5 6 |
| Tissue | Expression Dynamics | Abbreviation |
| Esophagus |  | ESCC: Esophageal squamous cell carcinoma |
| HGIN: High-grade intraepithelial neoplasias | ||
| LGIN: Low-grade intraepithelial neoplasias | ||
| Liver |  | HCC: Hepatocellular carcinoma |
| NAFLD: Non-alcoholic fatty liver disease | ||
| Oral Cavity |  | EOLP: Erosive Oral lichen planus |
| LP: leukoplakia | ||
| NEOLP: Non-erosive oral lichen planus | ||
| OSCC: Oral squamous cell carcinoma | ||
| Prostate | 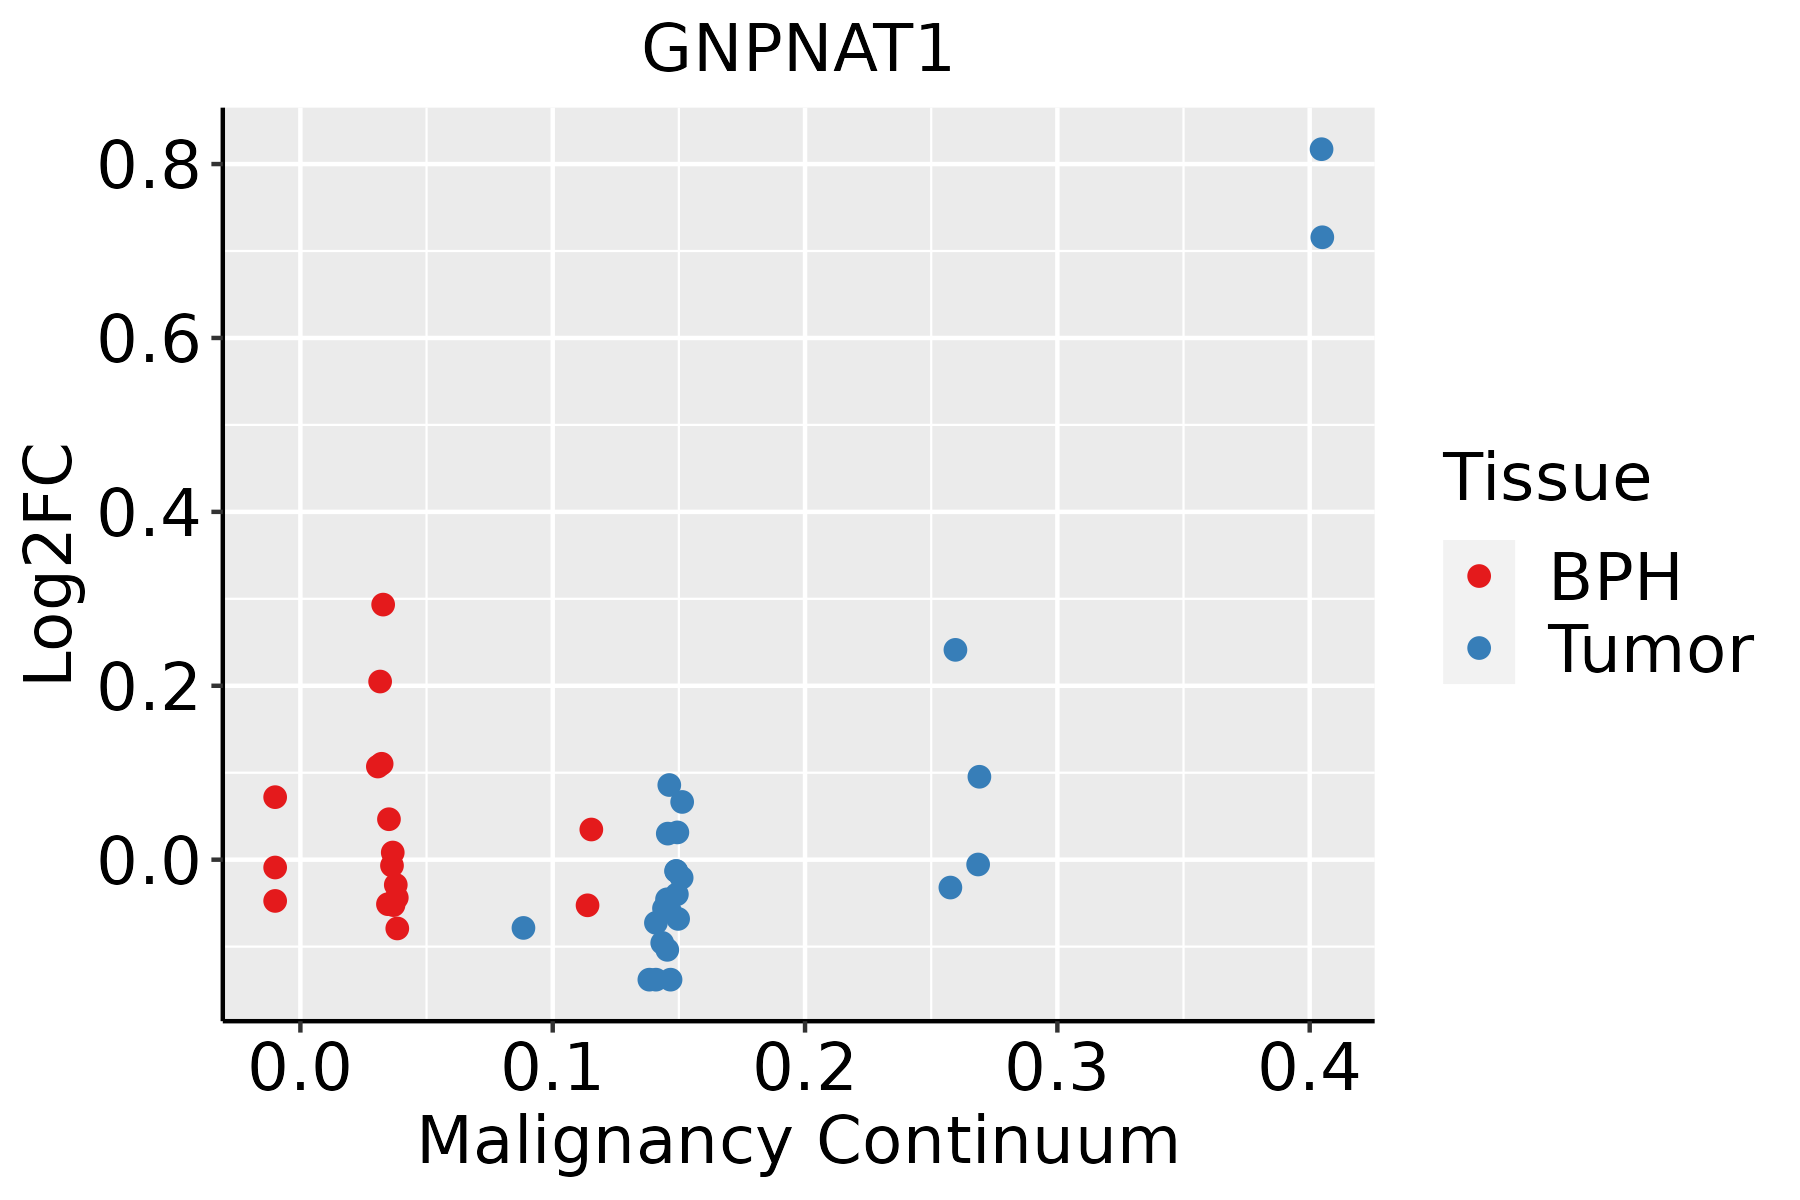 | BPH: Benign Prostatic Hyperplasia |
| Skin |  | AK: Actinic keratosis |
| cSCC: Cutaneous squamous cell carcinoma | ||
| SCCIS:squamous cell carcinoma in situ | ||
| Thyroid |  | ATC: Anaplastic thyroid cancer |
| HT: Hashimoto's thyroiditis | ||
| PTC: Papillary thyroid cancer |
| ∗log2FC in expression of this searched gene in stem-like cells from each diseased tissue sample relative to stem-like cells in normal samples in each tissue plotted against the malignancy continuum. Samples are colored based on if they are from different disease stage. |
Top |
Malignant transformation related pathway analysis |
| Find out the enriched GO biological processes and KEGG pathways involved in transition from healthy to precancer to cancer |
| Tissue | Disease Stage | Enriched GO biological Processes |
| Colorectum | AD |  |
| Colorectum | SER |  |
| Colorectum | MSS |  |
| Colorectum | MSI-H |  |
| Colorectum | FAP |  |
| ∗Top 15 enriched GO BP terms are showed in the bar plot of each disease state in each tissue. Each row represents a significant GO biological process which is colored according to the -log10(p.adjust). |
| Page: 1 2 3 4 5 6 7 8 9 |
| GO ID | Tissue | Disease Stage | Description | Gene Ratio | Bg Ratio | pvalue | p.adjust | Count |
| GO:0048732111 | Esophagus | ESCC | gland development | 269/8552 | 436/18723 | 7.81e-12 | 2.95e-10 | 269 |
| GO:0061008110 | Esophagus | ESCC | hepaticobiliary system development | 98/8552 | 150/18723 | 8.91e-07 | 1.15e-05 | 98 |
| GO:0001889110 | Esophagus | ESCC | liver development | 96/8552 | 147/18723 | 1.18e-06 | 1.47e-05 | 96 |
| GO:00092256 | Esophagus | ESCC | nucleotide-sugar metabolic process | 29/8552 | 36/18723 | 1.91e-05 | 1.67e-04 | 29 |
| GO:00092262 | Esophagus | ESCC | nucleotide-sugar biosynthetic process | 14/8552 | 19/18723 | 1.27e-02 | 4.21e-02 | 14 |
| GO:000188912 | Liver | Cirrhotic | liver development | 81/4634 | 147/18723 | 2.99e-15 | 3.35e-13 | 81 |
| GO:006100812 | Liver | Cirrhotic | hepaticobiliary system development | 82/4634 | 150/18723 | 3.72e-15 | 4.09e-13 | 82 |
| GO:004873212 | Liver | Cirrhotic | gland development | 154/4634 | 436/18723 | 4.03e-07 | 9.42e-06 | 154 |
| GO:000188922 | Liver | HCC | liver development | 108/7958 | 147/18723 | 2.16e-14 | 1.41e-12 | 108 |
| GO:006100822 | Liver | HCC | hepaticobiliary system development | 109/7958 | 150/18723 | 5.72e-14 | 3.42e-12 | 109 |
| GO:004873222 | Liver | HCC | gland development | 242/7958 | 436/18723 | 2.26e-08 | 5.28e-07 | 242 |
| GO:00092254 | Liver | HCC | nucleotide-sugar metabolic process | 25/7958 | 36/18723 | 9.87e-04 | 5.71e-03 | 25 |
| GO:004873220 | Oral cavity | OSCC | gland development | 226/7305 | 436/18723 | 2.78e-08 | 5.39e-07 | 226 |
| GO:000188918 | Oral cavity | OSCC | liver development | 87/7305 | 147/18723 | 5.54e-07 | 8.08e-06 | 87 |
| GO:006100818 | Oral cavity | OSCC | hepaticobiliary system development | 88/7305 | 150/18723 | 8.13e-07 | 1.12e-05 | 88 |
| GO:00092255 | Oral cavity | OSCC | nucleotide-sugar metabolic process | 26/7305 | 36/18723 | 5.44e-05 | 4.51e-04 | 26 |
| GO:00092261 | Oral cavity | OSCC | nucleotide-sugar biosynthetic process | 14/7305 | 19/18723 | 2.31e-03 | 1.02e-02 | 14 |
| GO:0006040 | Oral cavity | OSCC | amino sugar metabolic process | 24/7305 | 42/18723 | 1.30e-02 | 4.34e-02 | 24 |
| GO:0006047 | Oral cavity | OSCC | UDP-N-acetylglucosamine metabolic process | 10/7305 | 14/18723 | 1.44e-02 | 4.69e-02 | 10 |
| GO:000188919 | Oral cavity | LP | liver development | 62/4623 | 147/18723 | 2.32e-06 | 5.14e-05 | 62 |
| Page: 1 2 3 |
| Pathway ID | Tissue | Disease Stage | Description | Gene Ratio | Bg Ratio | pvalue | p.adjust | qvalue | Count |
| hsa012505 | Esophagus | ESCC | Biosynthesis of nucleotide sugars | 28/4205 | 37/8465 | 1.10e-03 | 3.42e-03 | 1.75e-03 | 28 |
| hsa005202 | Esophagus | ESCC | Amino sugar and nucleotide sugar metabolism | 35/4205 | 49/8465 | 1.60e-03 | 4.88e-03 | 2.50e-03 | 35 |
| hsa0125012 | Esophagus | ESCC | Biosynthesis of nucleotide sugars | 28/4205 | 37/8465 | 1.10e-03 | 3.42e-03 | 1.75e-03 | 28 |
| hsa0052011 | Esophagus | ESCC | Amino sugar and nucleotide sugar metabolism | 35/4205 | 49/8465 | 1.60e-03 | 4.88e-03 | 2.50e-03 | 35 |
| hsa00520 | Oral cavity | OSCC | Amino sugar and nucleotide sugar metabolism | 34/3704 | 49/8465 | 2.48e-04 | 8.08e-04 | 4.11e-04 | 34 |
| hsa012504 | Oral cavity | OSCC | Biosynthesis of nucleotide sugars | 25/3704 | 37/8465 | 2.93e-03 | 7.49e-03 | 3.81e-03 | 25 |
| hsa005201 | Oral cavity | OSCC | Amino sugar and nucleotide sugar metabolism | 34/3704 | 49/8465 | 2.48e-04 | 8.08e-04 | 4.11e-04 | 34 |
| hsa0125011 | Oral cavity | OSCC | Biosynthesis of nucleotide sugars | 25/3704 | 37/8465 | 2.93e-03 | 7.49e-03 | 3.81e-03 | 25 |
| Page: 1 |
Top |
Cell-cell communication analysis |
| Identification of potential cell-cell interactions between two cell types and their ligand-receptor pairs for different disease states |
| Ligand | Receptor | LRpair | Pathway | Tissue | Disease Stage |
| Page: 1 |
Top |
Single-cell gene regulatory network inference analysis |
| Find out the significant the regulons (TFs) and the target genes of each regulon across cell types for different disease states |
| TF | Cell Type | Tissue | Disease Stage | Target Gene | RSS | Regulon Activity |
| ∗The dot plots of a searched regulon are shown for all cell subpopulations in each disease state of each tissue based on the regulon specific score inferred using pySCENIC and by calculating the average expression. |
| Page: 1 |
Top |
Somatic mutation of malignant transformation related genes |
| Annotation of somatic variants for genes involved in malignant transformation |
| Hugo Symbol | Variant Class | Variant Classification | dbSNP RS | HGVSc | HGVSp | HGVSp Short | SWISSPROT | BIOTYPE | SIFT | PolyPhen | Tumor Sample Barcode | Tissue | Histology | Sex | Age | Stage | Therapy Types | Drugs | Outcome |
| GNPNAT1 | SNV | Missense_Mutation | c.130C>G | p.Leu44Val | p.L44V | Q96EK6 | protein_coding | deleterious(0) | probably_damaging(0.984) | TCGA-B6-A0RE-01 | Breast | breast invasive carcinoma | Female | <65 | I/II | Unknown | Unknown | SD | |
| GNPNAT1 | SNV | Missense_Mutation | novel | c.498A>C | p.Lys166Asn | p.K166N | Q96EK6 | protein_coding | tolerated(0.13) | benign(0.12) | TCGA-CA-6717-01 | Colorectum | colon adenocarcinoma | Male | <65 | I/II | Chemotherapy | oxaliplatin | CR |
| GNPNAT1 | deletion | Frame_Shift_Del | c.162delN | p.Phe54LeufsTer7 | p.F54Lfs*7 | Q96EK6 | protein_coding | TCGA-AA-3672-01 | Colorectum | colon adenocarcinoma | Female | >=65 | III/IV | Unknown | Unknown | SD | |||
| GNPNAT1 | deletion | Frame_Shift_Del | c.162delN | p.Phe54LeufsTer7 | p.F54Lfs*7 | Q96EK6 | protein_coding | TCGA-AA-3877-01 | Colorectum | colon adenocarcinoma | Female | >=65 | I/II | Unknown | Unknown | SD | |||
| GNPNAT1 | SNV | Missense_Mutation | novel | c.237G>T | p.Lys79Asn | p.K79N | Q96EK6 | protein_coding | deleterious(0) | possibly_damaging(0.788) | TCGA-A5-A2K5-01 | Endometrium | uterine corpus endometrioid carcinoma | Female | >=65 | I/II | Unknown | Unknown | SD |
| GNPNAT1 | SNV | Missense_Mutation | novel | c.358N>A | p.Glu120Lys | p.E120K | Q96EK6 | protein_coding | deleterious(0) | probably_damaging(0.979) | TCGA-AP-A0LM-01 | Endometrium | uterine corpus endometrioid carcinoma | Female | <65 | III/IV | Chemotherapy | cisplatin | SD |
| GNPNAT1 | SNV | Missense_Mutation | rs377466243 | c.539G>A | p.Arg180Gln | p.R180Q | Q96EK6 | protein_coding | tolerated(0.49) | benign(0) | TCGA-AP-A1DK-01 | Endometrium | uterine corpus endometrioid carcinoma | Female | <65 | I/II | Unknown | Unknown | SD |
| GNPNAT1 | SNV | Missense_Mutation | novel | c.35N>T | p.Ser12Ile | p.S12I | Q96EK6 | protein_coding | deleterious(0.03) | benign(0.017) | TCGA-AX-A2HD-01 | Endometrium | uterine corpus endometrioid carcinoma | Female | >=65 | III/IV | Unknown | Unknown | SD |
| GNPNAT1 | SNV | Missense_Mutation | novel | c.29A>T | p.Asp10Val | p.D10V | Q96EK6 | protein_coding | deleterious(0) | possibly_damaging(0.506) | TCGA-BG-A222-01 | Endometrium | uterine corpus endometrioid carcinoma | Female | <65 | I/II | Unknown | Unknown | SD |
| GNPNAT1 | deletion | Frame_Shift_Del | c.162delN | p.Phe54LeufsTer7 | p.F54Lfs*7 | Q96EK6 | protein_coding | TCGA-BS-A0U8-01 | Endometrium | uterine corpus endometrioid carcinoma | Female | <65 | III/IV | Chemotherapy | doxorubicin | SD |
| Page: 1 2 3 |
Top |
Related drugs of malignant transformation related genes |
| Identification of chemicals and drugs interact with genes involved in malignant transfromation |
| (DGIdb 4.0) |
| Entrez ID | Symbol | Category | Interaction Types | Drug Claim Name | Drug Name | PMIDs |
| Page: 1 |

Copyright 2023-Present -The University of Texas Health Science Center at Houston |