
|
|||||
|
 | |
| |
| |
| |
| |
| |
|
Gene: GNPDA1 |
Gene summary for GNPDA1 |
| Gene information | Species | Human | Gene symbol | GNPDA1 | Gene ID | 10007 |
| Gene name | glucosamine-6-phosphate deaminase 1 | |
| Gene Alias | GNP1 | |
| Cytomap | 5q31.3 | |
| Gene Type | protein-coding | GO ID | GO:0000003 | UniProtAcc | P46926 |
Top |
Malignant transformation analysis |
| Identification of the aberrant gene expression in precancerous and cancerous lesions by comparing the gene expression of stem-like cells in diseased tissues with normal stem cells |
| Entrez ID | Symbol | Replicates | Species | Organ | Tissue | Adj P-value | Log2FC | Malignancy |
| 10007 | GNPDA1 | HTA11_3410_2000001011 | Human | Colorectum | AD | 8.58e-05 | 1.33e-01 | 0.0155 |
| 10007 | GNPDA1 | HTA11_2487_2000001011 | Human | Colorectum | SER | 6.16e-07 | 2.52e-01 | -0.1808 |
| 10007 | GNPDA1 | HTA11_1938_2000001011 | Human | Colorectum | AD | 1.20e-03 | 1.99e-01 | -0.0811 |
| 10007 | GNPDA1 | HTA11_347_2000001011 | Human | Colorectum | AD | 6.99e-15 | 3.32e-01 | -0.1954 |
| 10007 | GNPDA1 | HTA11_83_2000001011 | Human | Colorectum | SER | 3.93e-02 | 2.02e-01 | -0.1526 |
| 10007 | GNPDA1 | HTA11_696_2000001011 | Human | Colorectum | AD | 8.35e-07 | 2.67e-01 | -0.1464 |
| 10007 | GNPDA1 | HTA11_866_2000001011 | Human | Colorectum | AD | 2.18e-07 | 2.15e-01 | -0.1001 |
| 10007 | GNPDA1 | HTA11_1391_2000001011 | Human | Colorectum | AD | 4.99e-04 | 2.12e-01 | -0.059 |
| 10007 | GNPDA1 | HTA11_866_3004761011 | Human | Colorectum | AD | 7.07e-16 | 3.25e-01 | 0.096 |
| 10007 | GNPDA1 | HTA11_4255_2000001011 | Human | Colorectum | SER | 1.15e-04 | 3.60e-01 | 0.0446 |
| 10007 | GNPDA1 | HTA11_8622_2000001021 | Human | Colorectum | SER | 2.21e-05 | 3.10e-01 | 0.0528 |
| 10007 | GNPDA1 | HTA11_7663_2000001011 | Human | Colorectum | SER | 7.32e-07 | 4.65e-01 | 0.0131 |
| 10007 | GNPDA1 | HTA11_10711_2000001011 | Human | Colorectum | AD | 2.32e-03 | 2.02e-01 | 0.0338 |
| 10007 | GNPDA1 | HTA11_7696_3000711011 | Human | Colorectum | AD | 2.90e-13 | 3.37e-01 | 0.0674 |
| 10007 | GNPDA1 | HTA11_6818_2000001021 | Human | Colorectum | AD | 3.20e-03 | 2.44e-01 | 0.0588 |
| 10007 | GNPDA1 | HTA11_99999970781_79442 | Human | Colorectum | MSS | 6.35e-15 | 4.12e-01 | 0.294 |
| 10007 | GNPDA1 | HTA11_99999965062_69753 | Human | Colorectum | MSI-H | 1.86e-02 | 5.77e-01 | 0.3487 |
| 10007 | GNPDA1 | HTA11_99999965104_69814 | Human | Colorectum | MSS | 1.04e-11 | 3.63e-01 | 0.281 |
| 10007 | GNPDA1 | HTA11_99999971662_82457 | Human | Colorectum | MSS | 2.30e-25 | 6.28e-01 | 0.3859 |
| 10007 | GNPDA1 | HTA11_99999973899_84307 | Human | Colorectum | MSS | 1.26e-09 | 4.28e-01 | 0.2585 |
| Page: 1 2 3 4 5 6 7 |
| Tissue | Expression Dynamics | Abbreviation |
| Colorectum (GSE201348) |  | FAP: Familial adenomatous polyposis |
| CRC: Colorectal cancer | ||
| Colorectum (HTA11) |  | AD: Adenomas |
| SER: Sessile serrated lesions | ||
| MSI-H: Microsatellite-high colorectal cancer | ||
| MSS: Microsatellite stable colorectal cancer | ||
| Esophagus |  | ESCC: Esophageal squamous cell carcinoma |
| HGIN: High-grade intraepithelial neoplasias | ||
| LGIN: Low-grade intraepithelial neoplasias | ||
| Liver | 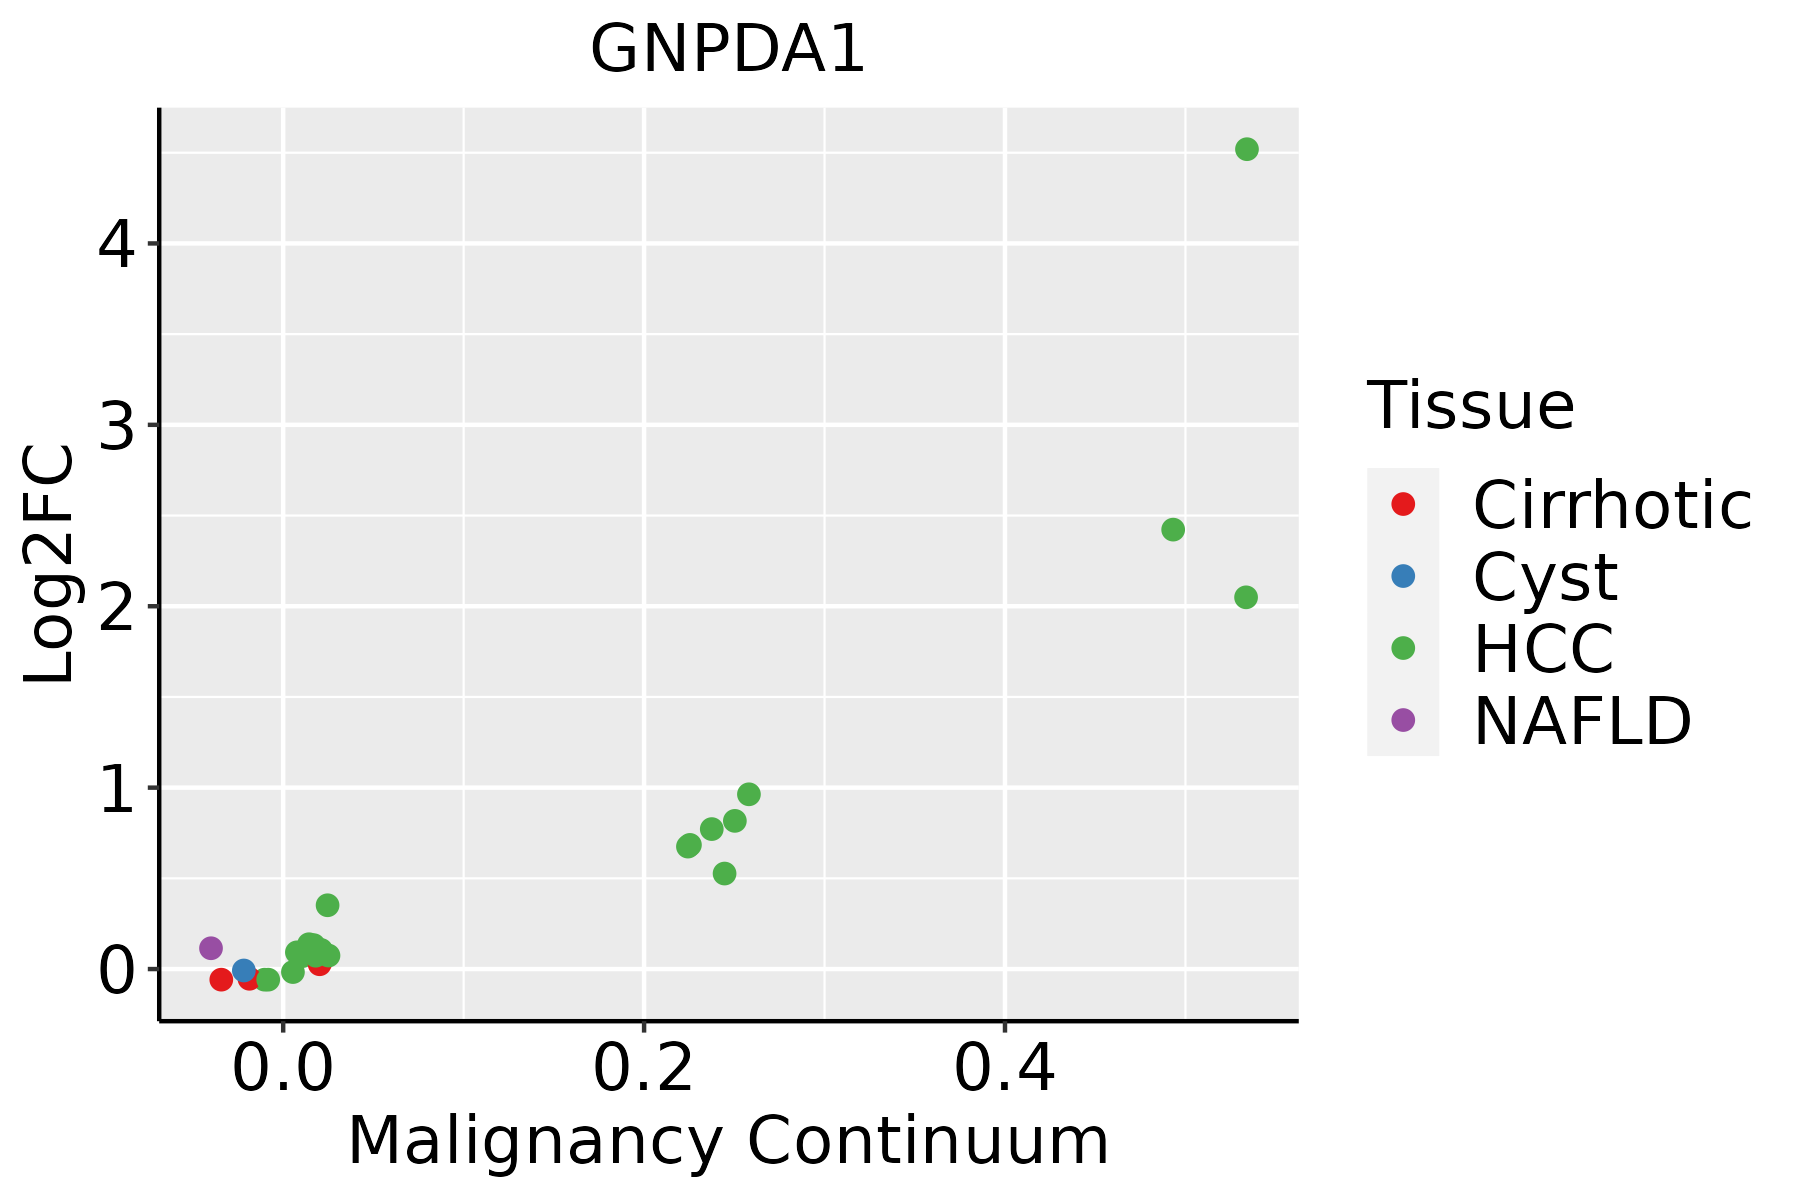 | HCC: Hepatocellular carcinoma |
| NAFLD: Non-alcoholic fatty liver disease | ||
| Oral Cavity | 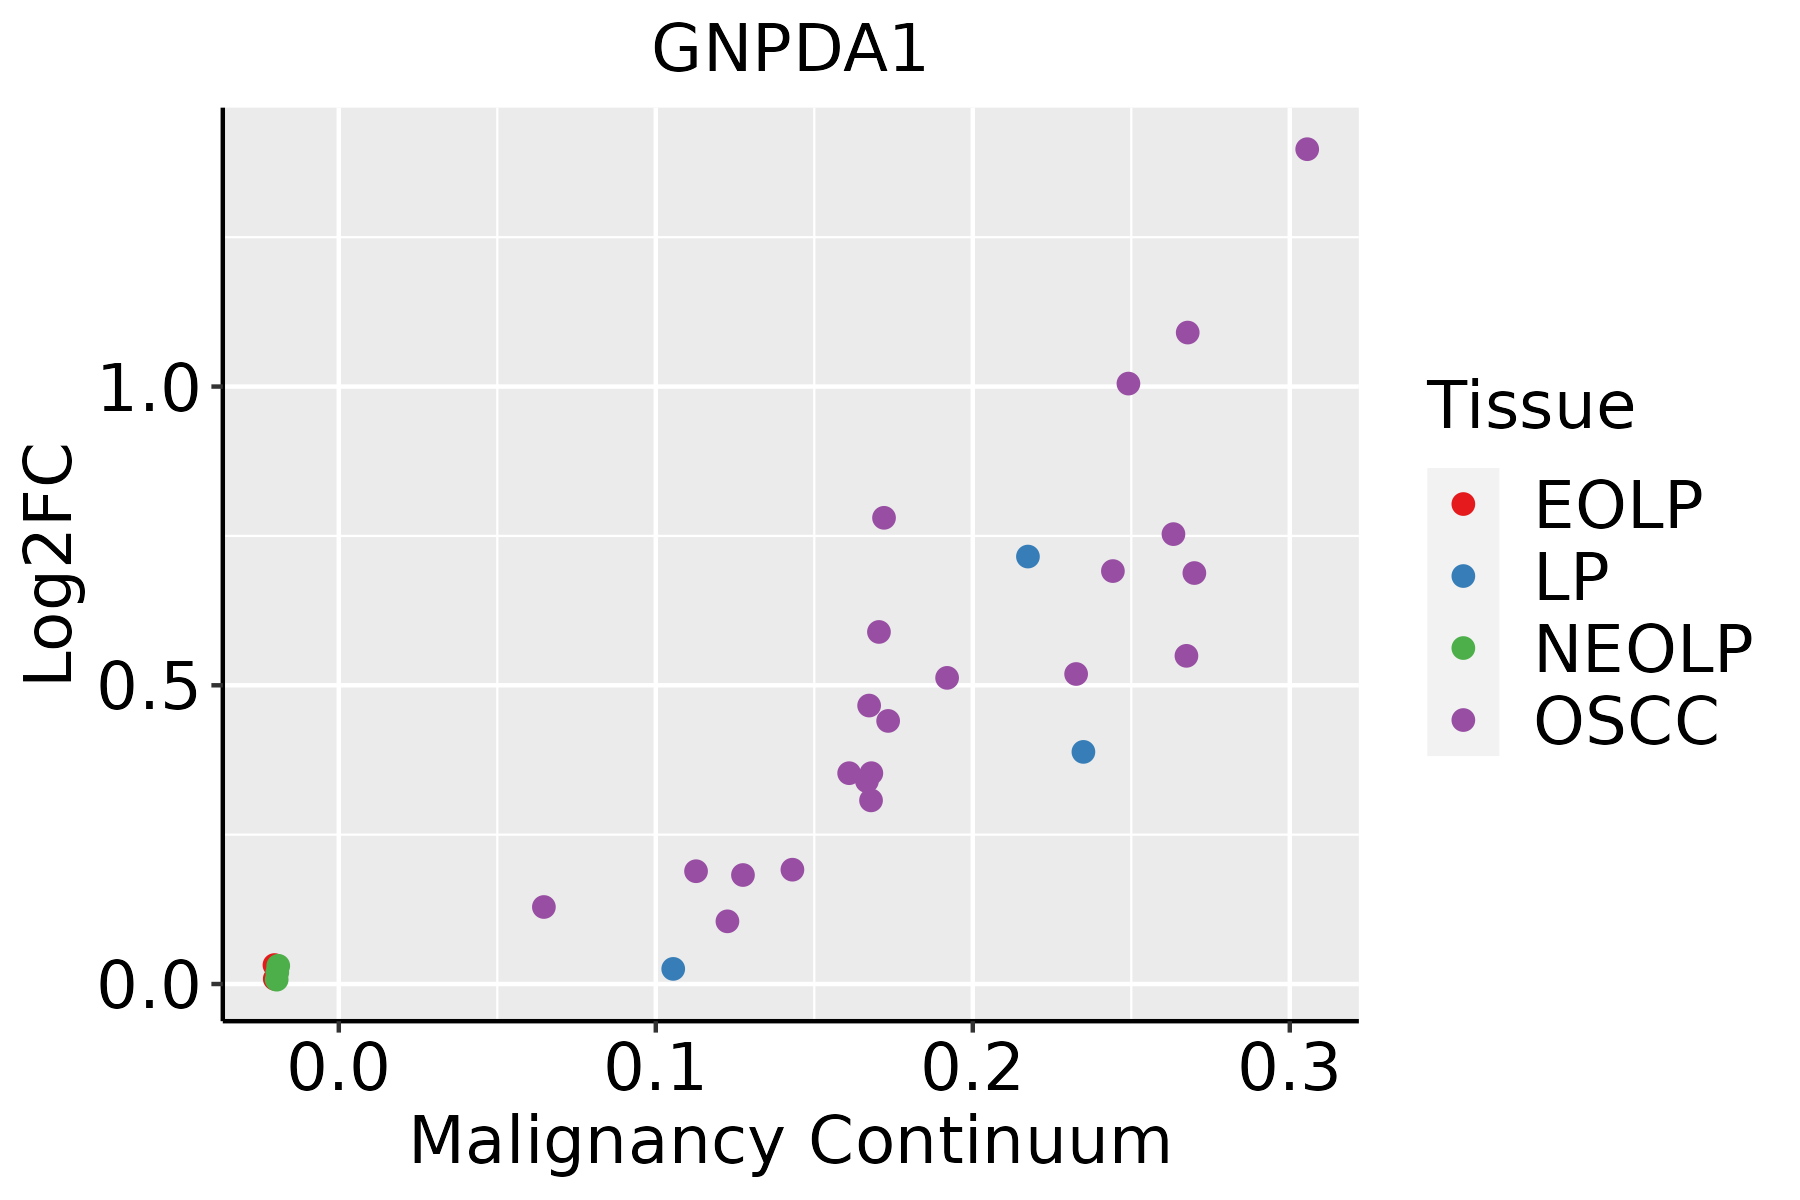 | EOLP: Erosive Oral lichen planus |
| LP: leukoplakia | ||
| NEOLP: Non-erosive oral lichen planus | ||
| OSCC: Oral squamous cell carcinoma | ||
| Skin | 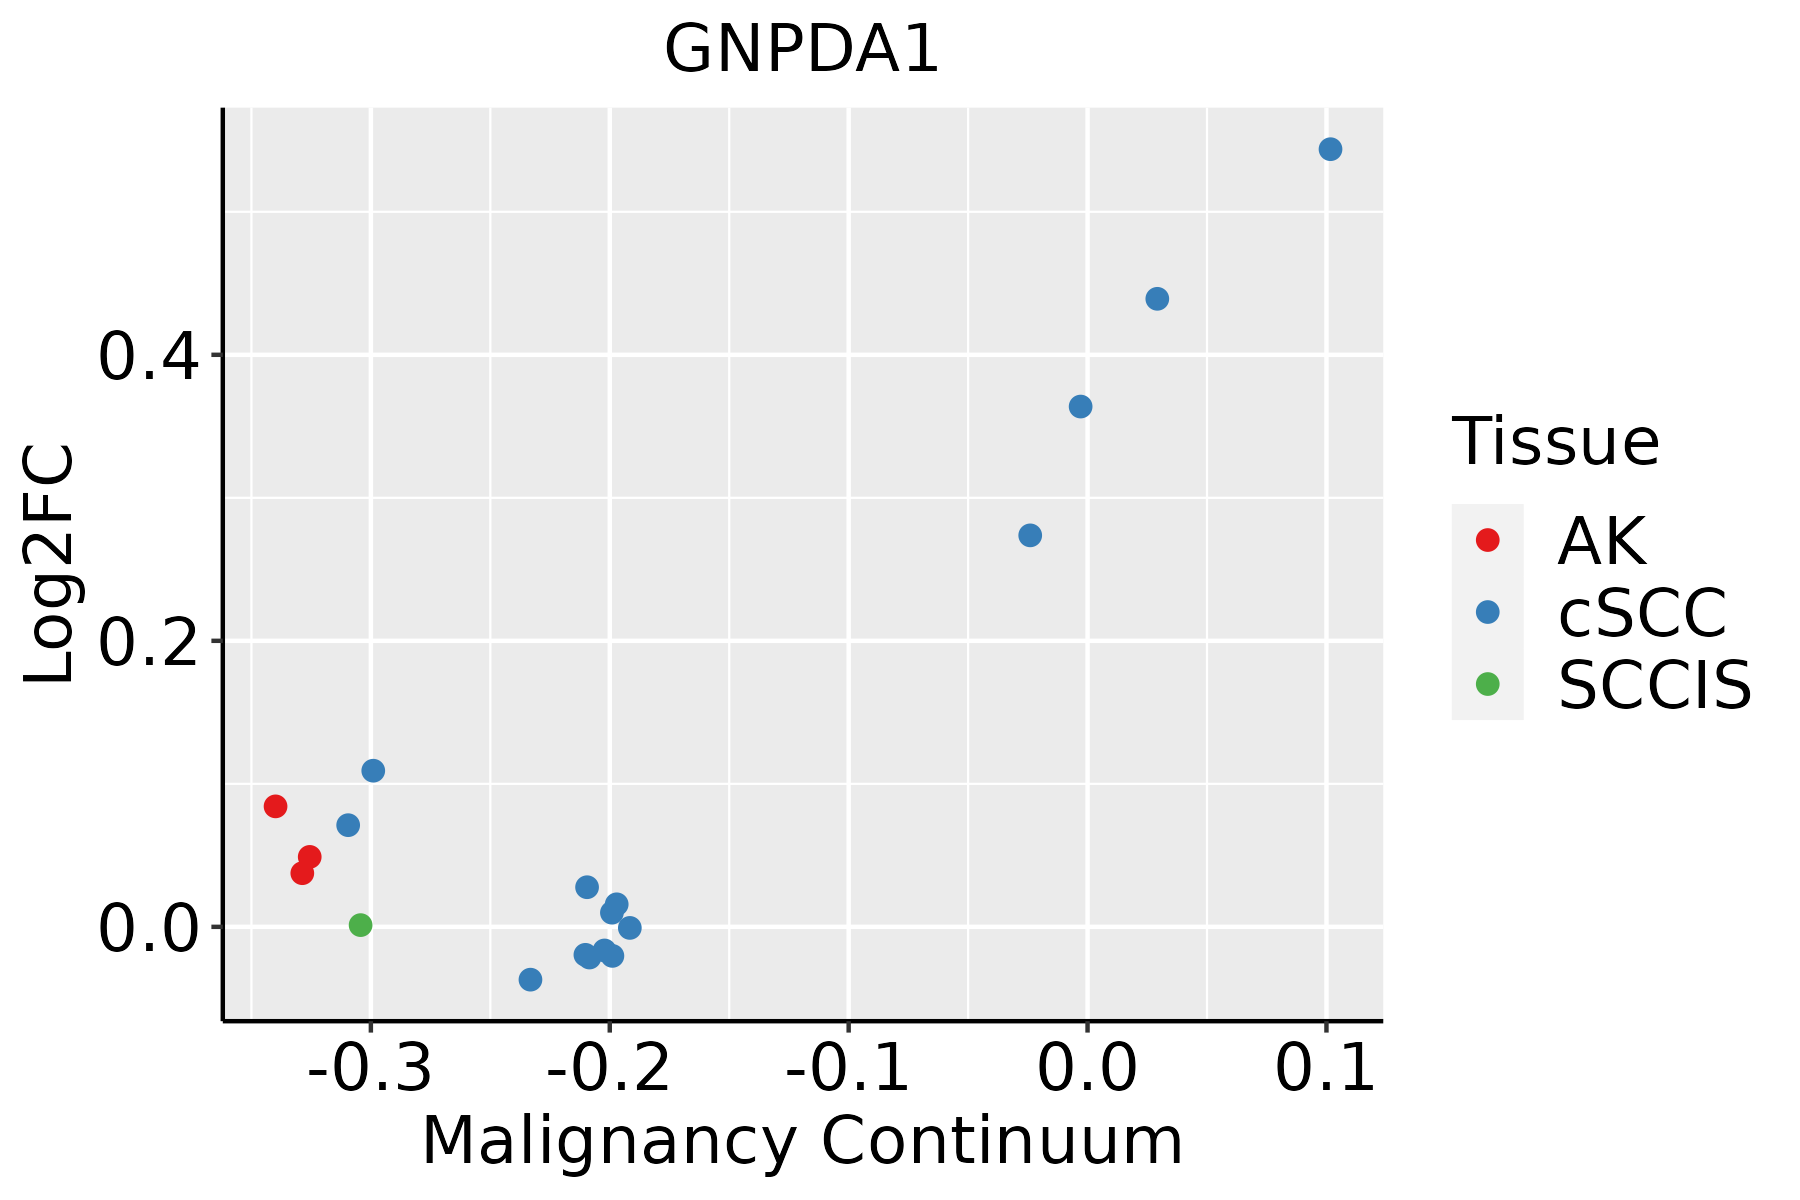 | AK: Actinic keratosis |
| cSCC: Cutaneous squamous cell carcinoma | ||
| SCCIS:squamous cell carcinoma in situ | ||
| Thyroid | 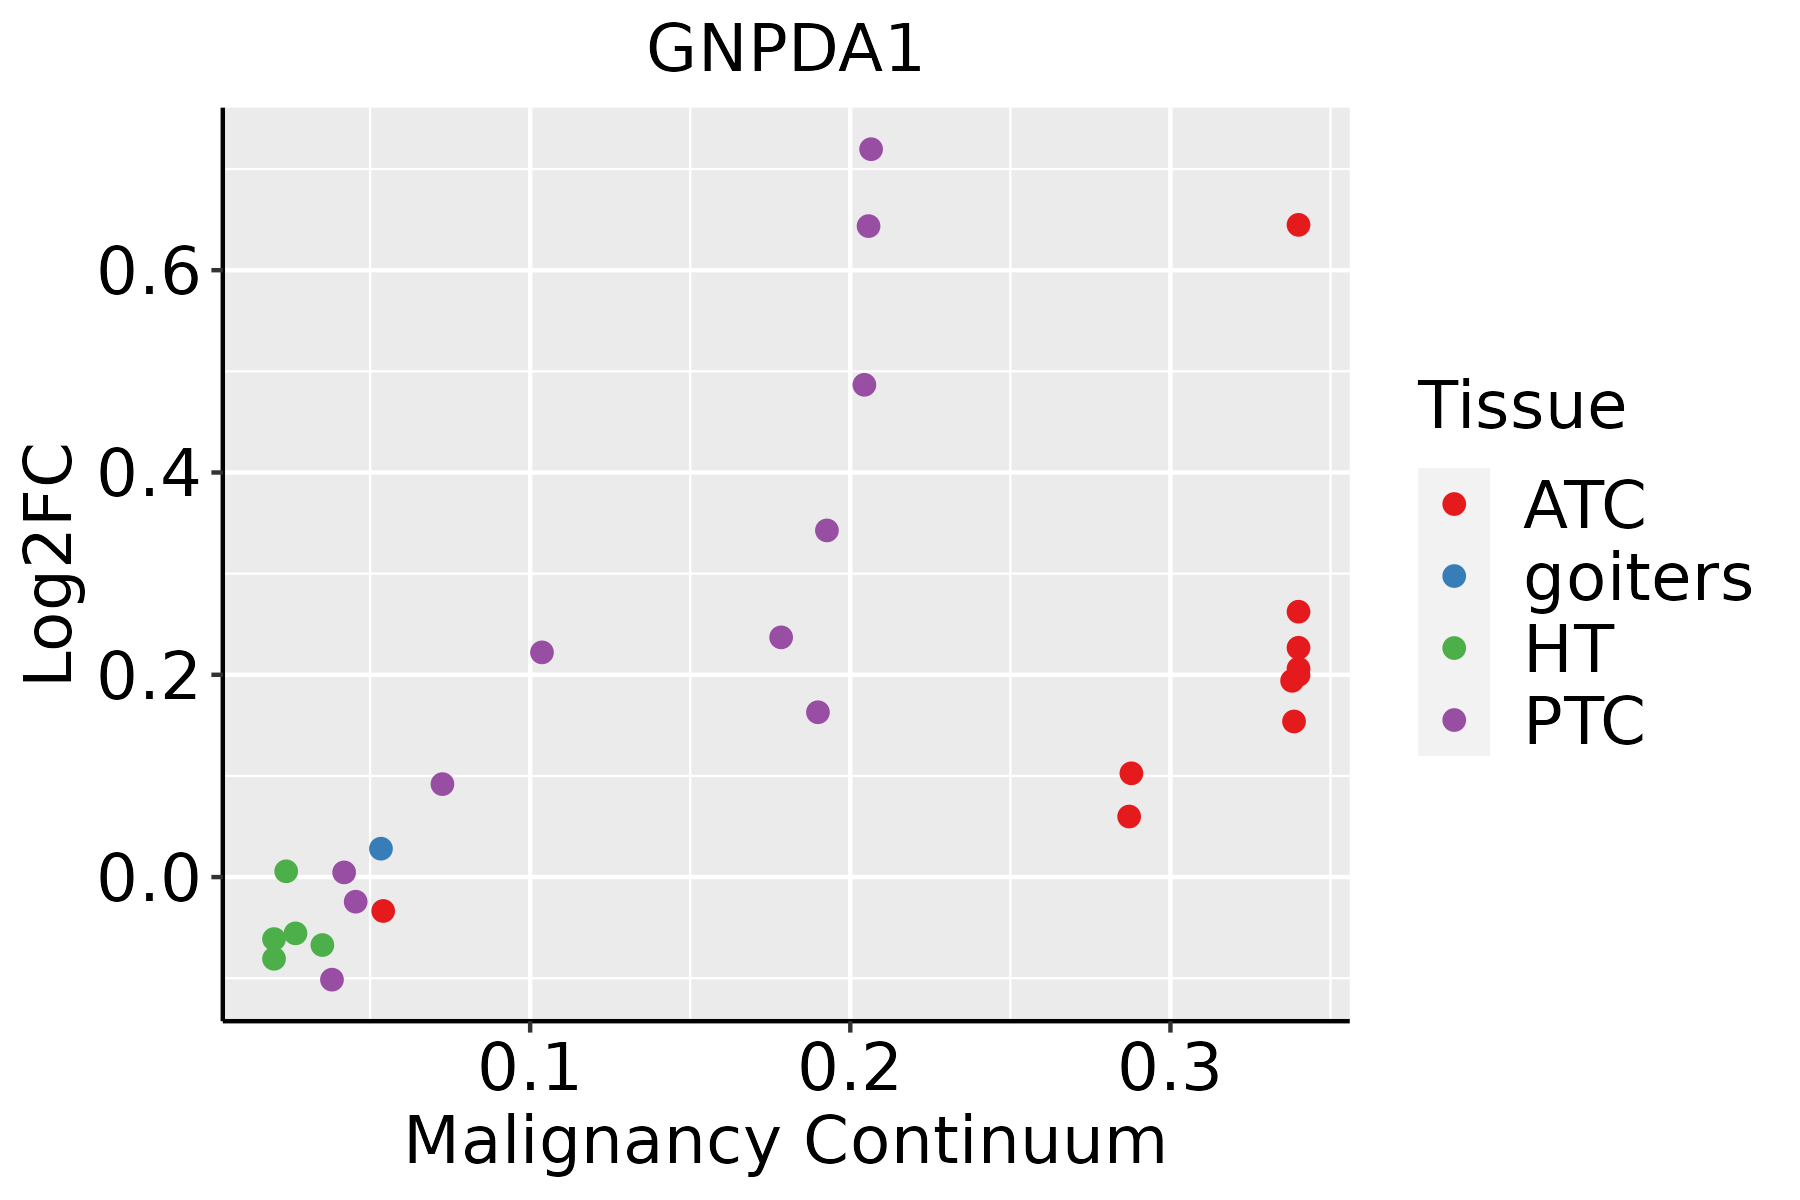 | ATC: Anaplastic thyroid cancer |
| HT: Hashimoto's thyroiditis | ||
| PTC: Papillary thyroid cancer |
| ∗log2FC in expression of this searched gene in stem-like cells from each diseased tissue sample relative to stem-like cells in normal samples in each tissue plotted against the malignancy continuum. Samples are colored based on if they are from different disease stage. |
Top |
Malignant transformation related pathway analysis |
| Find out the enriched GO biological processes and KEGG pathways involved in transition from healthy to precancer to cancer |
| Tissue | Disease Stage | Enriched GO biological Processes |
| Colorectum | AD |  |
| Colorectum | SER |  |
| Colorectum | MSS |  |
| Colorectum | MSI-H |  |
| Colorectum | FAP |  |
| ∗Top 15 enriched GO BP terms are showed in the bar plot of each disease state in each tissue. Each row represents a significant GO biological process which is colored according to the -log10(p.adjust). |
| Page: 1 2 3 4 5 6 7 8 9 |
| GO ID | Tissue | Disease Stage | Description | Gene Ratio | Bg Ratio | pvalue | p.adjust | Count |
| GO:0006091 | Colorectum | AD | generation of precursor metabolites and energy | 209/3918 | 490/18723 | 3.17e-28 | 6.61e-25 | 209 |
| GO:0044282 | Colorectum | AD | small molecule catabolic process | 118/3918 | 376/18723 | 1.05e-06 | 3.55e-05 | 118 |
| GO:0016054 | Colorectum | AD | organic acid catabolic process | 73/3918 | 240/18723 | 3.20e-04 | 3.81e-03 | 73 |
| GO:0046395 | Colorectum | AD | carboxylic acid catabolic process | 70/3918 | 236/18723 | 9.06e-04 | 8.71e-03 | 70 |
| GO:0009225 | Colorectum | AD | nucleotide-sugar metabolic process | 16/3918 | 36/18723 | 1.27e-03 | 1.12e-02 | 16 |
| GO:00060911 | Colorectum | SER | generation of precursor metabolites and energy | 168/2897 | 490/18723 | 1.39e-25 | 1.70e-22 | 168 |
| GO:00442821 | Colorectum | SER | small molecule catabolic process | 87/2897 | 376/18723 | 5.31e-05 | 1.27e-03 | 87 |
| GO:00160541 | Colorectum | SER | organic acid catabolic process | 53/2897 | 240/18723 | 4.04e-03 | 3.30e-02 | 53 |
| GO:00092251 | Colorectum | SER | nucleotide-sugar metabolic process | 12/2897 | 36/18723 | 6.11e-03 | 4.42e-02 | 12 |
| GO:00060912 | Colorectum | MSS | generation of precursor metabolites and energy | 186/3467 | 490/18723 | 1.14e-24 | 2.15e-21 | 186 |
| GO:00442822 | Colorectum | MSS | small molecule catabolic process | 94/3467 | 376/18723 | 9.85e-04 | 9.86e-03 | 94 |
| GO:00092252 | Colorectum | MSS | nucleotide-sugar metabolic process | 14/3467 | 36/18723 | 3.40e-03 | 2.56e-02 | 14 |
| GO:00160542 | Colorectum | MSS | organic acid catabolic process | 61/3467 | 240/18723 | 4.72e-03 | 3.31e-02 | 61 |
| GO:00060913 | Colorectum | MSI-H | generation of precursor metabolites and energy | 93/1319 | 490/18723 | 7.35e-19 | 3.14e-16 | 93 |
| GO:0006091110 | Esophagus | ESCC | generation of precursor metabolites and energy | 331/8552 | 490/18723 | 3.86e-23 | 8.45e-21 | 331 |
| GO:00092256 | Esophagus | ESCC | nucleotide-sugar metabolic process | 29/8552 | 36/18723 | 1.91e-05 | 1.67e-04 | 29 |
| GO:19011362 | Esophagus | ESCC | carbohydrate derivative catabolic process | 99/8552 | 172/18723 | 1.11e-03 | 5.54e-03 | 99 |
| GO:00442827 | Esophagus | ESCC | small molecule catabolic process | 201/8552 | 376/18723 | 1.35e-03 | 6.41e-03 | 201 |
| GO:00092262 | Esophagus | ESCC | nucleotide-sugar biosynthetic process | 14/8552 | 19/18723 | 1.27e-02 | 4.21e-02 | 14 |
| GO:000609122 | Liver | HCC | generation of precursor metabolites and energy | 340/7958 | 490/18723 | 4.04e-34 | 2.85e-31 | 340 |
| Page: 1 2 3 |
| Pathway ID | Tissue | Disease Stage | Description | Gene Ratio | Bg Ratio | pvalue | p.adjust | qvalue | Count |
| hsa005202 | Esophagus | ESCC | Amino sugar and nucleotide sugar metabolism | 35/4205 | 49/8465 | 1.60e-03 | 4.88e-03 | 2.50e-03 | 35 |
| hsa0052011 | Esophagus | ESCC | Amino sugar and nucleotide sugar metabolism | 35/4205 | 49/8465 | 1.60e-03 | 4.88e-03 | 2.50e-03 | 35 |
| hsa00520 | Oral cavity | OSCC | Amino sugar and nucleotide sugar metabolism | 34/3704 | 49/8465 | 2.48e-04 | 8.08e-04 | 4.11e-04 | 34 |
| hsa005201 | Oral cavity | OSCC | Amino sugar and nucleotide sugar metabolism | 34/3704 | 49/8465 | 2.48e-04 | 8.08e-04 | 4.11e-04 | 34 |
| Page: 1 |
Top |
Cell-cell communication analysis |
| Identification of potential cell-cell interactions between two cell types and their ligand-receptor pairs for different disease states |
| Ligand | Receptor | LRpair | Pathway | Tissue | Disease Stage |
| Page: 1 |
Top |
Single-cell gene regulatory network inference analysis |
| Find out the significant the regulons (TFs) and the target genes of each regulon across cell types for different disease states |
| TF | Cell Type | Tissue | Disease Stage | Target Gene | RSS | Regulon Activity |
| ∗The dot plots of a searched regulon are shown for all cell subpopulations in each disease state of each tissue based on the regulon specific score inferred using pySCENIC and by calculating the average expression. |
| Page: 1 |
Top |
Somatic mutation of malignant transformation related genes |
| Annotation of somatic variants for genes involved in malignant transformation |
| Hugo Symbol | Variant Class | Variant Classification | dbSNP RS | HGVSc | HGVSp | HGVSp Short | SWISSPROT | BIOTYPE | SIFT | PolyPhen | Tumor Sample Barcode | Tissue | Histology | Sex | Age | Stage | Therapy Types | Drugs | Outcome |
| GNPDA1 | SNV | Missense_Mutation | novel | c.361N>A | p.Phe121Ile | p.F121I | P46926 | protein_coding | deleterious(0) | possibly_damaging(0.699) | TCGA-A2-A0EV-01 | Breast | breast invasive carcinoma | Female | >=65 | I/II | Unknown | Unknown | SD |
| GNPDA1 | insertion | Frame_Shift_Ins | novel | c.294_295insGGGAGGG | p.Ile99GlyfsTer23 | p.I99Gfs*23 | P46926 | protein_coding | TCGA-A8-A06X-01 | Breast | breast invasive carcinoma | Female | >=65 | I/II | Unknown | Unknown | SD | ||
| GNPDA1 | insertion | Frame_Shift_Ins | novel | c.293_294insAGTGAGGAGCGTCTCCGCCCGGCAGCCACCCCGTC | p.Asp98GlufsTer74 | p.D98Efs*74 | P46926 | protein_coding | TCGA-A8-A06X-01 | Breast | breast invasive carcinoma | Female | >=65 | I/II | Unknown | Unknown | SD | ||
| GNPDA1 | SNV | Missense_Mutation | novel | c.94N>A | p.Glu32Lys | p.E32K | P46926 | protein_coding | tolerated(0.07) | benign(0.009) | TCGA-VS-A958-01 | Cervix | cervical & endocervical cancer | Female | <65 | I/II | Chemotherapy | cisplatin | CR |
| GNPDA1 | SNV | Missense_Mutation | novel | c.809N>G | p.Tyr270Cys | p.Y270C | P46926 | protein_coding | tolerated_low_confidence(0.19) | benign(0.001) | TCGA-CA-6717-01 | Colorectum | colon adenocarcinoma | Male | <65 | I/II | Chemotherapy | oxaliplatin | CR |
| GNPDA1 | SNV | Missense_Mutation | c.834G>T | p.Glu278Asp | p.E278D | P46926 | protein_coding | tolerated_low_confidence(0.08) | benign(0.006) | TCGA-CA-6718-01 | Colorectum | colon adenocarcinoma | Male | <65 | I/II | Unknown | Unknown | PD | |
| GNPDA1 | SNV | Missense_Mutation | c.289A>T | p.Ile97Phe | p.I97F | P46926 | protein_coding | deleterious(0) | possibly_damaging(0.896) | TCGA-CK-4951-01 | Colorectum | colon adenocarcinoma | Female | >=65 | I/II | Unknown | Unknown | PD | |
| GNPDA1 | SNV | Missense_Mutation | novel | c.286N>T | p.His96Tyr | p.H96Y | P46926 | protein_coding | deleterious(0.01) | benign(0.234) | TCGA-A5-A0G2-01 | Endometrium | uterine corpus endometrioid carcinoma | Female | <65 | III/IV | Unknown | Unknown | SD |
| GNPDA1 | SNV | Missense_Mutation | c.96N>T | p.Glu32Asp | p.E32D | P46926 | protein_coding | tolerated(1) | benign(0) | TCGA-A5-A0GP-01 | Endometrium | uterine corpus endometrioid carcinoma | Female | <65 | I/II | Unknown | Unknown | SD | |
| GNPDA1 | SNV | Missense_Mutation | rs756028847 | c.737N>G | p.Glu246Gly | p.E246G | P46926 | protein_coding | deleterious(0) | probably_damaging(0.994) | TCGA-AX-A1CE-01 | Endometrium | uterine corpus endometrioid carcinoma | Female | <65 | I/II | Unspecific | Paclitaxel | SD |
| Page: 1 2 3 |
Top |
Related drugs of malignant transformation related genes |
| Identification of chemicals and drugs interact with genes involved in malignant transfromation |
| (DGIdb 4.0) |
| Entrez ID | Symbol | Category | Interaction Types | Drug Claim Name | Drug Name | PMIDs |
| Page: 1 |

Copyright 2023-Present -The University of Texas Health Science Center at Houston |