
|
|||||
|
 | |
| |
| |
| |
| |
| |
|
Gene: GNL3L |
Gene summary for GNL3L |
| Gene information | Species | Human | Gene symbol | GNL3L | Gene ID | 54552 |
| Gene name | G protein nucleolar 3 like | |
| Gene Alias | GNL3B | |
| Cytomap | Xp11.22 | |
| Gene Type | protein-coding | GO ID | GO:0000723 | UniProtAcc | A0A024R9Y6 |
Top |
Malignant transformation analysis |
| Identification of the aberrant gene expression in precancerous and cancerous lesions by comparing the gene expression of stem-like cells in diseased tissues with normal stem cells |
| Entrez ID | Symbol | Replicates | Species | Organ | Tissue | Adj P-value | Log2FC | Malignancy |
| 54552 | GNL3L | LZE2T | Human | Esophagus | ESCC | 3.56e-02 | 5.10e-01 | 0.082 |
| 54552 | GNL3L | LZE4T | Human | Esophagus | ESCC | 1.71e-03 | 1.58e-01 | 0.0811 |
| 54552 | GNL3L | LZE7T | Human | Esophagus | ESCC | 1.94e-07 | 4.11e-01 | 0.0667 |
| 54552 | GNL3L | LZE8T | Human | Esophagus | ESCC | 7.74e-04 | 1.74e-01 | 0.067 |
| 54552 | GNL3L | LZE20T | Human | Esophagus | ESCC | 1.44e-02 | 1.82e-01 | 0.0662 |
| 54552 | GNL3L | LZE21D1 | Human | Esophagus | HGIN | 5.62e-05 | 3.26e-01 | 0.0632 |
| 54552 | GNL3L | LZE22D1 | Human | Esophagus | HGIN | 6.66e-03 | 2.15e-01 | 0.0595 |
| 54552 | GNL3L | LZE22T | Human | Esophagus | ESCC | 2.02e-02 | 3.31e-01 | 0.068 |
| 54552 | GNL3L | LZE24T | Human | Esophagus | ESCC | 2.60e-16 | 4.22e-01 | 0.0596 |
| 54552 | GNL3L | P1T-E | Human | Esophagus | ESCC | 1.32e-07 | 3.09e-01 | 0.0875 |
| 54552 | GNL3L | P2T-E | Human | Esophagus | ESCC | 6.62e-20 | 3.46e-01 | 0.1177 |
| 54552 | GNL3L | P4T-E | Human | Esophagus | ESCC | 5.62e-19 | 3.65e-01 | 0.1323 |
| 54552 | GNL3L | P5T-E | Human | Esophagus | ESCC | 1.88e-11 | 2.14e-01 | 0.1327 |
| 54552 | GNL3L | P8T-E | Human | Esophagus | ESCC | 3.52e-19 | 2.71e-01 | 0.0889 |
| 54552 | GNL3L | P9T-E | Human | Esophagus | ESCC | 7.62e-08 | 2.04e-01 | 0.1131 |
| 54552 | GNL3L | P10T-E | Human | Esophagus | ESCC | 9.56e-08 | 1.59e-01 | 0.116 |
| 54552 | GNL3L | P11T-E | Human | Esophagus | ESCC | 2.28e-06 | 3.45e-01 | 0.1426 |
| 54552 | GNL3L | P12T-E | Human | Esophagus | ESCC | 7.31e-14 | 2.96e-01 | 0.1122 |
| 54552 | GNL3L | P15T-E | Human | Esophagus | ESCC | 3.50e-10 | 2.15e-01 | 0.1149 |
| 54552 | GNL3L | P16T-E | Human | Esophagus | ESCC | 2.86e-20 | 3.03e-01 | 0.1153 |
| Page: 1 2 3 4 |
| Tissue | Expression Dynamics | Abbreviation |
| Esophagus | 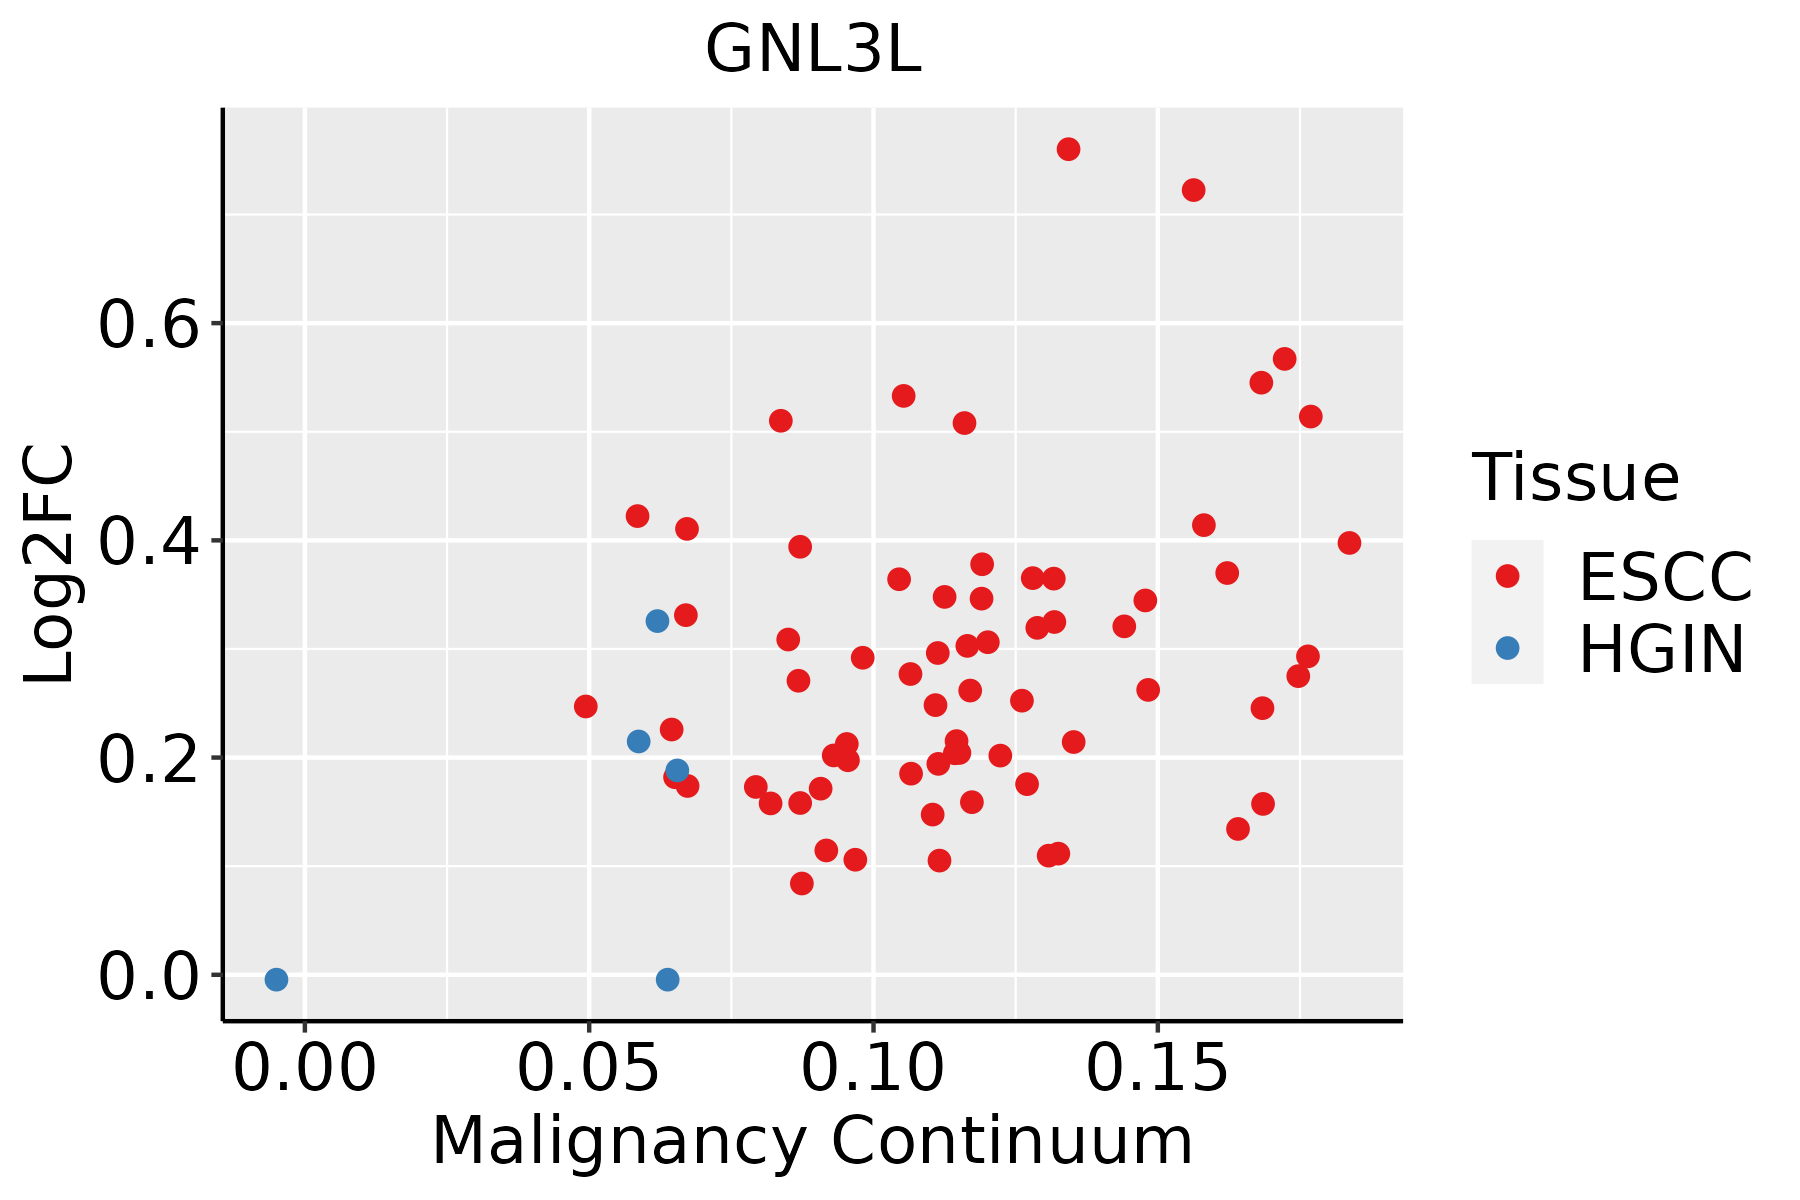 | ESCC: Esophageal squamous cell carcinoma |
| HGIN: High-grade intraepithelial neoplasias | ||
| LGIN: Low-grade intraepithelial neoplasias | ||
| Liver | 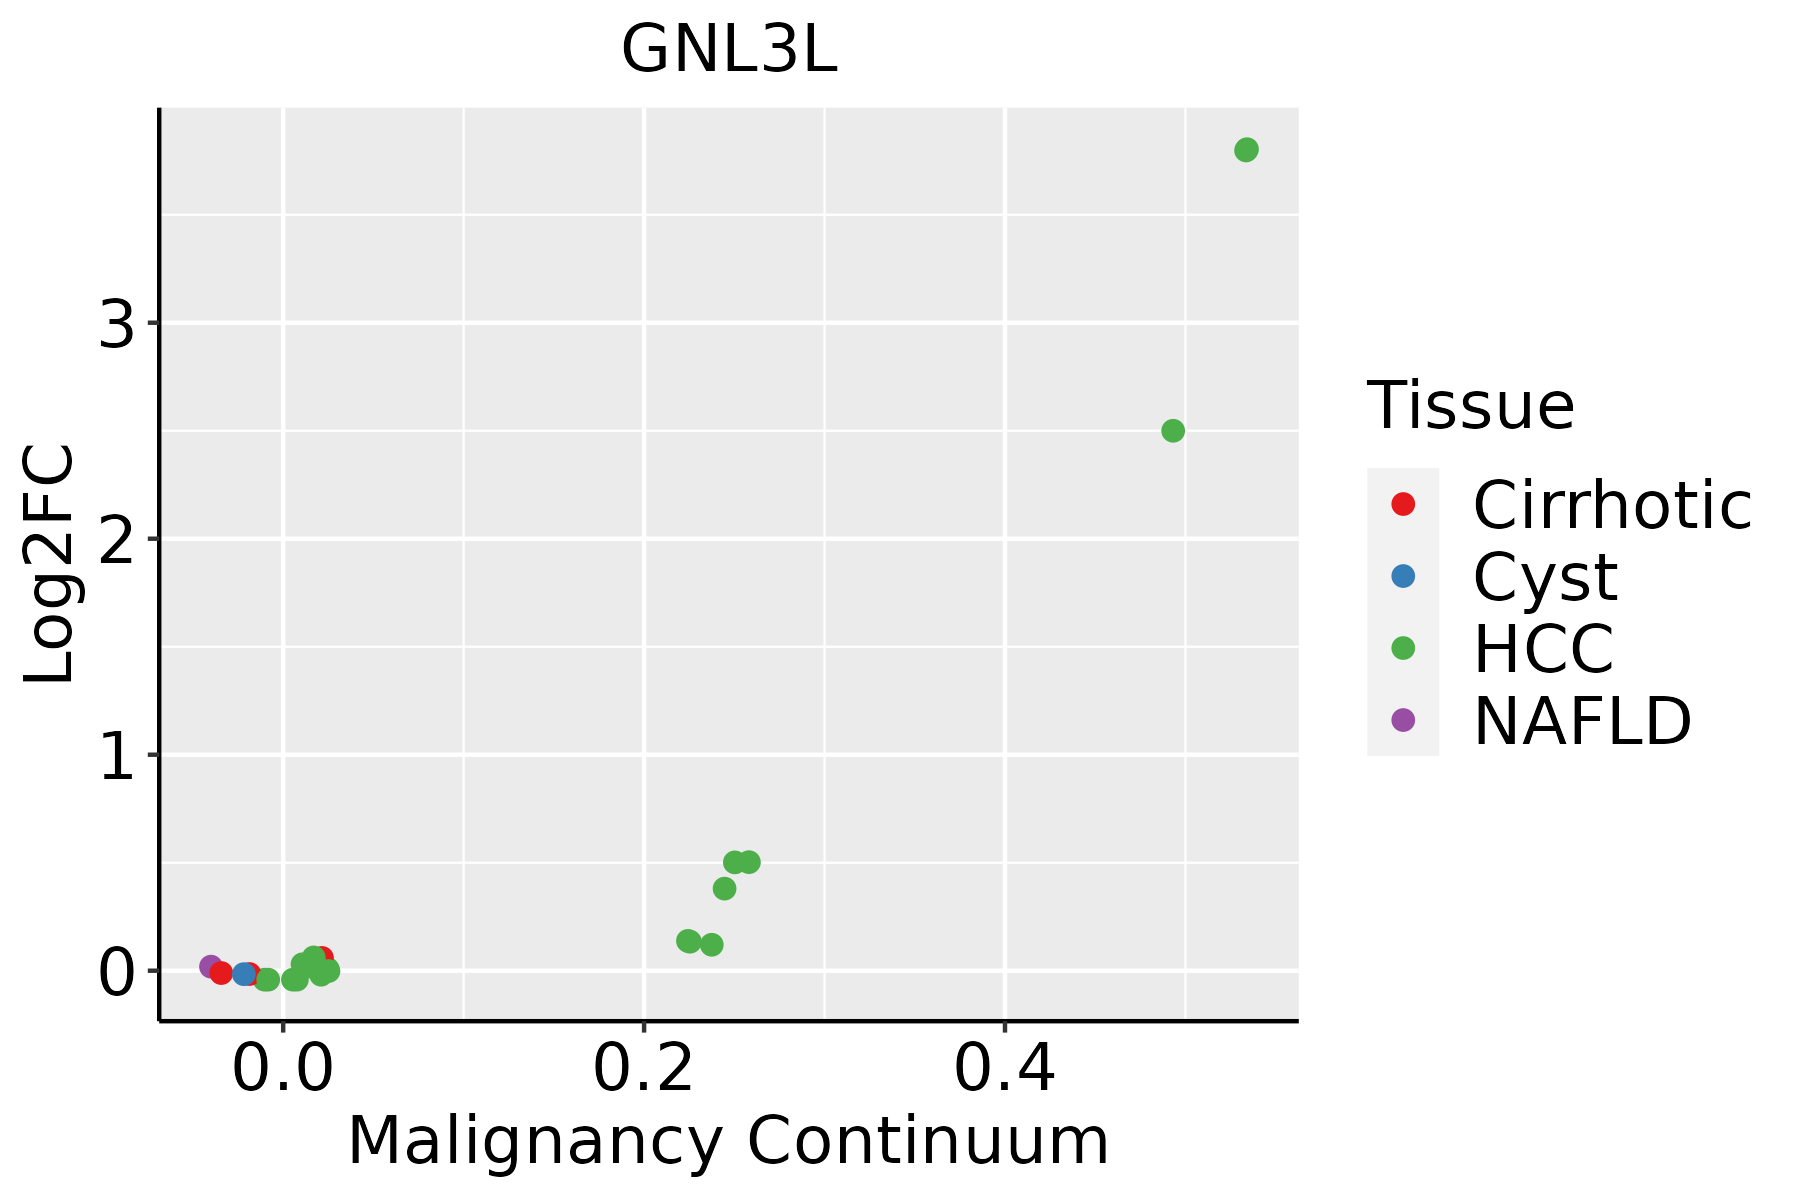 | HCC: Hepatocellular carcinoma |
| NAFLD: Non-alcoholic fatty liver disease | ||
| Thyroid | 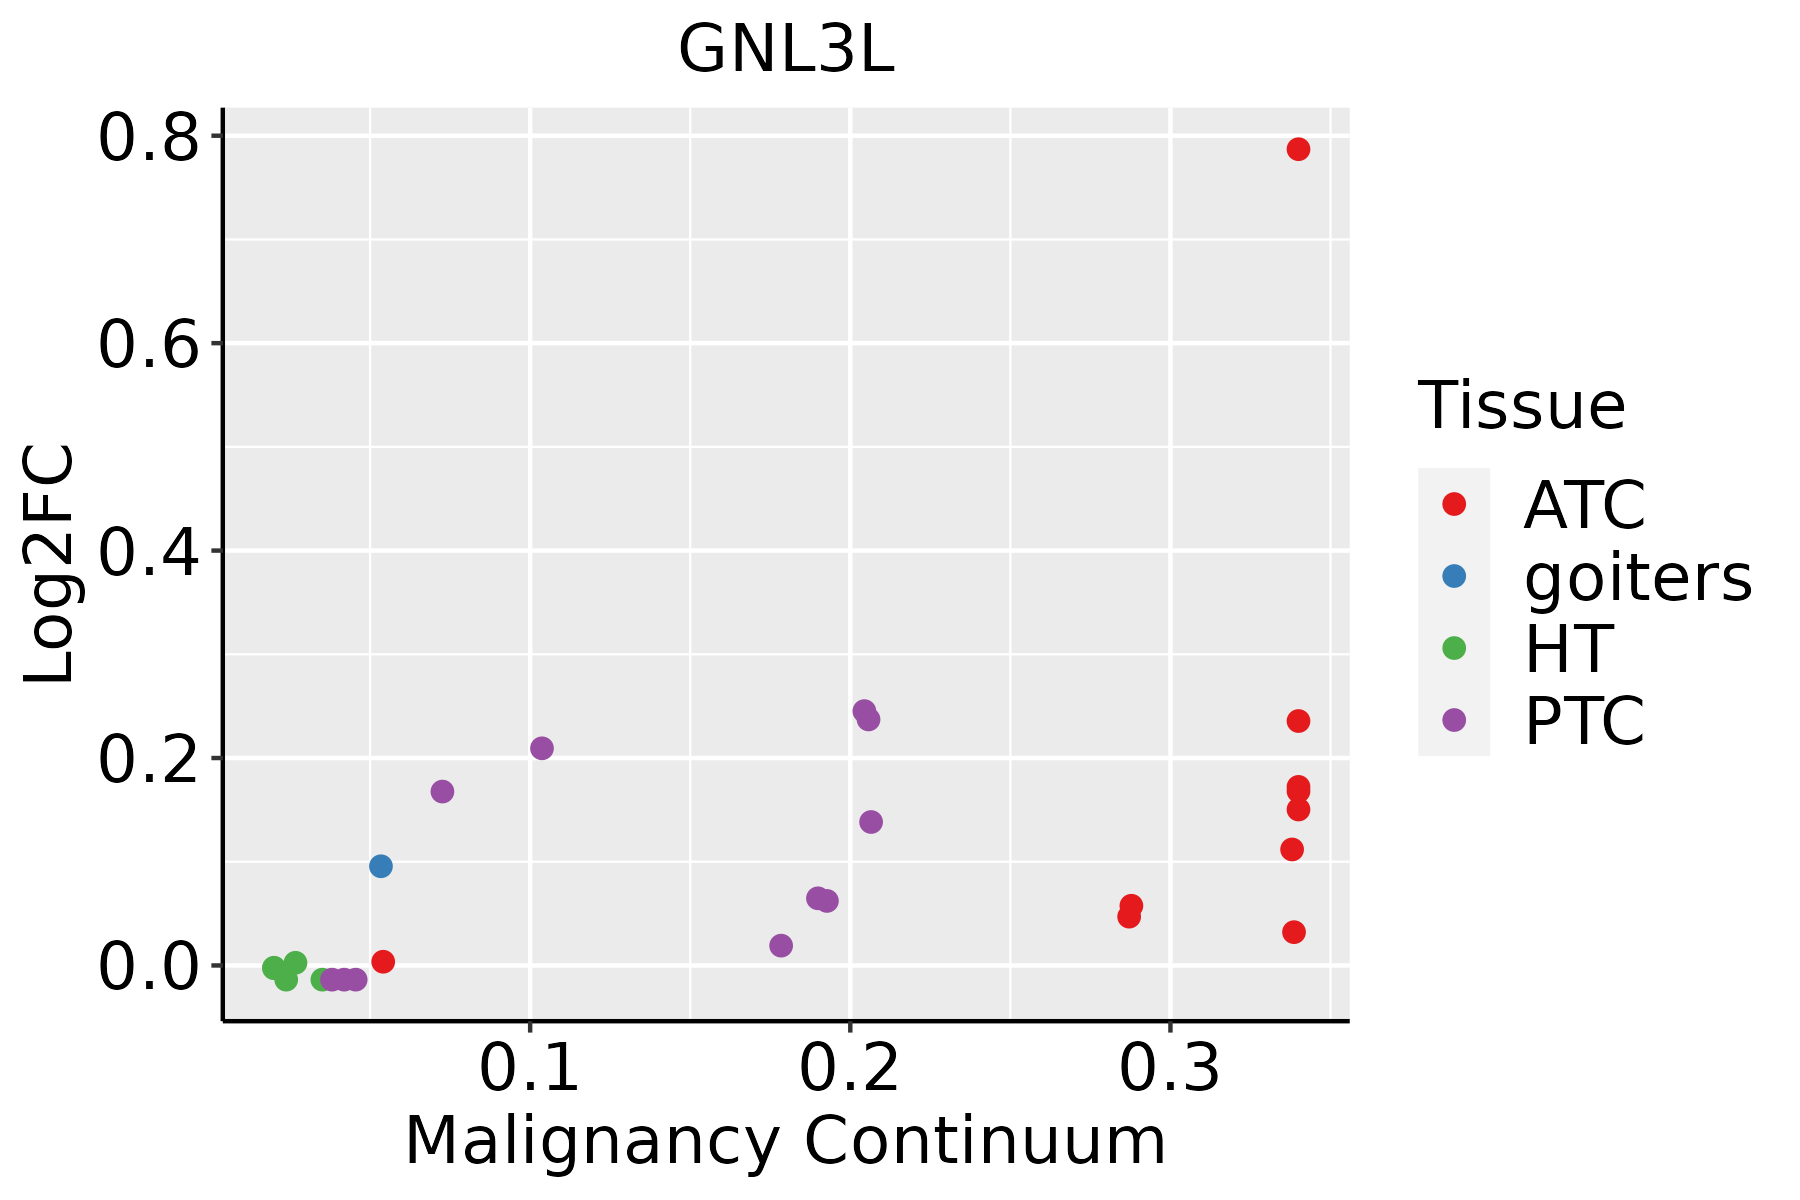 | ATC: Anaplastic thyroid cancer |
| HT: Hashimoto's thyroiditis | ||
| PTC: Papillary thyroid cancer |
| ∗log2FC in expression of this searched gene in stem-like cells from each diseased tissue sample relative to stem-like cells in normal samples in each tissue plotted against the malignancy continuum. Samples are colored based on if they are from different disease stage. |
Top |
Malignant transformation related pathway analysis |
| Find out the enriched GO biological processes and KEGG pathways involved in transition from healthy to precancer to cancer |
| Tissue | Disease Stage | Enriched GO biological Processes |
| Colorectum | AD |  |
| Colorectum | SER |  |
| Colorectum | MSS |  |
| Colorectum | MSI-H |  |
| Colorectum | FAP |  |
| ∗Top 15 enriched GO BP terms are showed in the bar plot of each disease state in each tissue. Each row represents a significant GO biological process which is colored according to the -log10(p.adjust). |
| Page: 1 2 3 4 5 6 7 8 9 |
| GO ID | Tissue | Disease Stage | Description | Gene Ratio | Bg Ratio | pvalue | p.adjust | Count |
| GO:002261327 | Esophagus | HGIN | ribonucleoprotein complex biogenesis | 158/2587 | 463/18723 | 2.61e-29 | 5.23e-26 | 158 |
| GO:004225426 | Esophagus | HGIN | ribosome biogenesis | 101/2587 | 299/18723 | 8.74e-19 | 4.03e-16 | 101 |
| GO:003164727 | Esophagus | HGIN | regulation of protein stability | 96/2587 | 298/18723 | 2.21e-16 | 5.76e-14 | 96 |
| GO:190332027 | Esophagus | HGIN | regulation of protein modification by small protein conjugation or removal | 78/2587 | 242/18723 | 1.40e-13 | 2.26e-11 | 78 |
| GO:003139627 | Esophagus | HGIN | regulation of protein ubiquitination | 64/2587 | 210/18723 | 3.02e-10 | 2.71e-08 | 64 |
| GO:190382926 | Esophagus | HGIN | positive regulation of cellular protein localization | 75/2587 | 276/18723 | 3.19e-09 | 2.30e-07 | 75 |
| GO:190332127 | Esophagus | HGIN | negative regulation of protein modification by small protein conjugation or removal | 33/2587 | 95/18723 | 2.07e-07 | 9.95e-06 | 33 |
| GO:003139727 | Esophagus | HGIN | negative regulation of protein ubiquitination | 30/2587 | 83/18723 | 2.72e-07 | 1.28e-05 | 30 |
| GO:00182057 | Esophagus | HGIN | peptidyl-lysine modification | 88/2587 | 376/18723 | 2.99e-07 | 1.39e-05 | 88 |
| GO:003133425 | Esophagus | HGIN | positive regulation of protein-containing complex assembly | 61/2587 | 237/18723 | 7.10e-07 | 3.00e-05 | 61 |
| GO:00330449 | Esophagus | HGIN | regulation of chromosome organization | 51/2587 | 187/18723 | 8.91e-07 | 3.61e-05 | 51 |
| GO:004325427 | Esophagus | HGIN | regulation of protein-containing complex assembly | 94/2587 | 428/18723 | 2.39e-06 | 8.55e-05 | 94 |
| GO:001063920 | Esophagus | HGIN | negative regulation of organelle organization | 79/2587 | 348/18723 | 4.12e-06 | 1.37e-04 | 79 |
| GO:000072318 | Esophagus | HGIN | telomere maintenance | 38/2587 | 131/18723 | 4.38e-06 | 1.42e-04 | 38 |
| GO:003220416 | Esophagus | HGIN | regulation of telomere maintenance | 27/2587 | 80/18723 | 4.83e-06 | 1.56e-04 | 27 |
| GO:005105214 | Esophagus | HGIN | regulation of DNA metabolic process | 79/2587 | 359/18723 | 1.38e-05 | 3.85e-04 | 79 |
| GO:005109825 | Esophagus | HGIN | regulation of binding | 78/2587 | 363/18723 | 3.73e-05 | 9.30e-04 | 78 |
| GO:19048167 | Esophagus | HGIN | positive regulation of protein localization to chromosome, telomeric region | 8/2587 | 12/18723 | 3.87e-05 | 9.59e-04 | 8 |
| GO:007189710 | Esophagus | HGIN | DNA biosynthetic process | 44/2587 | 180/18723 | 8.97e-05 | 1.96e-03 | 44 |
| GO:00169254 | Esophagus | HGIN | protein sumoylation | 18/2587 | 53/18723 | 1.64e-04 | 3.19e-03 | 18 |
| Page: 1 2 3 4 5 6 7 8 9 |
| Pathway ID | Tissue | Disease Stage | Description | Gene Ratio | Bg Ratio | pvalue | p.adjust | qvalue | Count |
| Page: 1 |
Top |
Cell-cell communication analysis |
| Identification of potential cell-cell interactions between two cell types and their ligand-receptor pairs for different disease states |
| Ligand | Receptor | LRpair | Pathway | Tissue | Disease Stage |
| Page: 1 |
Top |
Single-cell gene regulatory network inference analysis |
| Find out the significant the regulons (TFs) and the target genes of each regulon across cell types for different disease states |
| TF | Cell Type | Tissue | Disease Stage | Target Gene | RSS | Regulon Activity |
| ∗The dot plots of a searched regulon are shown for all cell subpopulations in each disease state of each tissue based on the regulon specific score inferred using pySCENIC and by calculating the average expression. |
| Page: 1 |
Top |
Somatic mutation of malignant transformation related genes |
| Annotation of somatic variants for genes involved in malignant transformation |
| Hugo Symbol | Variant Class | Variant Classification | dbSNP RS | HGVSc | HGVSp | HGVSp Short | SWISSPROT | BIOTYPE | SIFT | PolyPhen | Tumor Sample Barcode | Tissue | Histology | Sex | Age | Stage | Therapy Types | Drugs | Outcome |
| GNL3L | SNV | Missense_Mutation | c.1486N>G | p.His496Asp | p.H496D | Q9NVN8 | protein_coding | tolerated(0.65) | benign(0.007) | TCGA-A2-A0YG-01 | Breast | breast invasive carcinoma | Female | <65 | III/IV | Chemotherapy | cytoxan | SD | |
| GNL3L | SNV | Missense_Mutation | c.695N>T | p.Gly232Val | p.G232V | Q9NVN8 | protein_coding | deleterious(0) | probably_damaging(0.997) | TCGA-AN-A0XR-01 | Breast | breast invasive carcinoma | Female | <65 | III/IV | Unknown | Unknown | SD | |
| GNL3L | SNV | Missense_Mutation | novel | c.949N>C | p.Thr317Pro | p.T317P | Q9NVN8 | protein_coding | tolerated(0.08) | benign(0.356) | TCGA-BH-A1FH-01 | Breast | breast invasive carcinoma | Female | <65 | III/IV | Unknown | Unknown | PD |
| GNL3L | SNV | Missense_Mutation | rs139639751 | c.283C>T | p.Arg95Cys | p.R95C | Q9NVN8 | protein_coding | deleterious(0.02) | probably_damaging(0.985) | TCGA-BH-A203-01 | Breast | breast invasive carcinoma | Female | >=65 | I/II | Unknown | Unknown | PD |
| GNL3L | SNV | Missense_Mutation | c.695N>C | p.Gly232Ala | p.G232A | Q9NVN8 | protein_coding | deleterious(0) | probably_damaging(0.988) | TCGA-C8-A275-01 | Breast | breast invasive carcinoma | Female | <65 | I/II | Unknown | Unknown | SD | |
| GNL3L | SNV | Missense_Mutation | c.907N>A | p.Asp303Asn | p.D303N | Q9NVN8 | protein_coding | deleterious(0.01) | probably_damaging(0.999) | TCGA-E2-A1LA-01 | Breast | breast invasive carcinoma | Female | <65 | I/II | Hormone Therapy | arimidex | SD | |
| GNL3L | SNV | Missense_Mutation | c.829G>T | p.Ala277Ser | p.A277S | Q9NVN8 | protein_coding | tolerated(0.09) | possibly_damaging(0.604) | TCGA-EW-A1IW-01 | Breast | breast invasive carcinoma | Female | >=65 | I/II | Hormone Therapy | aromasin | SD | |
| GNL3L | SNV | Missense_Mutation | rs780270239 | c.1595N>T | p.Thr532Met | p.T532M | Q9NVN8 | protein_coding | tolerated(0.12) | benign(0.045) | TCGA-GM-A2DC-01 | Breast | breast invasive carcinoma | Female | <65 | I/II | Chemotherapy | xeloda | CR |
| GNL3L | insertion | In_Frame_Ins | novel | c.1565_1566insTCCAGGCTCCTGTTCTTACCCAAGCCTGTGTCCCTA | p.Arg522_Arg523insProGlySerCysSerTyrProSerLeuCysProTyr | p.R522_R523insPGSCSYPSLCPY | Q9NVN8 | protein_coding | TCGA-A8-A07F-01 | Breast | breast invasive carcinoma | Female | >=65 | I/II | Hormone Therapy | tamoxiphen | SD | ||
| GNL3L | SNV | Missense_Mutation | rs772121803 | c.1358N>T | p.Thr453Met | p.T453M | Q9NVN8 | protein_coding | tolerated(0.33) | benign(0) | TCGA-2W-A8YY-01 | Cervix | cervical & endocervical cancer | Female | <65 | I/II | Chemotherapy | cisplatin | CR |
| Page: 1 2 3 4 5 6 7 8 |
Top |
Related drugs of malignant transformation related genes |
| Identification of chemicals and drugs interact with genes involved in malignant transfromation |
| (DGIdb 4.0) |
| Entrez ID | Symbol | Category | Interaction Types | Drug Claim Name | Drug Name | PMIDs |
| Page: 1 |

Copyright 2023-Present -The University of Texas Health Science Center at Houston |