
|
|||||
|
 | |
| |
| |
| |
| |
| |
|
Gene: GNL3 |
Gene summary for GNL3 |
| Gene information | Species | Human | Gene symbol | GNL3 | Gene ID | 26354 |
| Gene name | G protein nucleolar 3 | |
| Gene Alias | C77032 | |
| Cytomap | 3p21.1 | |
| Gene Type | protein-coding | GO ID | GO:0000723 | UniProtAcc | Q9BVP2 |
Top |
Malignant transformation analysis |
| Identification of the aberrant gene expression in precancerous and cancerous lesions by comparing the gene expression of stem-like cells in diseased tissues with normal stem cells |
| Entrez ID | Symbol | Replicates | Species | Organ | Tissue | Adj P-value | Log2FC | Malignancy |
| 26354 | GNL3 | LZE2T | Human | Esophagus | ESCC | 3.78e-07 | 4.39e-01 | 0.082 |
| 26354 | GNL3 | LZE4T | Human | Esophagus | ESCC | 5.67e-15 | 8.53e-02 | 0.0811 |
| 26354 | GNL3 | LZE5T | Human | Esophagus | ESCC | 1.33e-02 | 4.59e-01 | 0.0514 |
| 26354 | GNL3 | LZE7T | Human | Esophagus | ESCC | 3.20e-07 | 2.95e-01 | 0.0667 |
| 26354 | GNL3 | LZE8T | Human | Esophagus | ESCC | 1.80e-05 | 2.85e-02 | 0.067 |
| 26354 | GNL3 | LZE20T | Human | Esophagus | ESCC | 4.19e-04 | -1.41e-01 | 0.0662 |
| 26354 | GNL3 | LZE22D1 | Human | Esophagus | HGIN | 5.02e-04 | -6.46e-02 | 0.0595 |
| 26354 | GNL3 | LZE24T | Human | Esophagus | ESCC | 6.66e-11 | 5.55e-01 | 0.0596 |
| 26354 | GNL3 | LZE21T | Human | Esophagus | ESCC | 7.76e-06 | 6.98e-02 | 0.0655 |
| 26354 | GNL3 | LZE6T | Human | Esophagus | ESCC | 5.64e-05 | 1.76e-03 | 0.0845 |
| 26354 | GNL3 | P1T-E | Human | Esophagus | ESCC | 4.59e-08 | 7.05e-01 | 0.0875 |
| 26354 | GNL3 | P2T-E | Human | Esophagus | ESCC | 6.16e-17 | 2.59e-01 | 0.1177 |
| 26354 | GNL3 | P4T-E | Human | Esophagus | ESCC | 1.51e-20 | 6.73e-01 | 0.1323 |
| 26354 | GNL3 | P5T-E | Human | Esophagus | ESCC | 2.81e-14 | 2.74e-01 | 0.1327 |
| 26354 | GNL3 | P8T-E | Human | Esophagus | ESCC | 8.76e-11 | 2.99e-01 | 0.0889 |
| 26354 | GNL3 | P9T-E | Human | Esophagus | ESCC | 2.85e-19 | 5.53e-01 | 0.1131 |
| 26354 | GNL3 | P10T-E | Human | Esophagus | ESCC | 8.20e-35 | 5.18e-01 | 0.116 |
| 26354 | GNL3 | P11T-E | Human | Esophagus | ESCC | 7.38e-06 | 4.39e-01 | 0.1426 |
| 26354 | GNL3 | P12T-E | Human | Esophagus | ESCC | 5.36e-15 | 4.26e-01 | 0.1122 |
| 26354 | GNL3 | P15T-E | Human | Esophagus | ESCC | 3.25e-17 | 2.49e-01 | 0.1149 |
| Page: 1 2 3 4 5 6 7 |
| Tissue | Expression Dynamics | Abbreviation |
| Esophagus | 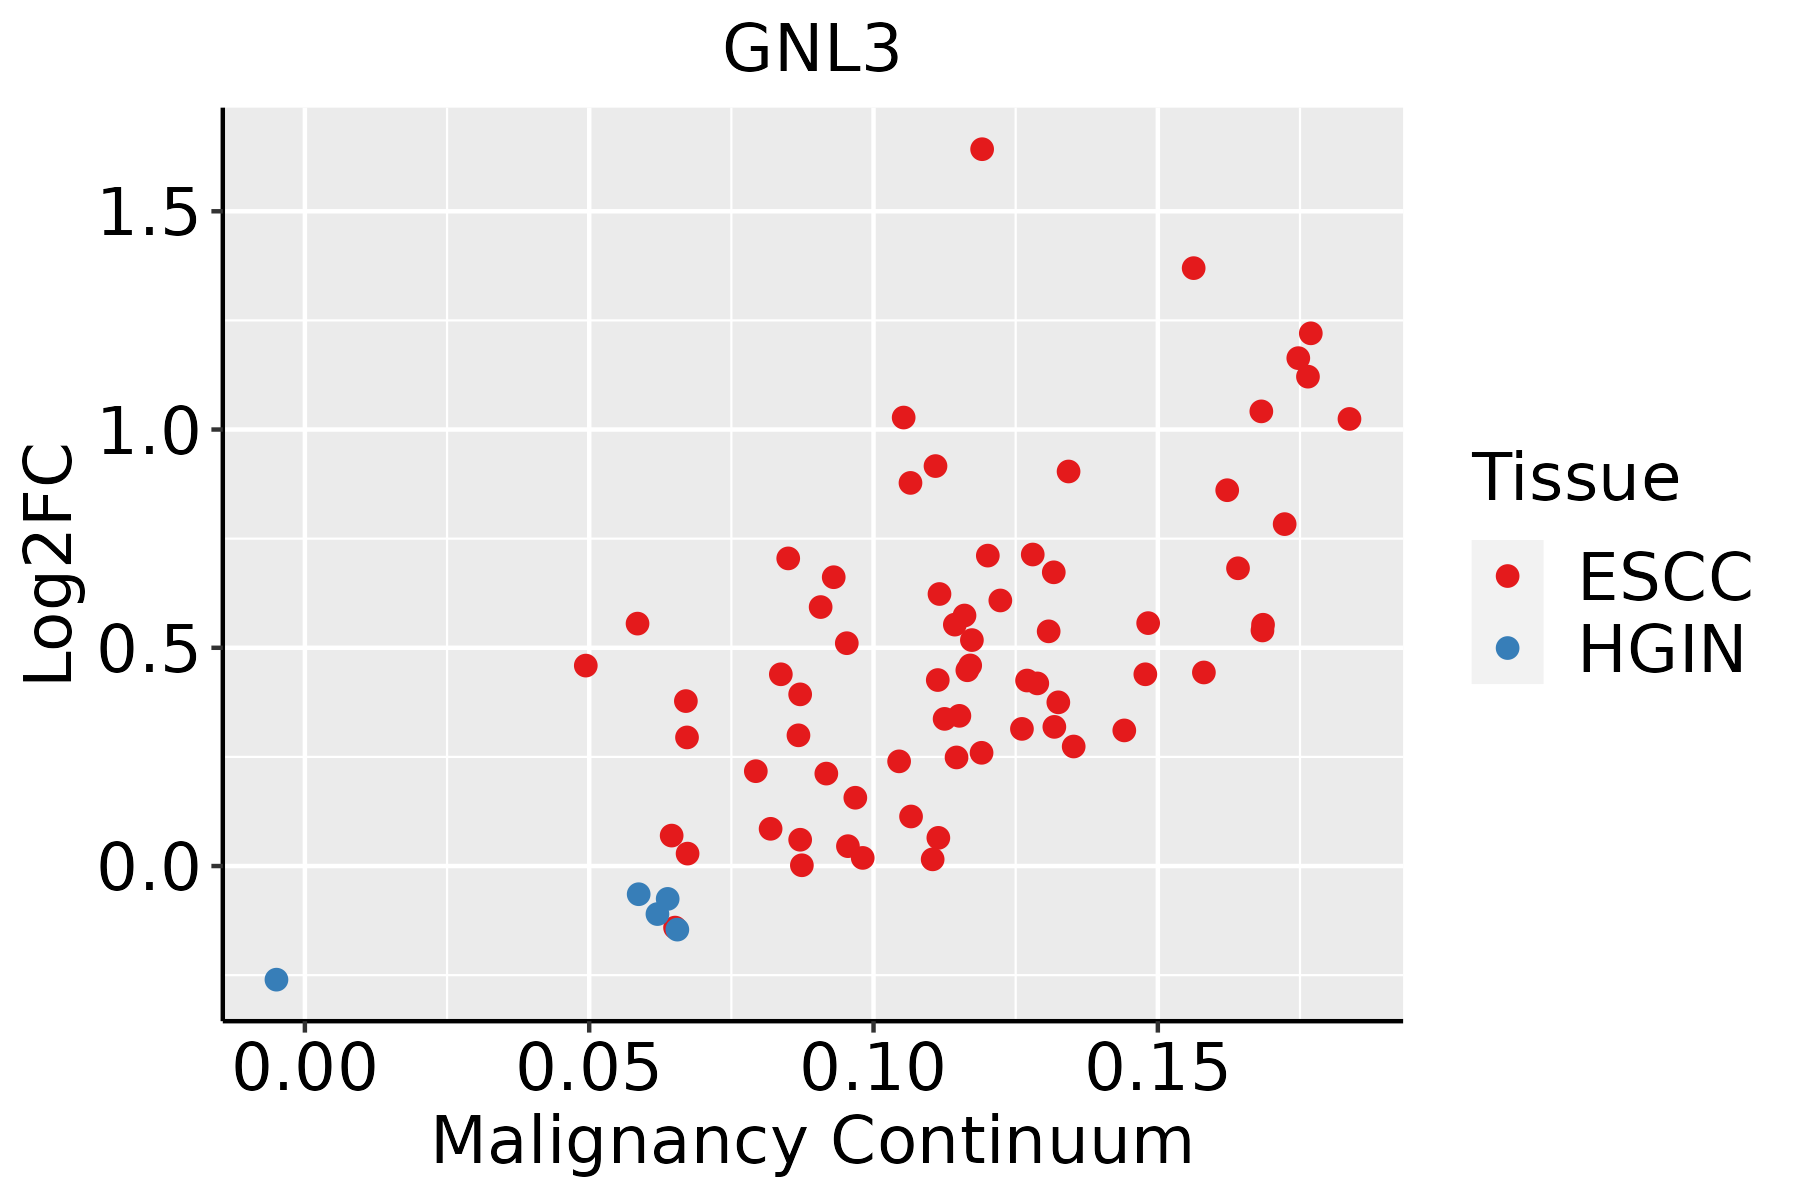 | ESCC: Esophageal squamous cell carcinoma |
| HGIN: High-grade intraepithelial neoplasias | ||
| LGIN: Low-grade intraepithelial neoplasias | ||
| Liver | 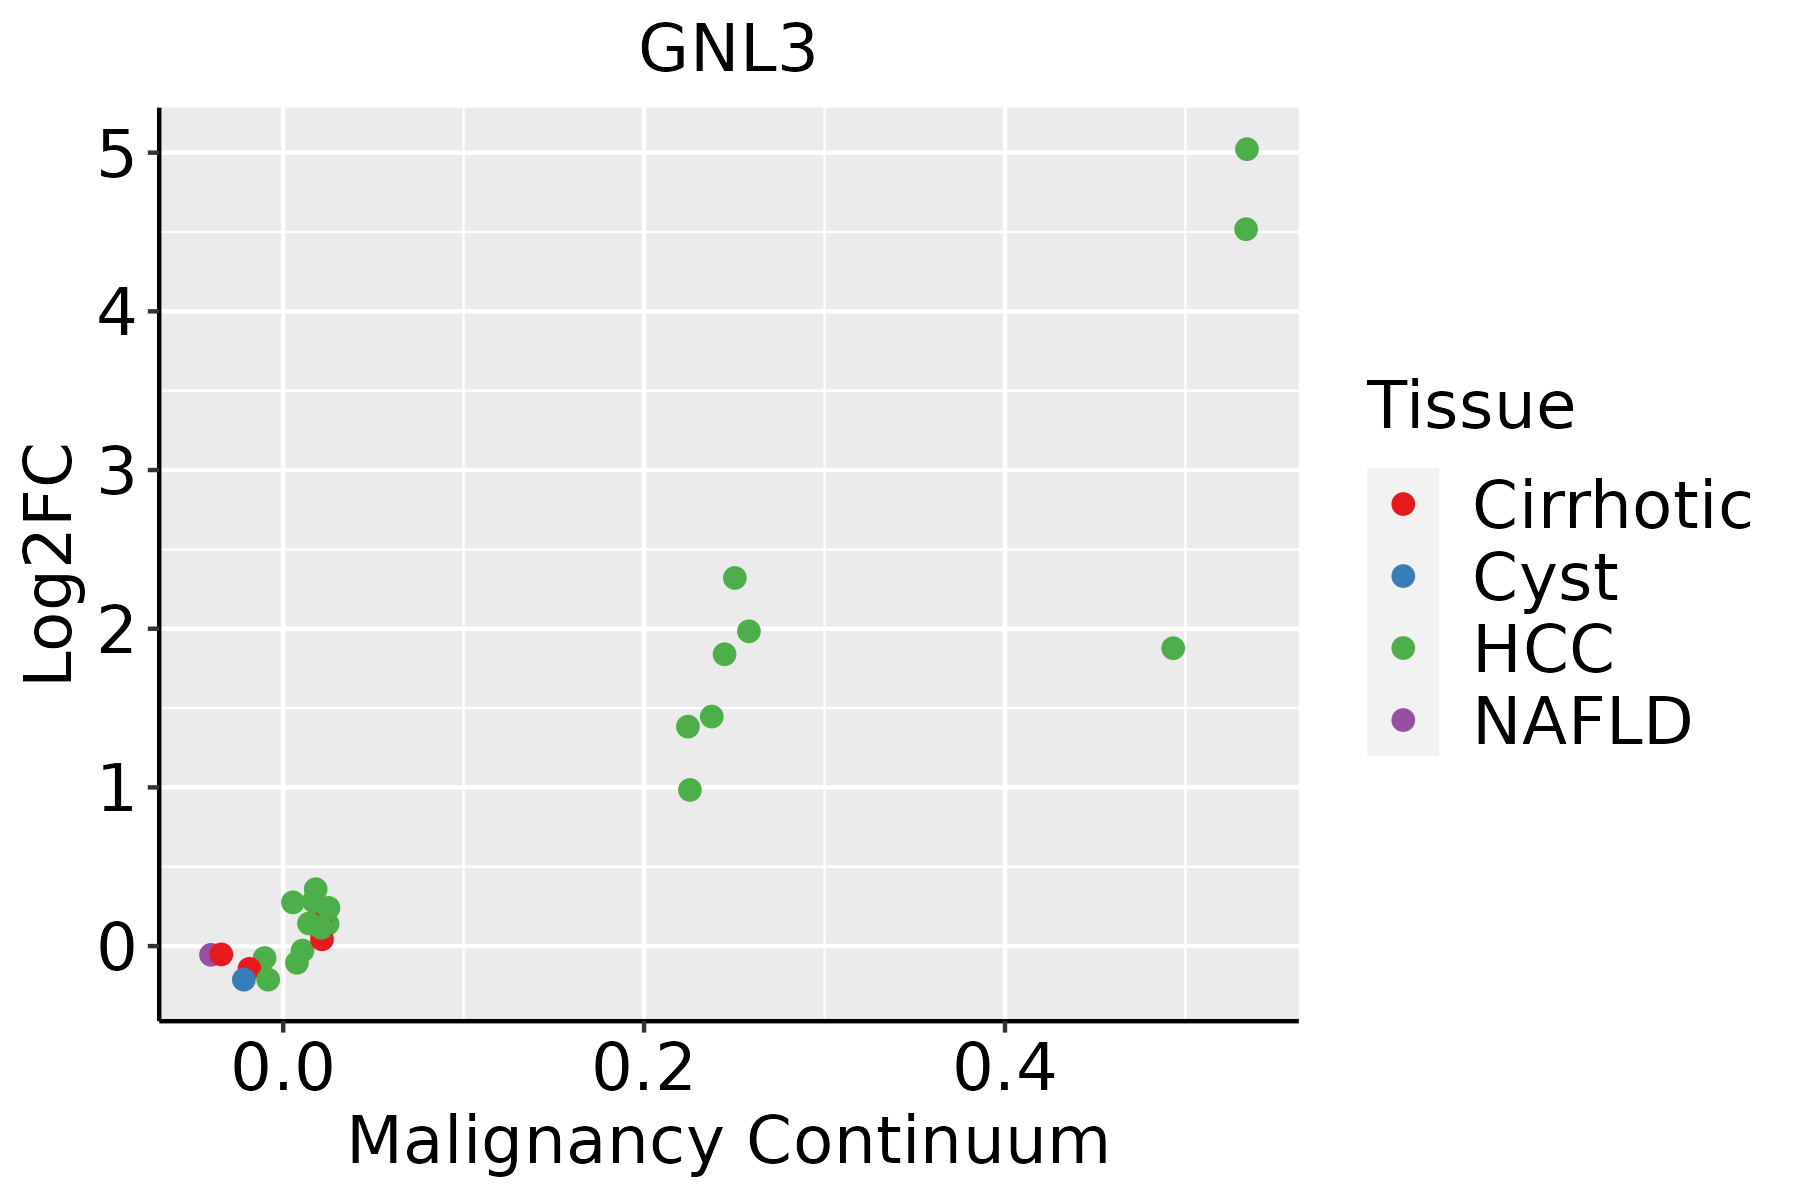 | HCC: Hepatocellular carcinoma |
| NAFLD: Non-alcoholic fatty liver disease | ||
| Oral Cavity | 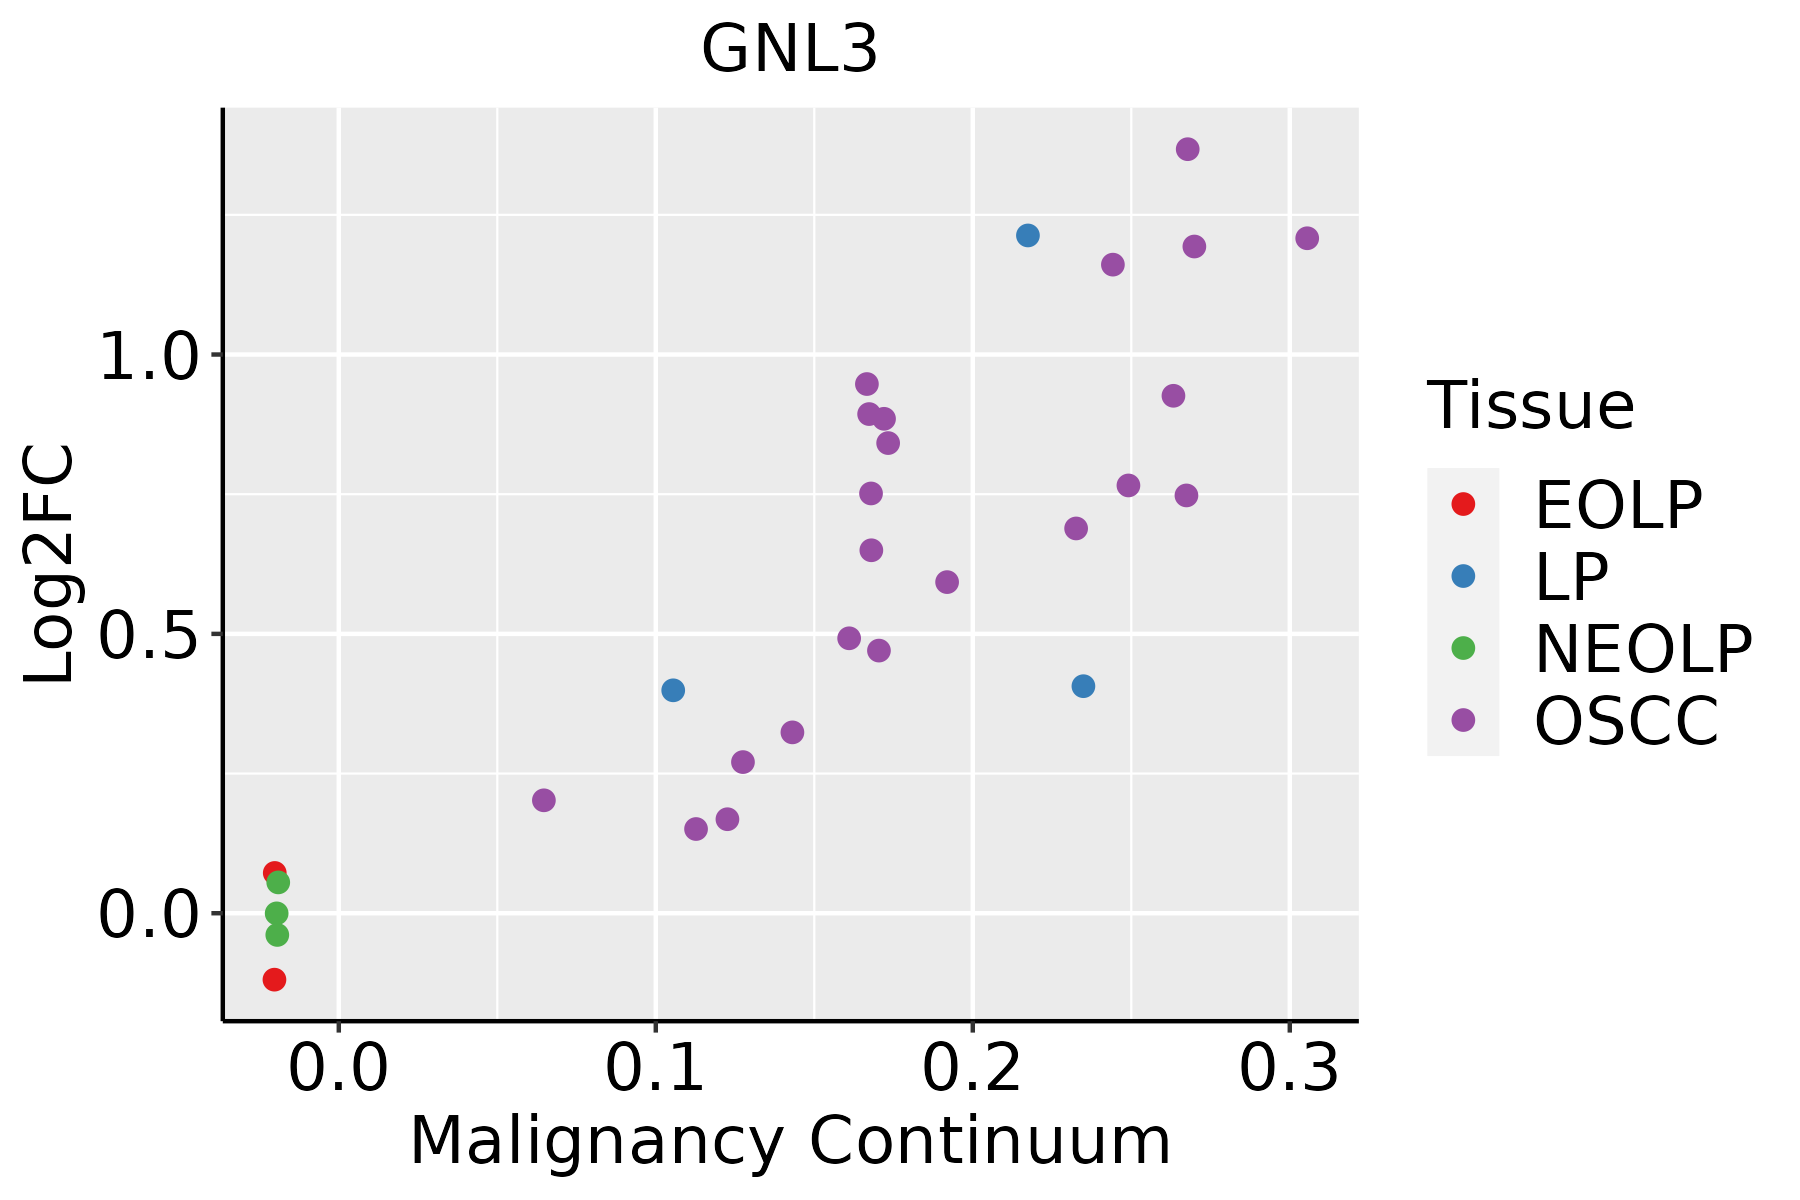 | EOLP: Erosive Oral lichen planus |
| LP: leukoplakia | ||
| NEOLP: Non-erosive oral lichen planus | ||
| OSCC: Oral squamous cell carcinoma | ||
| Prostate | 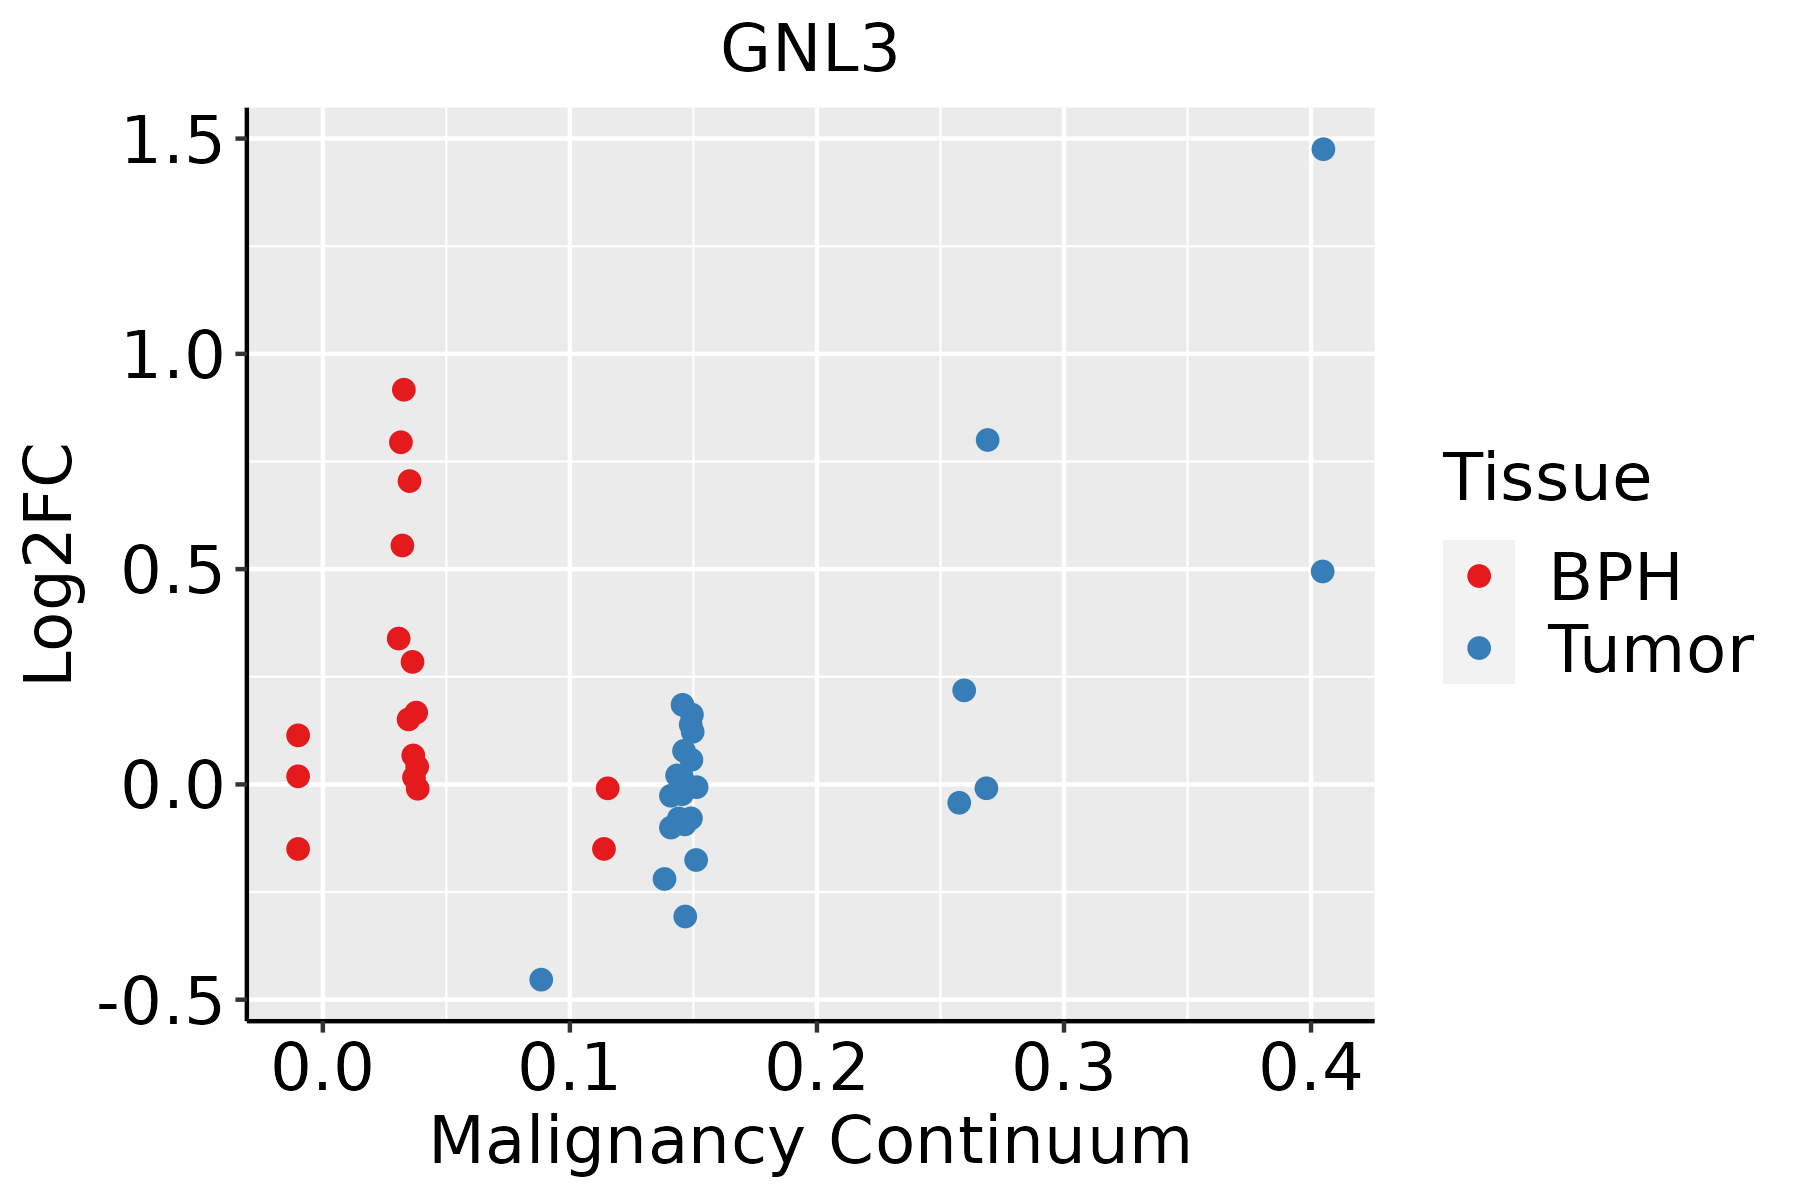 | BPH: Benign Prostatic Hyperplasia |
| Skin | 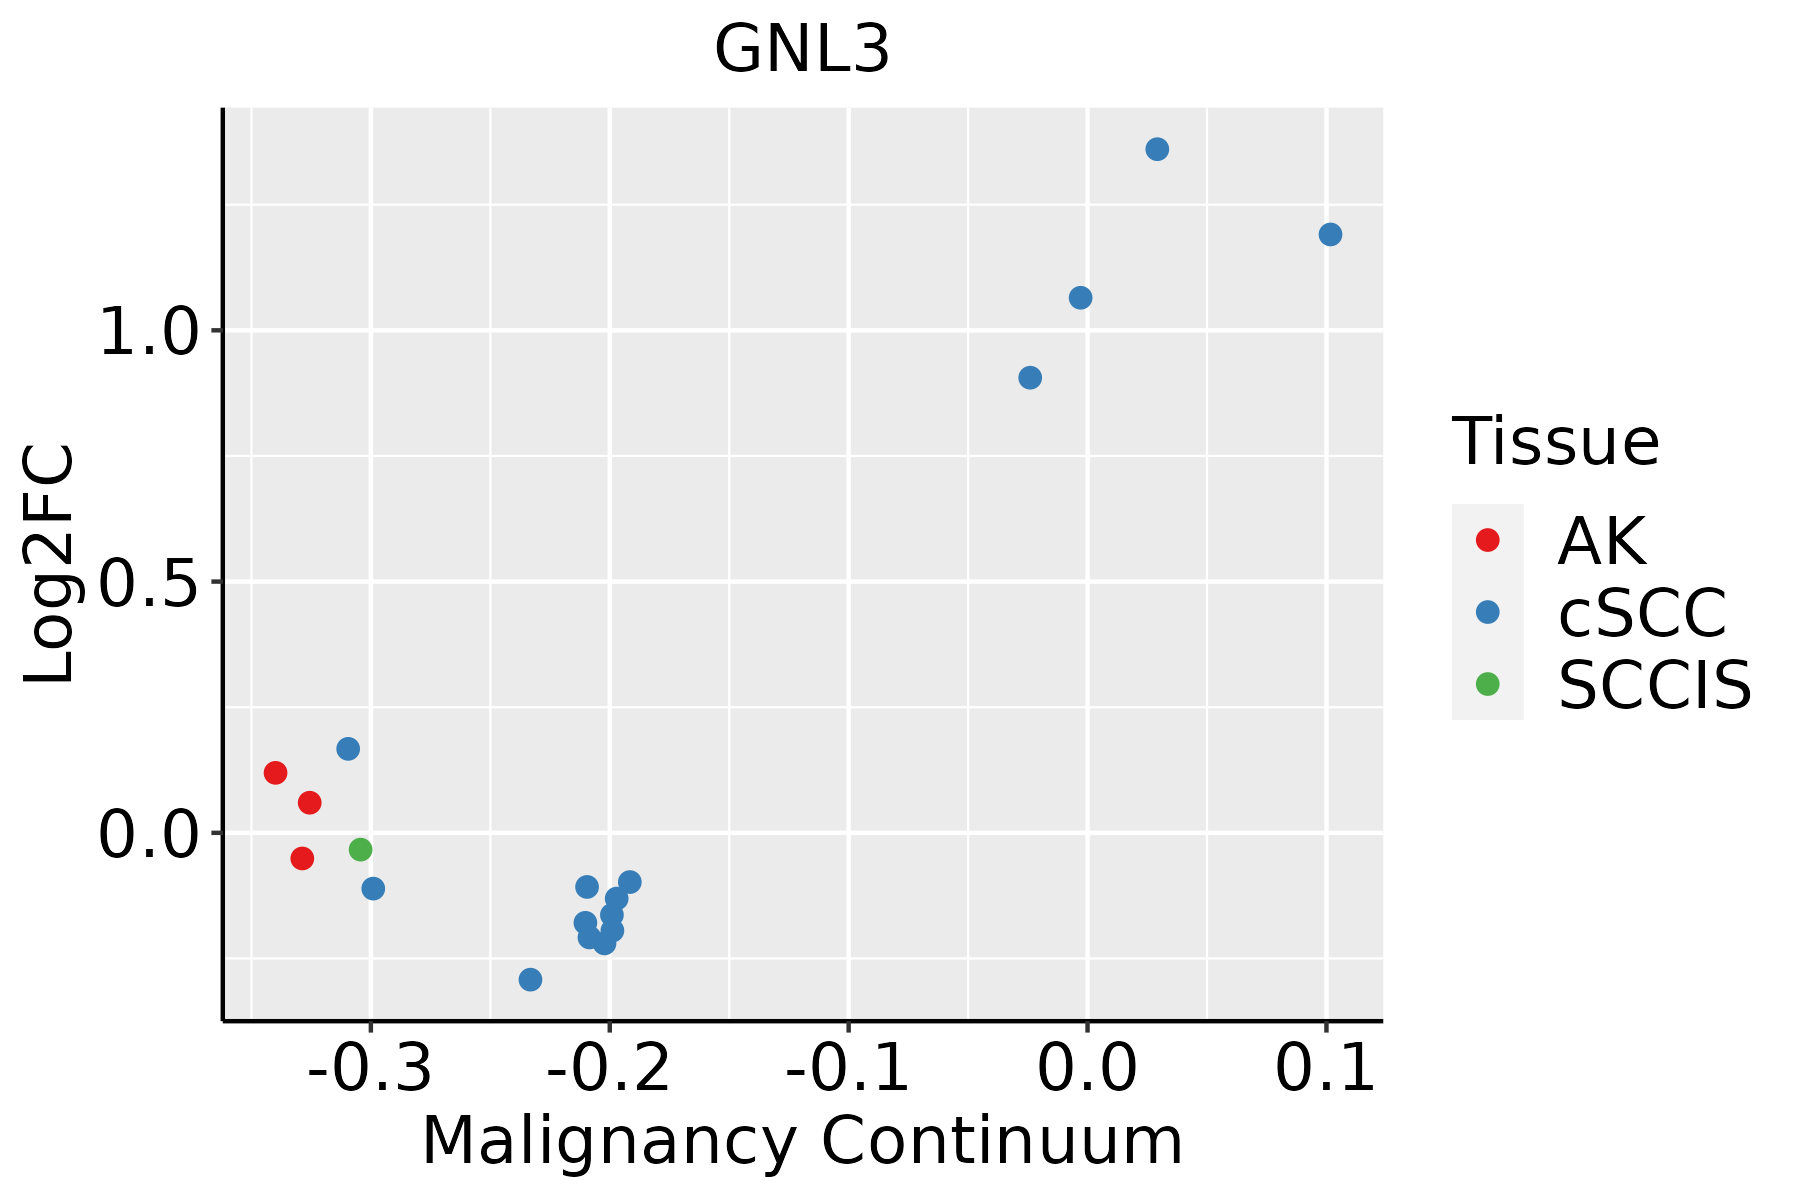 | AK: Actinic keratosis |
| cSCC: Cutaneous squamous cell carcinoma | ||
| SCCIS:squamous cell carcinoma in situ | ||
| Thyroid | 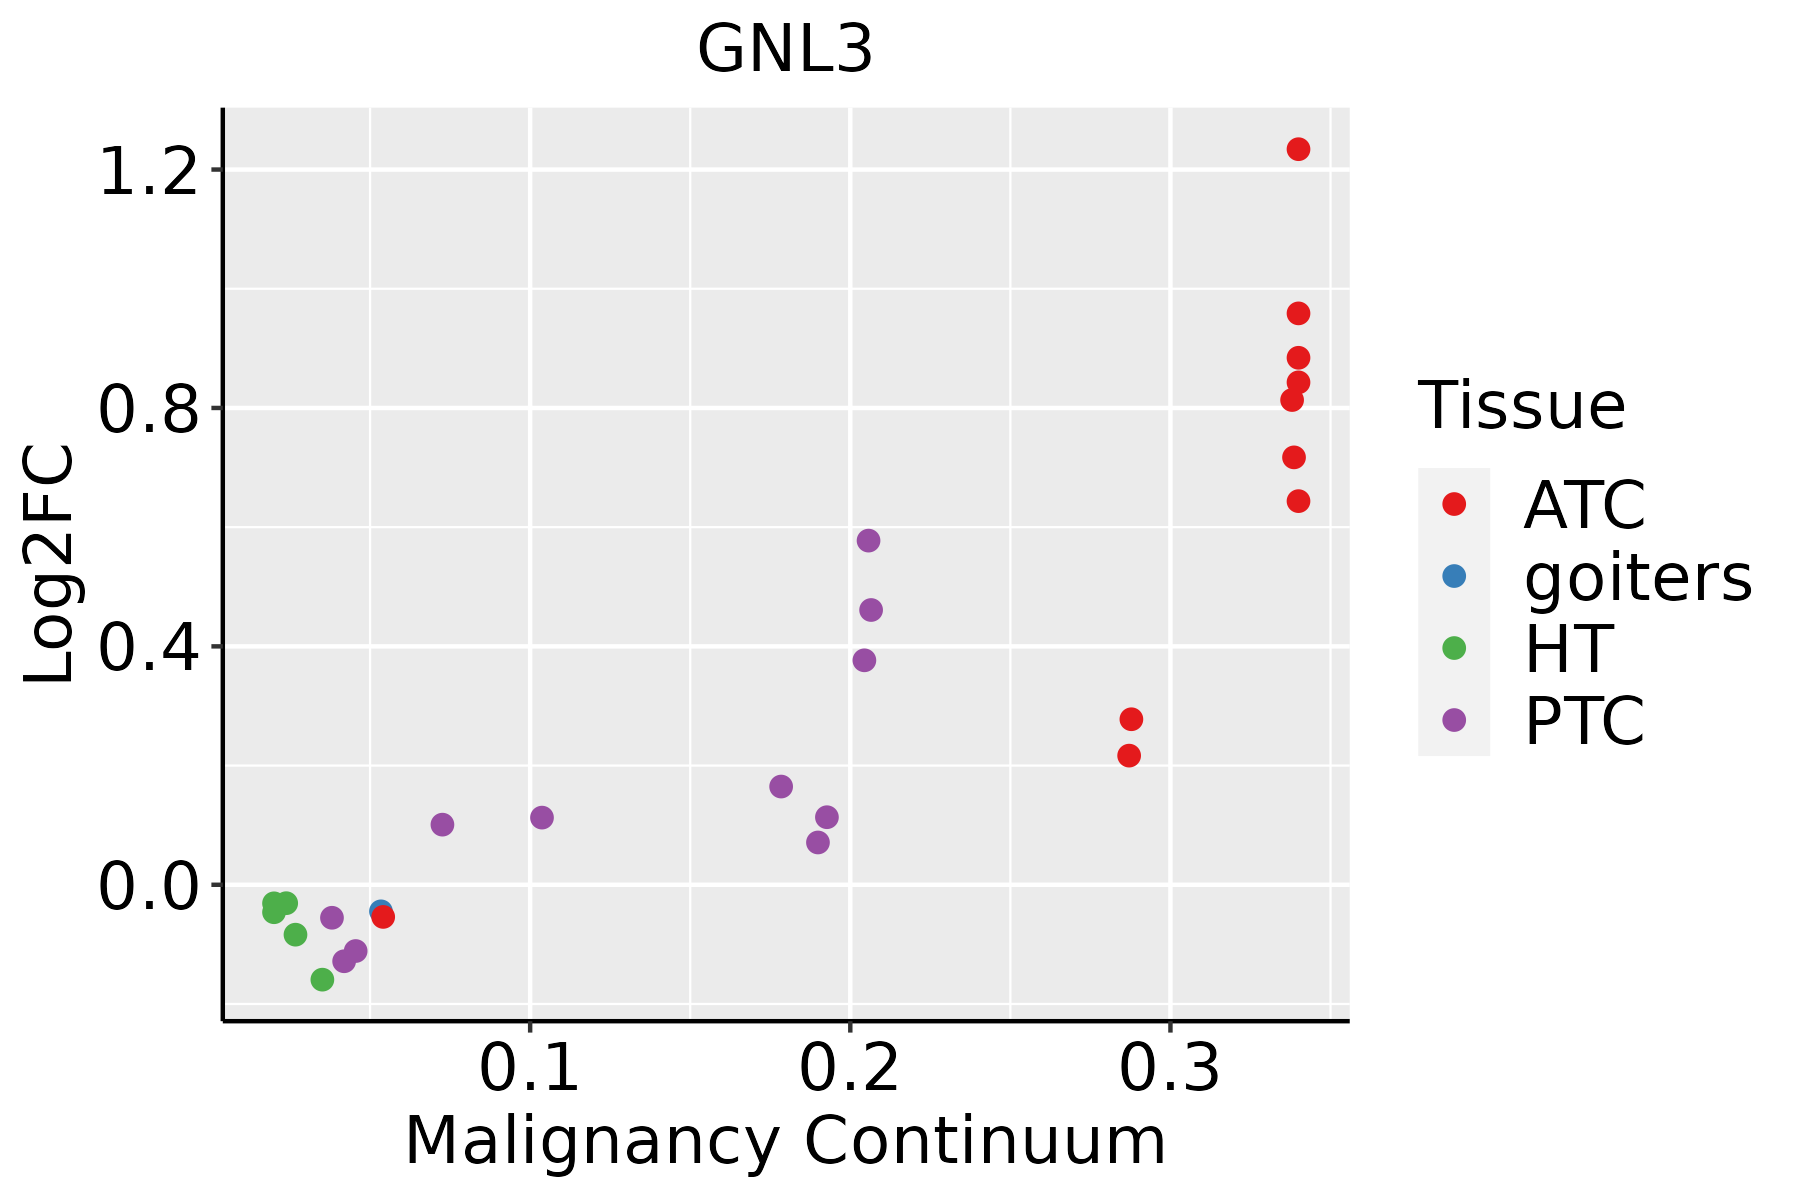 | ATC: Anaplastic thyroid cancer |
| HT: Hashimoto's thyroiditis | ||
| PTC: Papillary thyroid cancer |
| ∗log2FC in expression of this searched gene in stem-like cells from each diseased tissue sample relative to stem-like cells in normal samples in each tissue plotted against the malignancy continuum. Samples are colored based on if they are from different disease stage. |
Top |
Malignant transformation related pathway analysis |
| Find out the enriched GO biological processes and KEGG pathways involved in transition from healthy to precancer to cancer |
| Tissue | Disease Stage | Enriched GO biological Processes |
| Colorectum | AD |  |
| Colorectum | SER |  |
| Colorectum | MSS |  |
| Colorectum | MSI-H |  |
| Colorectum | FAP |  |
| ∗Top 15 enriched GO BP terms are showed in the bar plot of each disease state in each tissue. Each row represents a significant GO biological process which is colored according to the -log10(p.adjust). |
| Page: 1 2 3 4 5 6 7 8 9 |
| GO ID | Tissue | Disease Stage | Description | Gene Ratio | Bg Ratio | pvalue | p.adjust | Count |
| GO:002261327 | Esophagus | HGIN | ribonucleoprotein complex biogenesis | 158/2587 | 463/18723 | 2.61e-29 | 5.23e-26 | 158 |
| GO:004225426 | Esophagus | HGIN | ribosome biogenesis | 101/2587 | 299/18723 | 8.74e-19 | 4.03e-16 | 101 |
| GO:003164727 | Esophagus | HGIN | regulation of protein stability | 96/2587 | 298/18723 | 2.21e-16 | 5.76e-14 | 96 |
| GO:190332027 | Esophagus | HGIN | regulation of protein modification by small protein conjugation or removal | 78/2587 | 242/18723 | 1.40e-13 | 2.26e-11 | 78 |
| GO:003139627 | Esophagus | HGIN | regulation of protein ubiquitination | 64/2587 | 210/18723 | 3.02e-10 | 2.71e-08 | 64 |
| GO:190382926 | Esophagus | HGIN | positive regulation of cellular protein localization | 75/2587 | 276/18723 | 3.19e-09 | 2.30e-07 | 75 |
| GO:200125218 | Esophagus | HGIN | positive regulation of chromosome organization | 30/2587 | 82/18723 | 2.00e-07 | 9.68e-06 | 30 |
| GO:190332127 | Esophagus | HGIN | negative regulation of protein modification by small protein conjugation or removal | 33/2587 | 95/18723 | 2.07e-07 | 9.95e-06 | 33 |
| GO:003139727 | Esophagus | HGIN | negative regulation of protein ubiquitination | 30/2587 | 83/18723 | 2.72e-07 | 1.28e-05 | 30 |
| GO:00182057 | Esophagus | HGIN | peptidyl-lysine modification | 88/2587 | 376/18723 | 2.99e-07 | 1.39e-05 | 88 |
| GO:003133425 | Esophagus | HGIN | positive regulation of protein-containing complex assembly | 61/2587 | 237/18723 | 7.10e-07 | 3.00e-05 | 61 |
| GO:00330449 | Esophagus | HGIN | regulation of chromosome organization | 51/2587 | 187/18723 | 8.91e-07 | 3.61e-05 | 51 |
| GO:00198277 | Esophagus | HGIN | stem cell population maintenance | 39/2587 | 131/18723 | 1.63e-06 | 6.14e-05 | 39 |
| GO:004325427 | Esophagus | HGIN | regulation of protein-containing complex assembly | 94/2587 | 428/18723 | 2.39e-06 | 8.55e-05 | 94 |
| GO:00987278 | Esophagus | HGIN | maintenance of cell number | 39/2587 | 134/18723 | 3.02e-06 | 1.03e-04 | 39 |
| GO:001063920 | Esophagus | HGIN | negative regulation of organelle organization | 79/2587 | 348/18723 | 4.12e-06 | 1.37e-04 | 79 |
| GO:000072318 | Esophagus | HGIN | telomere maintenance | 38/2587 | 131/18723 | 4.38e-06 | 1.42e-04 | 38 |
| GO:003220416 | Esophagus | HGIN | regulation of telomere maintenance | 27/2587 | 80/18723 | 4.83e-06 | 1.56e-04 | 27 |
| GO:003220617 | Esophagus | HGIN | positive regulation of telomere maintenance | 20/2587 | 52/18723 | 8.82e-06 | 2.64e-04 | 20 |
| GO:005105214 | Esophagus | HGIN | regulation of DNA metabolic process | 79/2587 | 359/18723 | 1.38e-05 | 3.85e-04 | 79 |
| Page: 1 2 3 4 5 6 7 8 9 10 11 12 13 14 15 16 17 |
| Pathway ID | Tissue | Disease Stage | Description | Gene Ratio | Bg Ratio | pvalue | p.adjust | qvalue | Count |
| Page: 1 |
Top |
Cell-cell communication analysis |
| Identification of potential cell-cell interactions between two cell types and their ligand-receptor pairs for different disease states |
| Ligand | Receptor | LRpair | Pathway | Tissue | Disease Stage |
| Page: 1 |
Top |
Single-cell gene regulatory network inference analysis |
| Find out the significant the regulons (TFs) and the target genes of each regulon across cell types for different disease states |
| TF | Cell Type | Tissue | Disease Stage | Target Gene | RSS | Regulon Activity |
| ∗The dot plots of a searched regulon are shown for all cell subpopulations in each disease state of each tissue based on the regulon specific score inferred using pySCENIC and by calculating the average expression. |
| Page: 1 |
Top |
Somatic mutation of malignant transformation related genes |
| Annotation of somatic variants for genes involved in malignant transformation |
| Hugo Symbol | Variant Class | Variant Classification | dbSNP RS | HGVSc | HGVSp | HGVSp Short | SWISSPROT | BIOTYPE | SIFT | PolyPhen | Tumor Sample Barcode | Tissue | Histology | Sex | Age | Stage | Therapy Types | Drugs | Outcome |
| GNL3 | SNV | Missense_Mutation | rs555603488 | c.1040G>A | p.Arg347Gln | p.R347Q | Q9BVP2 | protein_coding | tolerated(1) | benign(0.003) | TCGA-A2-A0D2-01 | Breast | breast invasive carcinoma | Female | <65 | I/II | Chemotherapy | adriamycin | SD |
| GNL3 | SNV | Missense_Mutation | c.920C>T | p.Pro307Leu | p.P307L | Q9BVP2 | protein_coding | deleterious(0) | probably_damaging(1) | TCGA-A2-A0YM-01 | Breast | breast invasive carcinoma | Female | >=65 | I/II | Unknown | Unknown | SD | |
| GNL3 | SNV | Missense_Mutation | c.1609N>A | p.Glu537Lys | p.E537K | Q9BVP2 | protein_coding | tolerated(0.31) | benign(0.005) | TCGA-AC-A23H-01 | Breast | breast invasive carcinoma | Female | >=65 | I/II | Unknown | Unknown | PD | |
| GNL3 | SNV | Missense_Mutation | novel | c.338N>C | p.Cys113Ser | p.C113S | Q9BVP2 | protein_coding | tolerated(0.86) | benign(0) | TCGA-PL-A8LV-01 | Breast | breast invasive carcinoma | Female | <65 | III/IV | Unknown | Unknown | SD |
| GNL3 | insertion | Frame_Shift_Ins | novel | c.486_487insCCCTCACCTCCCTTACCCCTCCC | p.Glu163ProfsTer23 | p.E163Pfs*23 | Q9BVP2 | protein_coding | TCGA-A8-A095-01 | Breast | breast invasive carcinoma | Female | <65 | I/II | Chemotherapy | 5-fluorouracil | CR | ||
| GNL3 | SNV | Missense_Mutation | novel | c.415N>A | p.Glu139Lys | p.E139K | Q9BVP2 | protein_coding | tolerated(0.08) | benign(0.103) | TCGA-EA-A3HU-01 | Cervix | cervical & endocervical cancer | Female | <65 | I/II | Unknown | Unknown | SD |
| GNL3 | SNV | Missense_Mutation | novel | c.596N>G | p.Leu199Trp | p.L199W | Q9BVP2 | protein_coding | deleterious(0.02) | possibly_damaging(0.536) | TCGA-EA-A410-01 | Cervix | cervical & endocervical cancer | Female | <65 | I/II | Unknown | Unknown | SD |
| GNL3 | SNV | Missense_Mutation | c.536N>C | p.Lys179Thr | p.K179T | Q9BVP2 | protein_coding | deleterious(0) | probably_damaging(0.999) | TCGA-AA-3510-01 | Colorectum | colon adenocarcinoma | Male | >=65 | I/II | Unknown | Unknown | SD | |
| GNL3 | SNV | Missense_Mutation | c.663N>T | p.Lys221Asn | p.K221N | Q9BVP2 | protein_coding | tolerated(0.18) | possibly_damaging(0.796) | TCGA-AA-3663-01 | Colorectum | colon adenocarcinoma | Male | <65 | I/II | Unknown | Unknown | SD | |
| GNL3 | SNV | Missense_Mutation | novel | c.58N>C | p.Lys20Gln | p.K20Q | Q9BVP2 | protein_coding | deleterious(0) | probably_damaging(1) | TCGA-AA-3984-01 | Colorectum | colon adenocarcinoma | Female | <65 | I/II | Unknown | Unknown | SD |
| Page: 1 2 3 4 |
Top |
Related drugs of malignant transformation related genes |
| Identification of chemicals and drugs interact with genes involved in malignant transfromation |
| (DGIdb 4.0) |
| Entrez ID | Symbol | Category | Interaction Types | Drug Claim Name | Drug Name | PMIDs |
| 26354 | GNL3 | NA | cyclophosphamide | CYCLOPHOSPHAMIDE | ||
| 26354 | GNL3 | NA | epirubicin | EPIRUBICIN | ||
| 26354 | GNL3 | NA | fluorouracil | FLUOROURACIL |
| Page: 1 |

Copyright 2023-Present -The University of Texas Health Science Center at Houston |