
|
|||||
|
 | |
| |
| |
| |
| |
| |
|
Gene: GNGT1 |
Gene summary for GNGT1 |
| Gene information | Species | Human | Gene symbol | GNGT1 | Gene ID | 2792 |
| Gene name | G protein subunit gamma transducin 1 | |
| Gene Alias | GNG1 | |
| Cytomap | 7q21.3 | |
| Gene Type | protein-coding | GO ID | GO:0001654 | UniProtAcc | P63211 |
Top |
Malignant transformation analysis |
| Identification of the aberrant gene expression in precancerous and cancerous lesions by comparing the gene expression of stem-like cells in diseased tissues with normal stem cells |
| Entrez ID | Symbol | Replicates | Species | Organ | Tissue | Adj P-value | Log2FC | Malignancy |
| 2792 | GNGT1 | CCI_3 | Human | Cervix | CC | 2.21e-45 | 1.87e+00 | 0.516 |
| 2792 | GNGT1 | CCII_1 | Human | Cervix | CC | 1.71e-05 | 1.93e-01 | 0.3249 |
| 2792 | GNGT1 | AEH-subject1 | Human | Endometrium | AEH | 9.30e-53 | 8.71e-01 | -0.3059 |
| 2792 | GNGT1 | AEH-subject2 | Human | Endometrium | AEH | 8.72e-29 | 6.30e-01 | -0.2525 |
| 2792 | GNGT1 | AEH-subject3 | Human | Endometrium | AEH | 1.05e-20 | 5.05e-01 | -0.2576 |
| 2792 | GNGT1 | AEH-subject4 | Human | Endometrium | AEH | 1.55e-42 | 8.94e-01 | -0.2657 |
| 2792 | GNGT1 | AEH-subject5 | Human | Endometrium | AEH | 3.30e-63 | 1.00e+00 | -0.2953 |
| 2792 | GNGT1 | EEC-subject1 | Human | Endometrium | EEC | 4.20e-27 | 5.54e-01 | -0.2682 |
| 2792 | GNGT1 | EEC-subject2 | Human | Endometrium | EEC | 5.24e-49 | 8.09e-01 | -0.2607 |
| 2792 | GNGT1 | EEC-subject3 | Human | Endometrium | EEC | 9.89e-17 | 4.50e-01 | -0.2525 |
| 2792 | GNGT1 | EEC-subject4 | Human | Endometrium | EEC | 7.64e-34 | 6.32e-01 | -0.2571 |
| 2792 | GNGT1 | EEC-subject5 | Human | Endometrium | EEC | 2.98e-34 | 6.41e-01 | -0.249 |
| 2792 | GNGT1 | GSM5276935 | Human | Endometrium | EEC | 1.75e-04 | 9.74e-02 | -0.123 |
| 2792 | GNGT1 | LZE4T | Human | Esophagus | ESCC | 9.66e-09 | 2.69e-01 | 0.0811 |
| 2792 | GNGT1 | LZE7T | Human | Esophagus | ESCC | 5.23e-19 | 7.10e-01 | 0.0667 |
| 2792 | GNGT1 | LZE8T | Human | Esophagus | ESCC | 7.50e-09 | 3.25e-01 | 0.067 |
| 2792 | GNGT1 | LZE20T | Human | Esophagus | ESCC | 1.20e-05 | 2.28e-01 | 0.0662 |
| 2792 | GNGT1 | LZE22D1 | Human | Esophagus | HGIN | 3.26e-02 | 1.42e-01 | 0.0595 |
| 2792 | GNGT1 | LZE22T | Human | Esophagus | ESCC | 3.15e-15 | 6.72e-01 | 0.068 |
| 2792 | GNGT1 | LZE24T | Human | Esophagus | ESCC | 5.74e-23 | 5.21e-01 | 0.0596 |
| Page: 1 2 3 4 5 |
| Tissue | Expression Dynamics | Abbreviation |
| Cervix |  | CC: Cervix cancer |
| HSIL_HPV: HPV-infected high-grade squamous intraepithelial lesions | ||
| N_HPV: HPV-infected normal cervix | ||
| Endometrium |  | AEH: Atypical endometrial hyperplasia |
| EEC: Endometrioid Cancer | ||
| Esophagus | 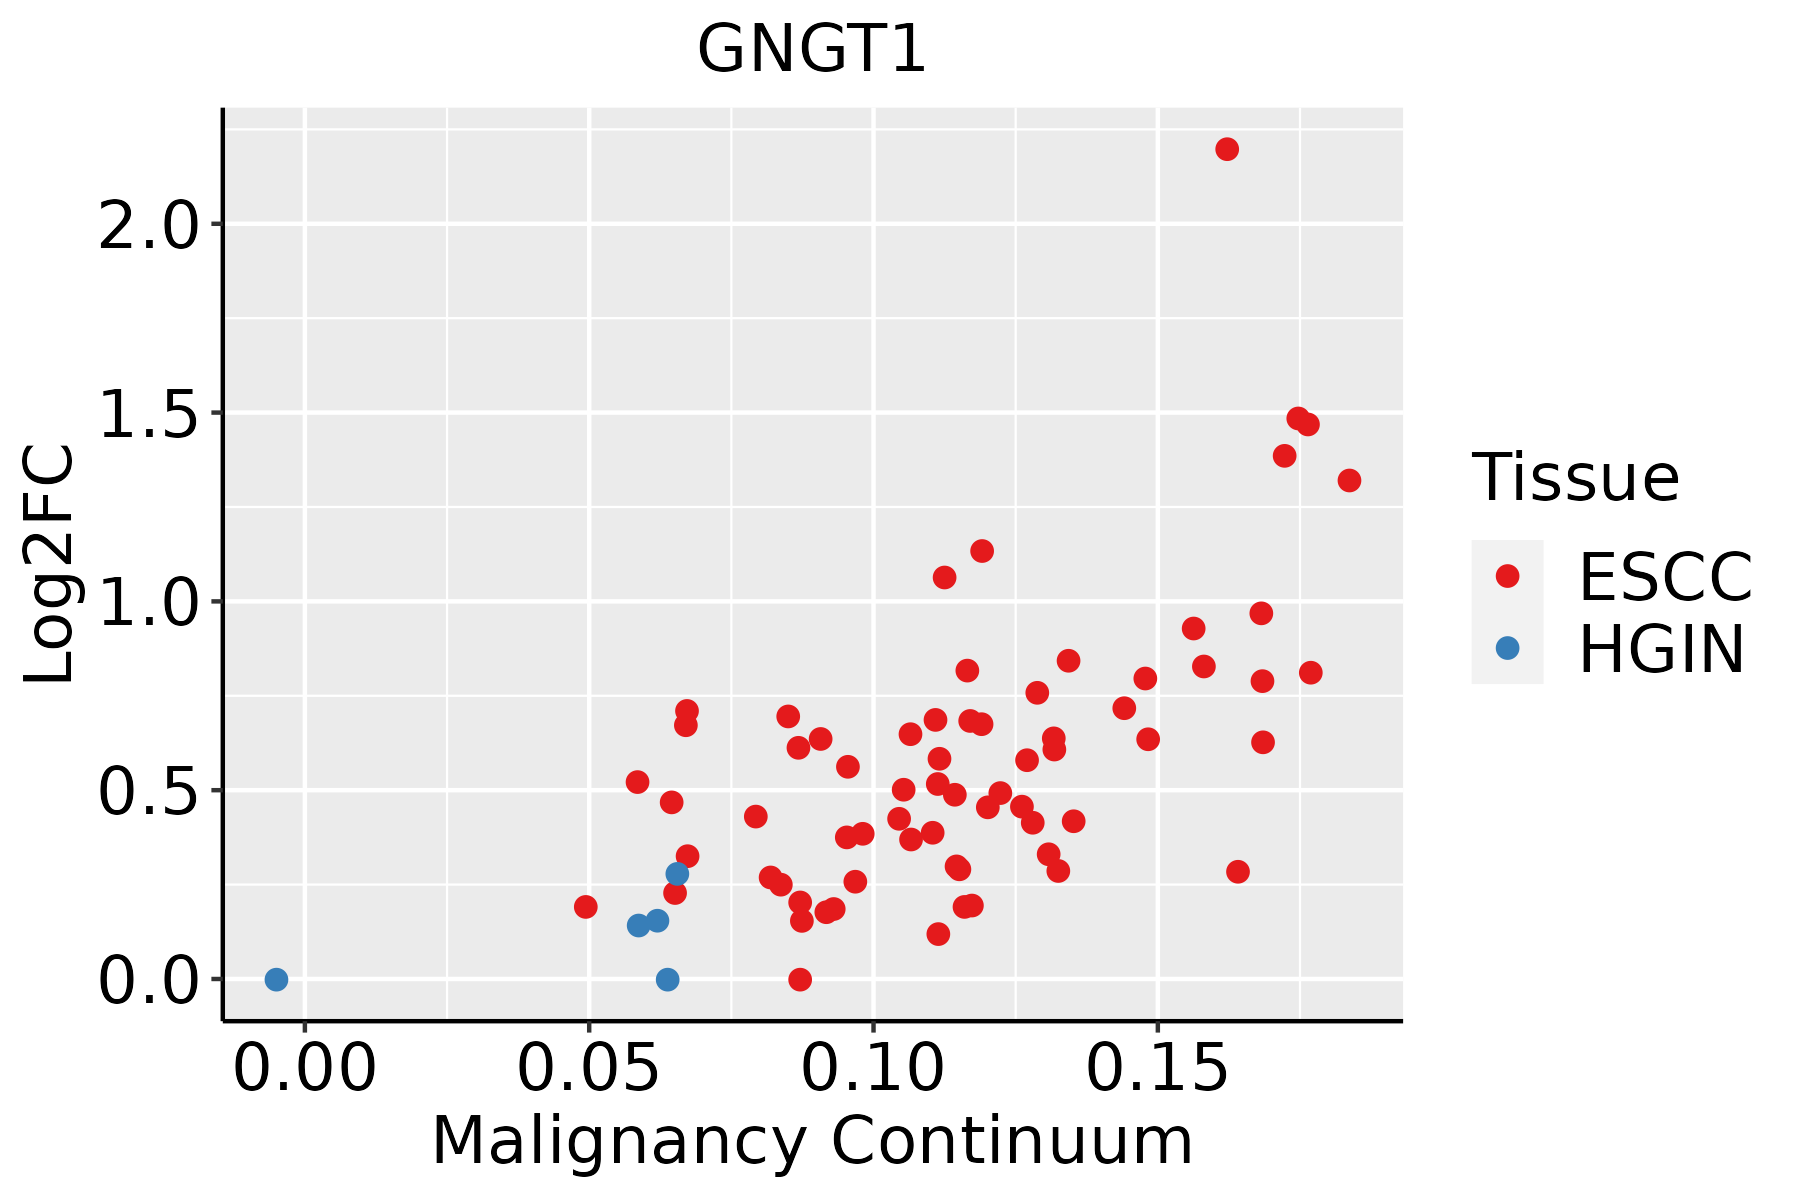 | ESCC: Esophageal squamous cell carcinoma |
| HGIN: High-grade intraepithelial neoplasias | ||
| LGIN: Low-grade intraepithelial neoplasias | ||
| Lung | 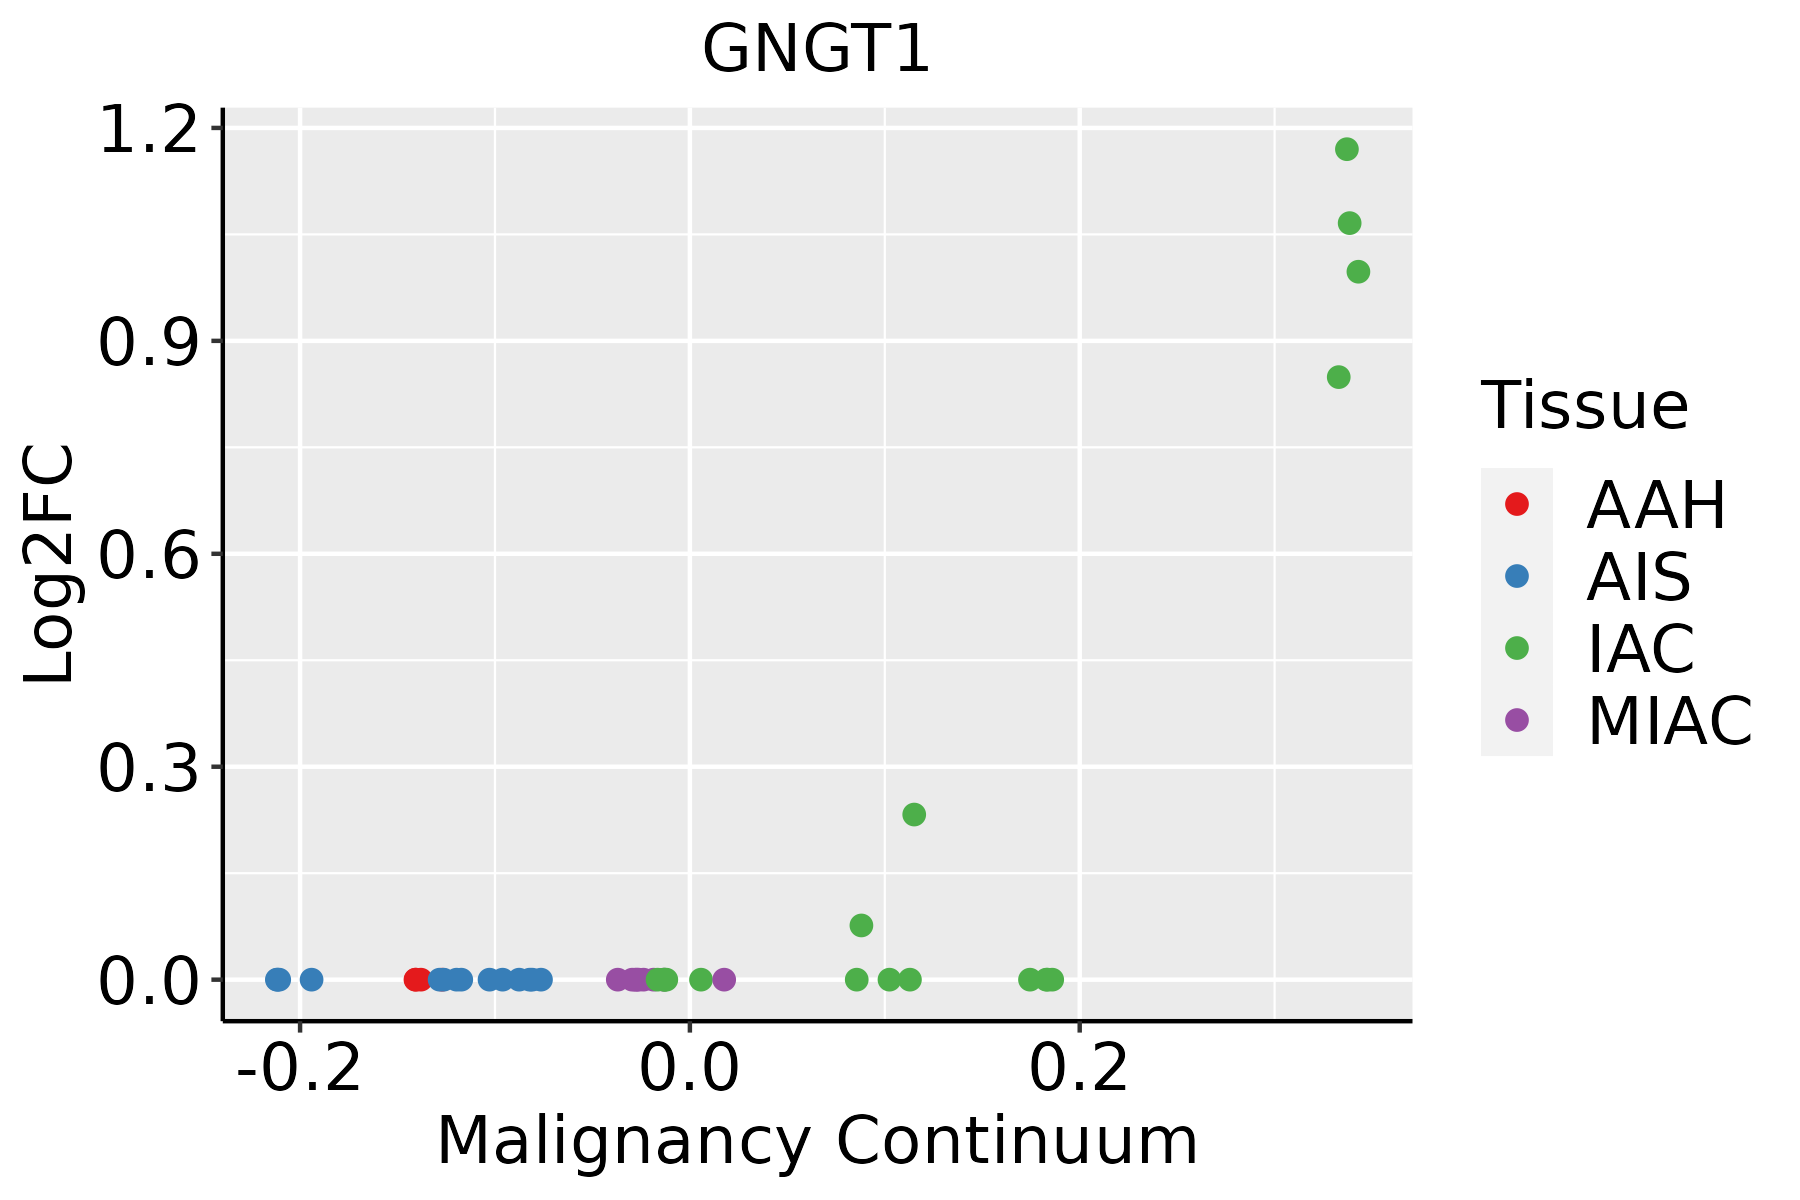 | AAH: Atypical adenomatous hyperplasia |
| AIS: Adenocarcinoma in situ | ||
| IAC: Invasive lung adenocarcinoma | ||
| MIA: Minimally invasive adenocarcinoma | ||
| Thyroid | 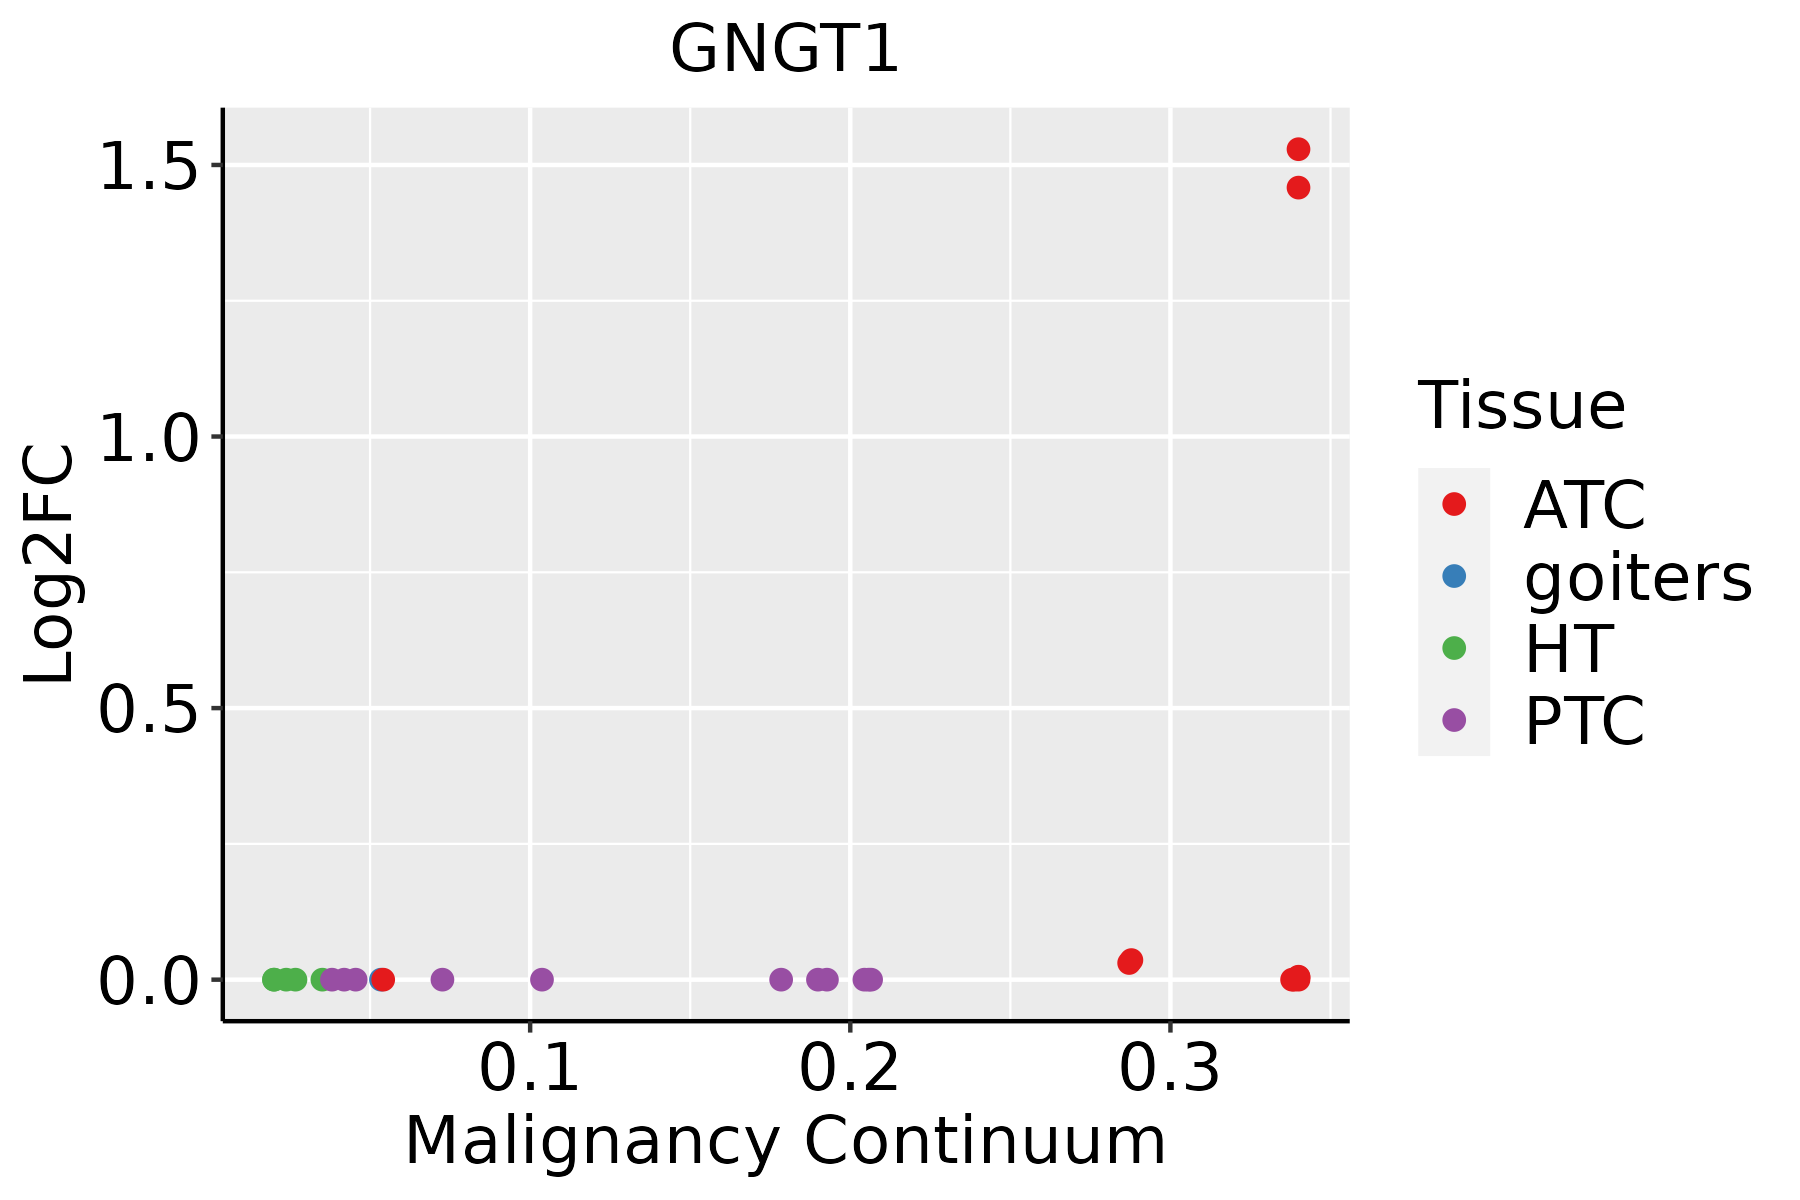 | ATC: Anaplastic thyroid cancer |
| HT: Hashimoto's thyroiditis | ||
| PTC: Papillary thyroid cancer |
| ∗log2FC in expression of this searched gene in stem-like cells from each diseased tissue sample relative to stem-like cells in normal samples in each tissue plotted against the malignancy continuum. Samples are colored based on if they are from different disease stage. |
Top |
Malignant transformation related pathway analysis |
| Find out the enriched GO biological processes and KEGG pathways involved in transition from healthy to precancer to cancer |
| Tissue | Disease Stage | Enriched GO biological Processes |
| Colorectum | AD |  |
| Colorectum | SER |  |
| Colorectum | MSS |  |
| Colorectum | MSI-H |  |
| Colorectum | FAP |  |
| ∗Top 15 enriched GO BP terms are showed in the bar plot of each disease state in each tissue. Each row represents a significant GO biological process which is colored according to the -log10(p.adjust). |
| Page: 1 2 3 4 5 6 7 8 9 |
| GO ID | Tissue | Disease Stage | Description | Gene Ratio | Bg Ratio | pvalue | p.adjust | Count |
| GO:00093149 | Cervix | CC | response to radiation | 86/2311 | 456/18723 | 3.50e-05 | 5.63e-04 | 86 |
| GO:000166610 | Cervix | CC | response to hypoxia | 61/2311 | 307/18723 | 1.04e-04 | 1.34e-03 | 61 |
| GO:007048210 | Cervix | CC | response to oxygen levels | 67/2311 | 347/18723 | 1.21e-04 | 1.51e-03 | 67 |
| GO:003629310 | Cervix | CC | response to decreased oxygen levels | 62/2311 | 322/18723 | 2.29e-04 | 2.57e-03 | 62 |
| GO:00714539 | Cervix | CC | cellular response to oxygen levels | 38/2311 | 177/18723 | 4.23e-04 | 4.27e-03 | 38 |
| GO:00362949 | Cervix | CC | cellular response to decreased oxygen levels | 35/2311 | 161/18723 | 5.49e-04 | 5.29e-03 | 35 |
| GO:00714566 | Cervix | CC | cellular response to hypoxia | 33/2311 | 151/18723 | 7.06e-04 | 6.41e-03 | 33 |
| GO:0150063 | Cervix | CC | visual system development | 63/2311 | 375/18723 | 6.58e-03 | 3.65e-02 | 63 |
| GO:0001654 | Cervix | CC | eye development | 62/2311 | 371/18723 | 7.83e-03 | 4.13e-02 | 62 |
| GO:0048880 | Cervix | CC | sensory system development | 63/2311 | 381/18723 | 9.29e-03 | 4.66e-02 | 63 |
| GO:00094163 | Cervix | CC | response to light stimulus | 54/2311 | 320/18723 | 1.03e-02 | 4.97e-02 | 54 |
| GO:007048215 | Endometrium | AEH | response to oxygen levels | 64/2100 | 347/18723 | 4.11e-05 | 6.99e-04 | 64 |
| GO:003629315 | Endometrium | AEH | response to decreased oxygen levels | 58/2100 | 322/18723 | 1.78e-04 | 2.30e-03 | 58 |
| GO:000166615 | Endometrium | AEH | response to hypoxia | 55/2100 | 307/18723 | 2.98e-04 | 3.38e-03 | 55 |
| GO:007145310 | Endometrium | AEH | cellular response to oxygen levels | 33/2100 | 177/18723 | 2.30e-03 | 1.74e-02 | 33 |
| GO:000931410 | Endometrium | AEH | response to radiation | 70/2100 | 456/18723 | 3.99e-03 | 2.68e-02 | 70 |
| GO:003629410 | Endometrium | AEH | cellular response to decreased oxygen levels | 29/2100 | 161/18723 | 6.73e-03 | 3.94e-02 | 29 |
| GO:007048216 | Endometrium | EEC | response to oxygen levels | 65/2168 | 347/18723 | 5.81e-05 | 9.03e-04 | 65 |
| GO:003629316 | Endometrium | EEC | response to decreased oxygen levels | 59/2168 | 322/18723 | 2.30e-04 | 2.73e-03 | 59 |
| GO:000166616 | Endometrium | EEC | response to hypoxia | 56/2168 | 307/18723 | 3.68e-04 | 3.96e-03 | 56 |
| Page: 1 2 3 |
| Pathway ID | Tissue | Disease Stage | Description | Gene Ratio | Bg Ratio | pvalue | p.adjust | qvalue | Count |
| hsa0516720 | Cervix | CC | Kaposi sarcoma-associated herpesvirus infection | 60/1267 | 194/8465 | 9.74e-09 | 1.58e-07 | 9.33e-08 | 60 |
| hsa0516318 | Cervix | CC | Human cytomegalovirus infection | 65/1267 | 225/8465 | 4.59e-08 | 6.47e-07 | 3.83e-07 | 65 |
| hsa0472318 | Cervix | CC | Retrograde endocannabinoid signaling | 42/1267 | 148/8465 | 1.79e-05 | 1.42e-04 | 8.40e-05 | 42 |
| hsa0517016 | Cervix | CC | Human immunodeficiency virus 1 infection | 55/1267 | 212/8465 | 1.80e-05 | 1.42e-04 | 8.40e-05 | 55 |
| hsa040142 | Cervix | CC | Ras signaling pathway | 51/1267 | 236/8465 | 3.55e-03 | 1.34e-02 | 7.91e-03 | 51 |
| hsa04062 | Cervix | CC | Chemokine signaling pathway | 43/1267 | 192/8465 | 3.60e-03 | 1.34e-02 | 7.91e-03 | 43 |
| hsa049265 | Cervix | CC | Relaxin signaling pathway | 30/1267 | 129/8465 | 7.92e-03 | 2.56e-02 | 1.51e-02 | 30 |
| hsa05167110 | Cervix | CC | Kaposi sarcoma-associated herpesvirus infection | 60/1267 | 194/8465 | 9.74e-09 | 1.58e-07 | 9.33e-08 | 60 |
| hsa0516319 | Cervix | CC | Human cytomegalovirus infection | 65/1267 | 225/8465 | 4.59e-08 | 6.47e-07 | 3.83e-07 | 65 |
| hsa0472319 | Cervix | CC | Retrograde endocannabinoid signaling | 42/1267 | 148/8465 | 1.79e-05 | 1.42e-04 | 8.40e-05 | 42 |
| hsa0517017 | Cervix | CC | Human immunodeficiency virus 1 infection | 55/1267 | 212/8465 | 1.80e-05 | 1.42e-04 | 8.40e-05 | 55 |
| hsa0401411 | Cervix | CC | Ras signaling pathway | 51/1267 | 236/8465 | 3.55e-03 | 1.34e-02 | 7.91e-03 | 51 |
| hsa040621 | Cervix | CC | Chemokine signaling pathway | 43/1267 | 192/8465 | 3.60e-03 | 1.34e-02 | 7.91e-03 | 43 |
| hsa0492613 | Cervix | CC | Relaxin signaling pathway | 30/1267 | 129/8465 | 7.92e-03 | 2.56e-02 | 1.51e-02 | 30 |
| hsa0472320 | Endometrium | AEH | Retrograde endocannabinoid signaling | 39/1197 | 148/8465 | 5.89e-05 | 5.80e-04 | 4.24e-04 | 39 |
| hsa0516725 | Endometrium | AEH | Kaposi sarcoma-associated herpesvirus infection | 44/1197 | 194/8465 | 7.97e-04 | 5.28e-03 | 3.87e-03 | 44 |
| hsa0517018 | Endometrium | AEH | Human immunodeficiency virus 1 infection | 43/1197 | 212/8465 | 8.19e-03 | 4.22e-02 | 3.09e-02 | 43 |
| hsa0516320 | Endometrium | AEH | Human cytomegalovirus infection | 45/1197 | 225/8465 | 8.98e-03 | 4.56e-02 | 3.34e-02 | 45 |
| hsa04723110 | Endometrium | AEH | Retrograde endocannabinoid signaling | 39/1197 | 148/8465 | 5.89e-05 | 5.80e-04 | 4.24e-04 | 39 |
| hsa05167111 | Endometrium | AEH | Kaposi sarcoma-associated herpesvirus infection | 44/1197 | 194/8465 | 7.97e-04 | 5.28e-03 | 3.87e-03 | 44 |
| Page: 1 2 3 |
Top |
Cell-cell communication analysis |
| Identification of potential cell-cell interactions between two cell types and their ligand-receptor pairs for different disease states |
| Ligand | Receptor | LRpair | Pathway | Tissue | Disease Stage |
| Page: 1 |
Top |
Single-cell gene regulatory network inference analysis |
| Find out the significant the regulons (TFs) and the target genes of each regulon across cell types for different disease states |
| TF | Cell Type | Tissue | Disease Stage | Target Gene | RSS | Regulon Activity |
| ∗The dot plots of a searched regulon are shown for all cell subpopulations in each disease state of each tissue based on the regulon specific score inferred using pySCENIC and by calculating the average expression. |
| Page: 1 |
Top |
Somatic mutation of malignant transformation related genes |
| Annotation of somatic variants for genes involved in malignant transformation |
| Hugo Symbol | Variant Class | Variant Classification | dbSNP RS | HGVSc | HGVSp | HGVSp Short | SWISSPROT | BIOTYPE | SIFT | PolyPhen | Tumor Sample Barcode | Tissue | Histology | Sex | Age | Stage | Therapy Types | Drugs | Outcome |
| GNGT1 | SNV | Missense_Mutation | c.179A>G | p.Asp60Gly | p.D60G | P63211 | protein_coding | deleterious(0.04) | possibly_damaging(0.554) | TCGA-FU-A3HZ-01 | Cervix | cervical & endocervical cancer | Female | <65 | I/II | Chemotherapy | cisplatin | CR | |
| GNGT1 | SNV | Missense_Mutation | c.208N>T | p.Gly70Cys | p.G70C | P63211 | protein_coding | deleterious(0.01) | probably_damaging(0.963) | TCGA-AZ-4615-01 | Colorectum | colon adenocarcinoma | Male | >=65 | III/IV | Chemotherapy | xeloda | PD | |
| GNGT1 | SNV | Missense_Mutation | c.198N>T | p.Glu66Asp | p.E66D | P63211 | protein_coding | tolerated(0.19) | probably_damaging(0.987) | TCGA-AG-4005-01 | Colorectum | rectum adenocarcinoma | Male | <65 | III/IV | Chemotherapy | folinic | CR | |
| GNGT1 | SNV | Missense_Mutation | c.4N>T | p.Pro2Ser | p.P2S | P63211 | protein_coding | tolerated_low_confidence(0.14) | possibly_damaging(0.617) | TCGA-AX-A1CE-01 | Endometrium | uterine corpus endometrioid carcinoma | Female | <65 | I/II | Unspecific | Paclitaxel | SD | |
| GNGT1 | SNV | Missense_Mutation | novel | c.108N>G | p.Cys36Trp | p.C36W | P63211 | protein_coding | deleterious(0) | possibly_damaging(0.552) | TCGA-EY-A1GI-01 | Endometrium | uterine corpus endometrioid carcinoma | Female | <65 | I/II | Unknown | Unknown | SD |
| GNGT1 | SNV | Missense_Mutation | c.139N>G | p.Arg47Gly | p.R47G | P63211 | protein_coding | tolerated(0.36) | benign(0.001) | TCGA-05-4382-01 | Lung | lung adenocarcinoma | Male | >=65 | I/II | Unknown | Unknown | PD | |
| GNGT1 | SNV | Missense_Mutation | novel | c.24N>G | p.Asp8Glu | p.D8E | P63211 | protein_coding | tolerated(0.31) | benign(0.013) | TCGA-50-6590-01 | Lung | lung adenocarcinoma | Female | >=65 | I/II | Chemotherapy | paclitaxel | CR |
| GNGT1 | SNV | Missense_Mutation | c.7N>T | p.Val3Leu | p.V3L | P63211 | protein_coding | deleterious_low_confidence(0.03) | benign(0.022) | TCGA-75-5126-01 | Lung | lung adenocarcinoma | Female | Unknown | III/IV | Unknown | Unknown | SD | |
| GNGT1 | SNV | Missense_Mutation | c.92N>A | p.Met31Lys | p.M31K | P63211 | protein_coding | tolerated(0.92) | benign(0) | TCGA-78-7220-01 | Lung | lung adenocarcinoma | Female | <65 | III/IV | Unknown | Unknown | PD | |
| GNGT1 | SNV | Missense_Mutation | c.128N>G | p.Tyr43Cys | p.Y43C | P63211 | protein_coding | deleterious(0) | probably_damaging(0.998) | TCGA-78-8655-01 | Lung | lung adenocarcinoma | Female | >=65 | I/II | Unknown | Unknown | SD |
| Page: 1 2 |
Top |
Related drugs of malignant transformation related genes |
| Identification of chemicals and drugs interact with genes involved in malignant transfromation |
| (DGIdb 4.0) |
| Entrez ID | Symbol | Category | Interaction Types | Drug Claim Name | Drug Name | PMIDs |
| Page: 1 |

Copyright 2023-Present -The University of Texas Health Science Center at Houston |