
|
|||||
|
 | |
| |
| |
| |
| |
| |
|
Gene: GNG5 |
Gene summary for GNG5 |
| Gene information | Species | Human | Gene symbol | GNG5 | Gene ID | 2787 |
| Gene name | G protein subunit gamma 5 | |
| Gene Alias | GNG5 | |
| Cytomap | 1p22.3 | |
| Gene Type | protein-coding | GO ID | GO:0007154 | UniProtAcc | P63218 |
Top |
Malignant transformation analysis |
| Identification of the aberrant gene expression in precancerous and cancerous lesions by comparing the gene expression of stem-like cells in diseased tissues with normal stem cells |
| Entrez ID | Symbol | Replicates | Species | Organ | Tissue | Adj P-value | Log2FC | Malignancy |
| 2787 | GNG5 | GSM4909282 | Human | Breast | IDC | 1.57e-09 | 3.91e-01 | -0.0288 |
| 2787 | GNG5 | GSM4909285 | Human | Breast | IDC | 4.98e-03 | 3.37e-01 | 0.21 |
| 2787 | GNG5 | GSM4909286 | Human | Breast | IDC | 1.07e-07 | -2.43e-01 | 0.1081 |
| 2787 | GNG5 | GSM4909294 | Human | Breast | IDC | 1.24e-08 | -8.40e-02 | 0.2022 |
| 2787 | GNG5 | GSM4909296 | Human | Breast | IDC | 6.36e-14 | 1.56e-01 | 0.1524 |
| 2787 | GNG5 | GSM4909297 | Human | Breast | IDC | 1.14e-19 | -2.72e-01 | 0.1517 |
| 2787 | GNG5 | GSM4909301 | Human | Breast | IDC | 3.95e-06 | 2.06e-01 | 0.1577 |
| 2787 | GNG5 | GSM4909307 | Human | Breast | IDC | 3.62e-09 | -3.92e-01 | 0.1569 |
| 2787 | GNG5 | GSM4909308 | Human | Breast | IDC | 4.54e-14 | -5.28e-01 | 0.158 |
| 2787 | GNG5 | GSM4909309 | Human | Breast | IDC | 3.83e-02 | -1.94e-01 | 0.0483 |
| 2787 | GNG5 | GSM4909311 | Human | Breast | IDC | 3.96e-52 | -8.15e-02 | 0.1534 |
| 2787 | GNG5 | GSM4909312 | Human | Breast | IDC | 5.81e-25 | 3.35e-01 | 0.1552 |
| 2787 | GNG5 | GSM4909313 | Human | Breast | IDC | 6.71e-06 | -2.51e-01 | 0.0391 |
| 2787 | GNG5 | GSM4909315 | Human | Breast | IDC | 3.57e-37 | 5.33e-01 | 0.21 |
| 2787 | GNG5 | GSM4909316 | Human | Breast | IDC | 8.15e-20 | 3.85e-01 | 0.21 |
| 2787 | GNG5 | GSM4909319 | Human | Breast | IDC | 1.83e-63 | -6.03e-01 | 0.1563 |
| 2787 | GNG5 | GSM4909320 | Human | Breast | IDC | 3.95e-12 | 1.14e-01 | 0.1575 |
| 2787 | GNG5 | GSM4909321 | Human | Breast | IDC | 4.05e-20 | -9.36e-02 | 0.1559 |
| 2787 | GNG5 | brca1 | Human | Breast | Precancer | 1.58e-02 | 2.67e-01 | -0.0338 |
| 2787 | GNG5 | brca2 | Human | Breast | Precancer | 1.21e-02 | 1.36e-01 | -0.024 |
| Page: 1 2 3 4 5 6 7 8 9 10 11 12 13 14 15 |
| Tissue | Expression Dynamics | Abbreviation |
| Breast | 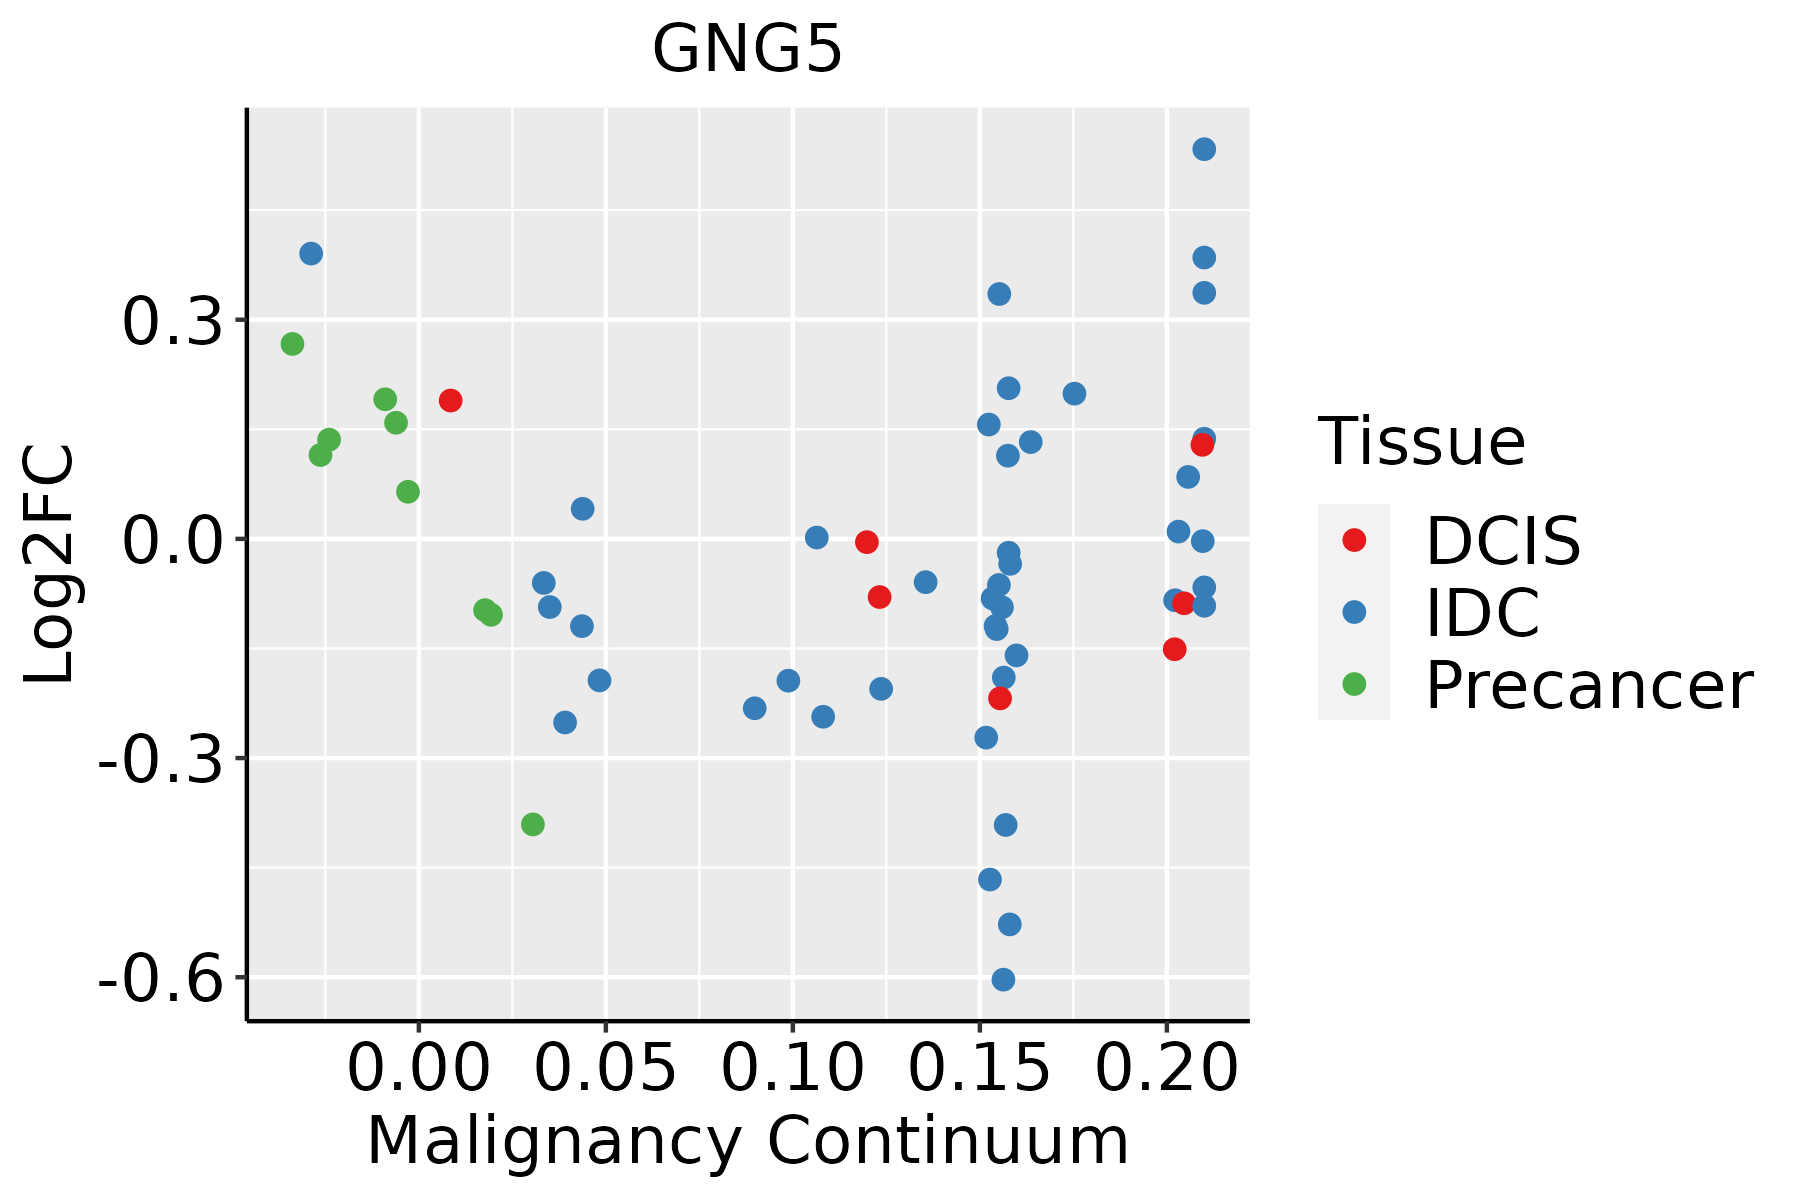 | IDC: Invasive ductal carcinoma |
| DCIS: Ductal carcinoma in situ | ||
| Precancer(BRCA1-mut): Precancerous lesion from BRCA1 mutation carriers | ||
| Cervix | 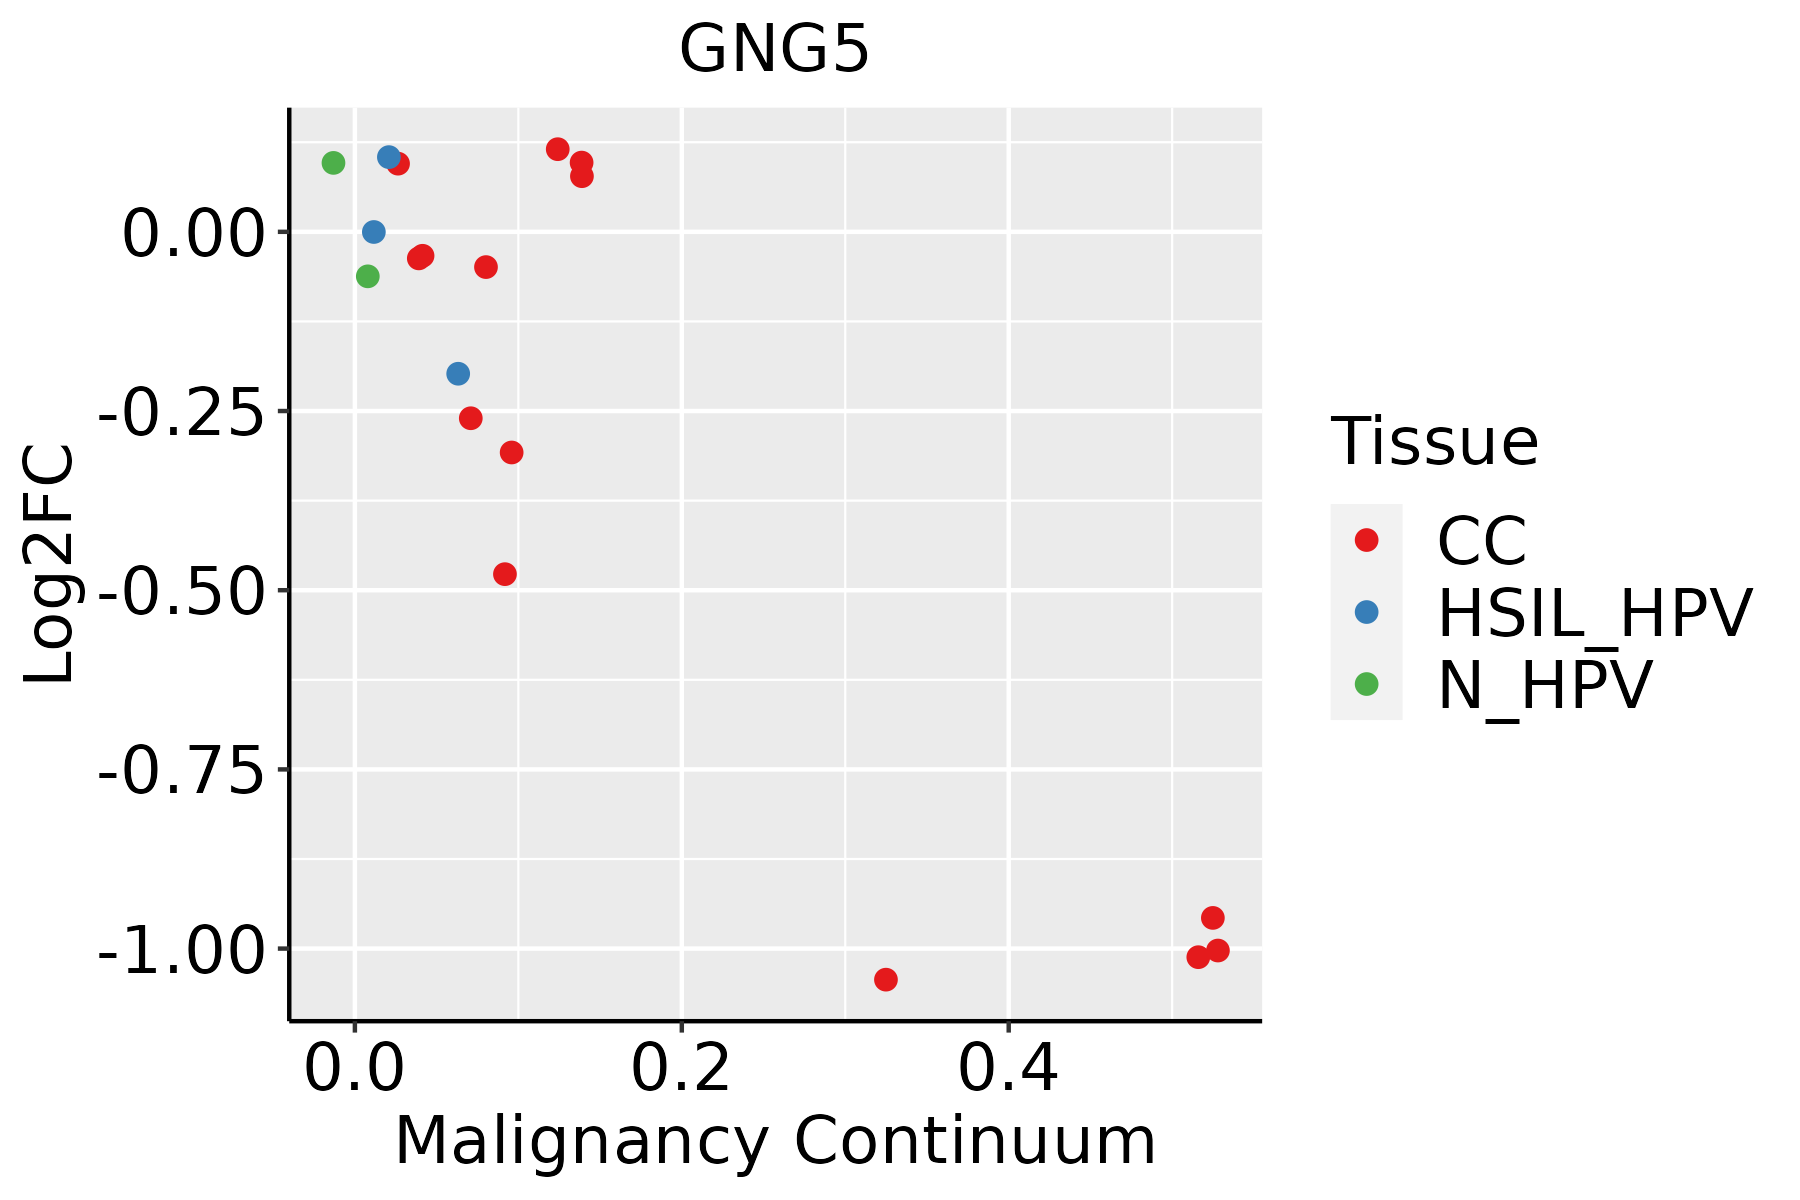 | CC: Cervix cancer |
| HSIL_HPV: HPV-infected high-grade squamous intraepithelial lesions | ||
| N_HPV: HPV-infected normal cervix | ||
| Colorectum (GSE201348) |  | FAP: Familial adenomatous polyposis |
| CRC: Colorectal cancer | ||
| Colorectum (HTA11) |  | AD: Adenomas |
| SER: Sessile serrated lesions | ||
| MSI-H: Microsatellite-high colorectal cancer | ||
| MSS: Microsatellite stable colorectal cancer | ||
| Endometrium |  | AEH: Atypical endometrial hyperplasia |
| EEC: Endometrioid Cancer | ||
| Esophagus |  | ESCC: Esophageal squamous cell carcinoma |
| HGIN: High-grade intraepithelial neoplasias | ||
| LGIN: Low-grade intraepithelial neoplasias | ||
| Liver |  | HCC: Hepatocellular carcinoma |
| NAFLD: Non-alcoholic fatty liver disease | ||
| Lung | 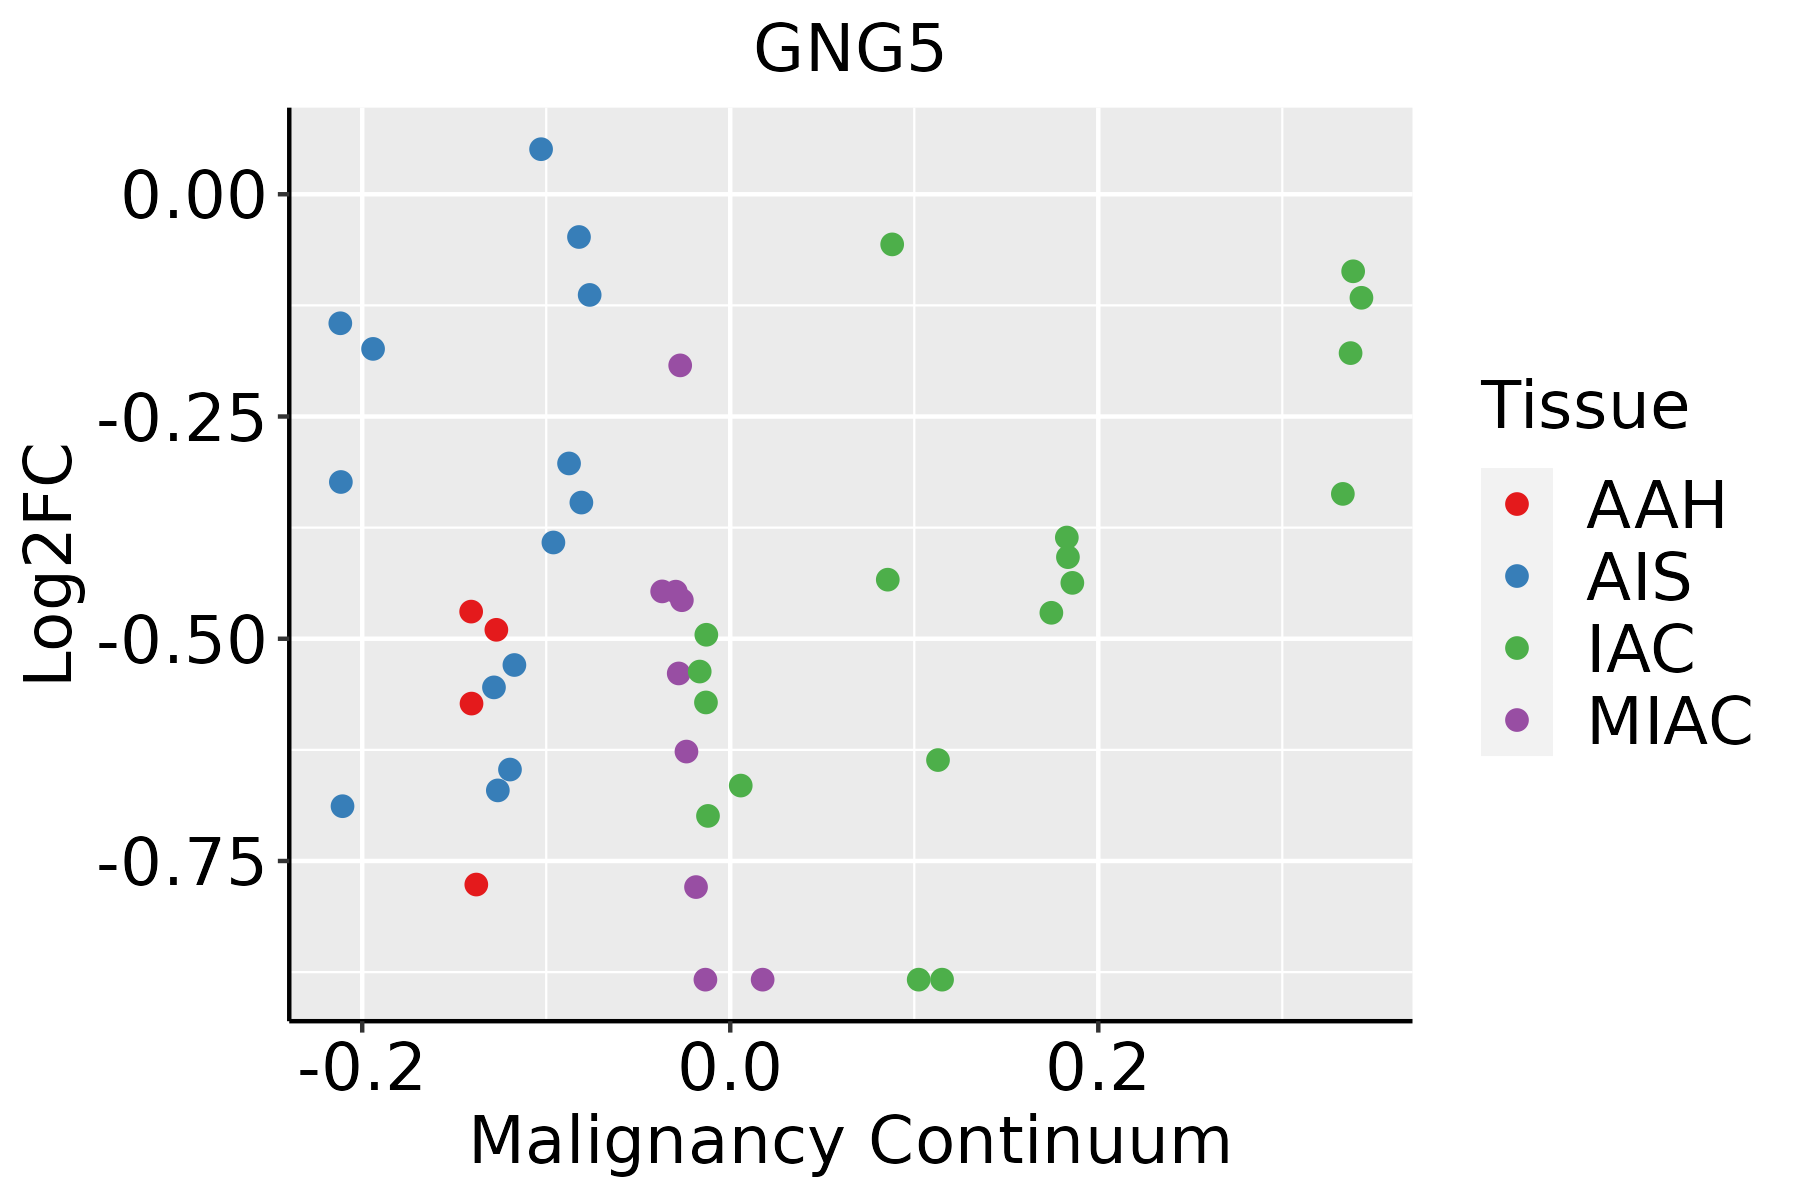 | AAH: Atypical adenomatous hyperplasia |
| AIS: Adenocarcinoma in situ | ||
| IAC: Invasive lung adenocarcinoma | ||
| MIA: Minimally invasive adenocarcinoma | ||
| Oral Cavity | 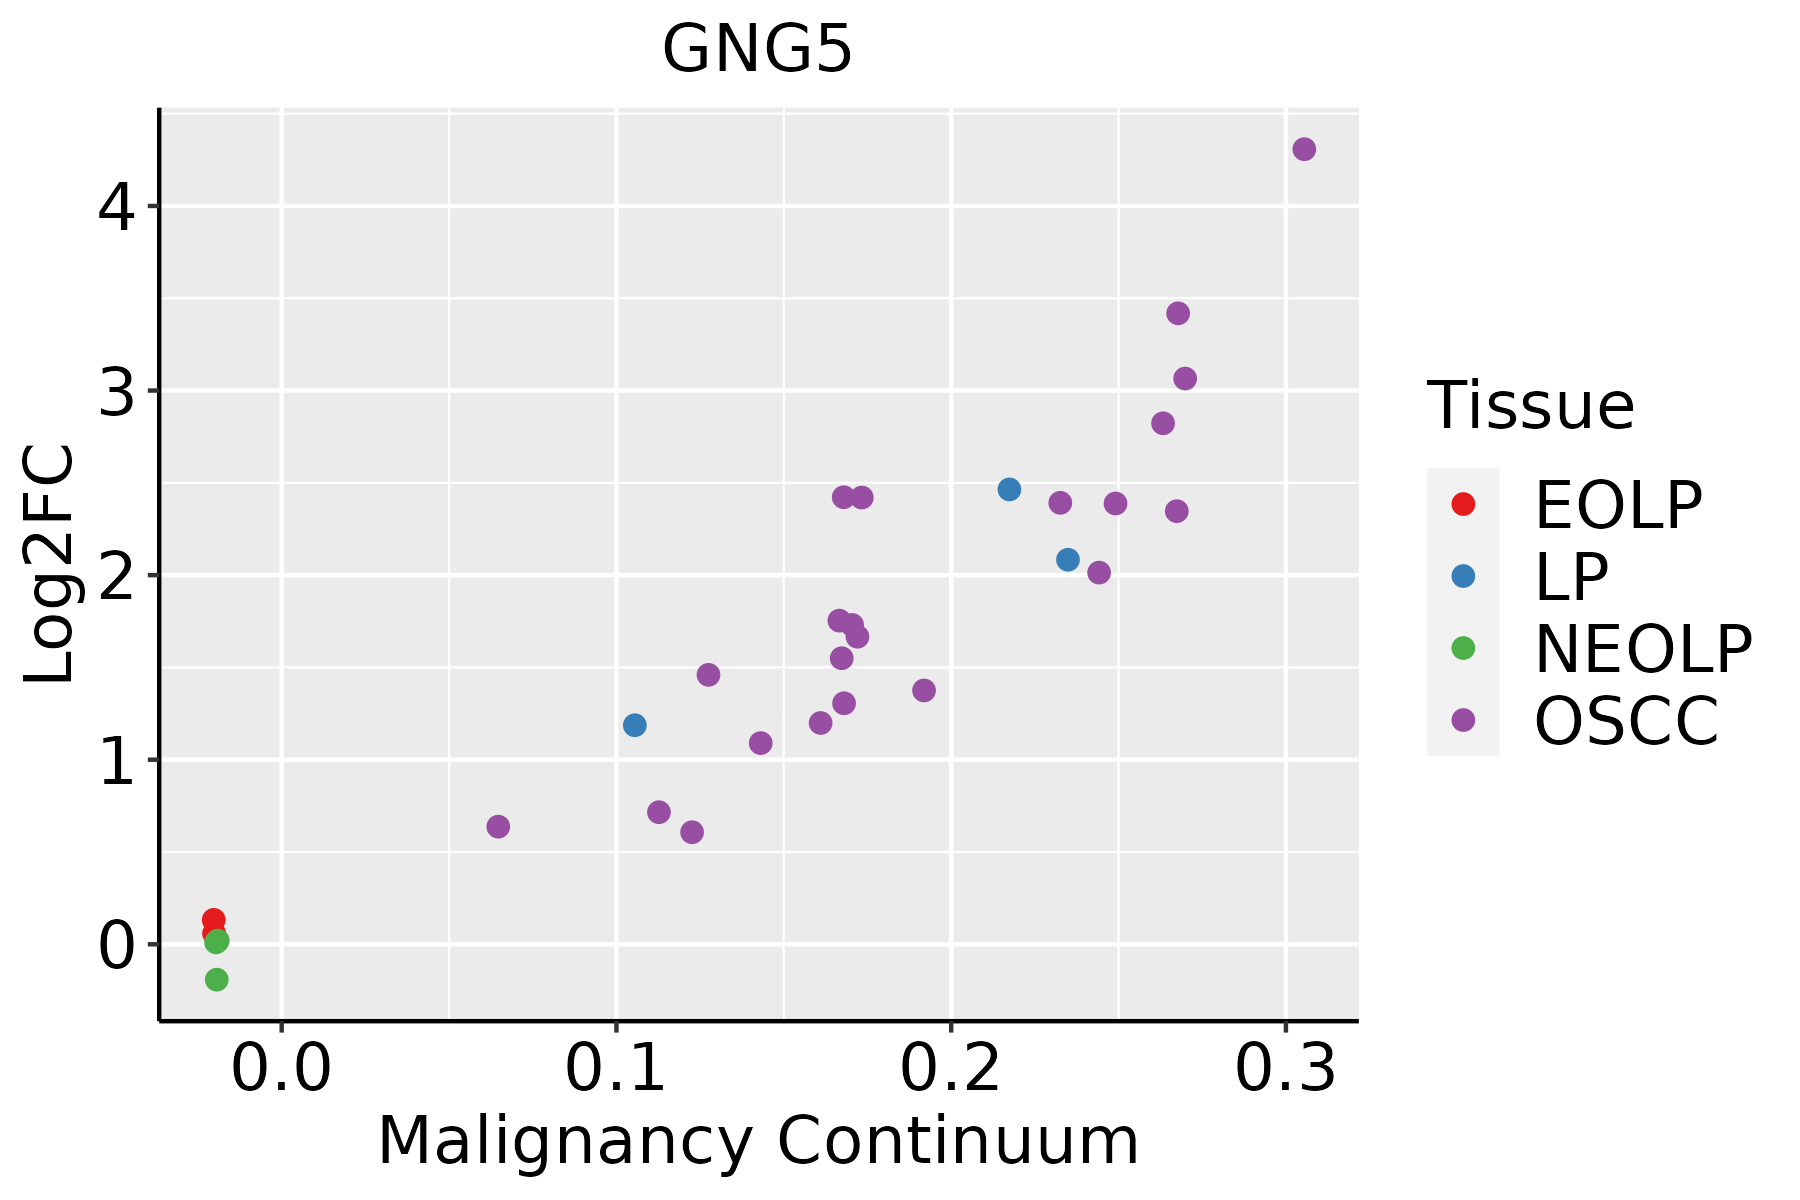 | EOLP: Erosive Oral lichen planus |
| LP: leukoplakia | ||
| NEOLP: Non-erosive oral lichen planus | ||
| OSCC: Oral squamous cell carcinoma | ||
| Prostate | 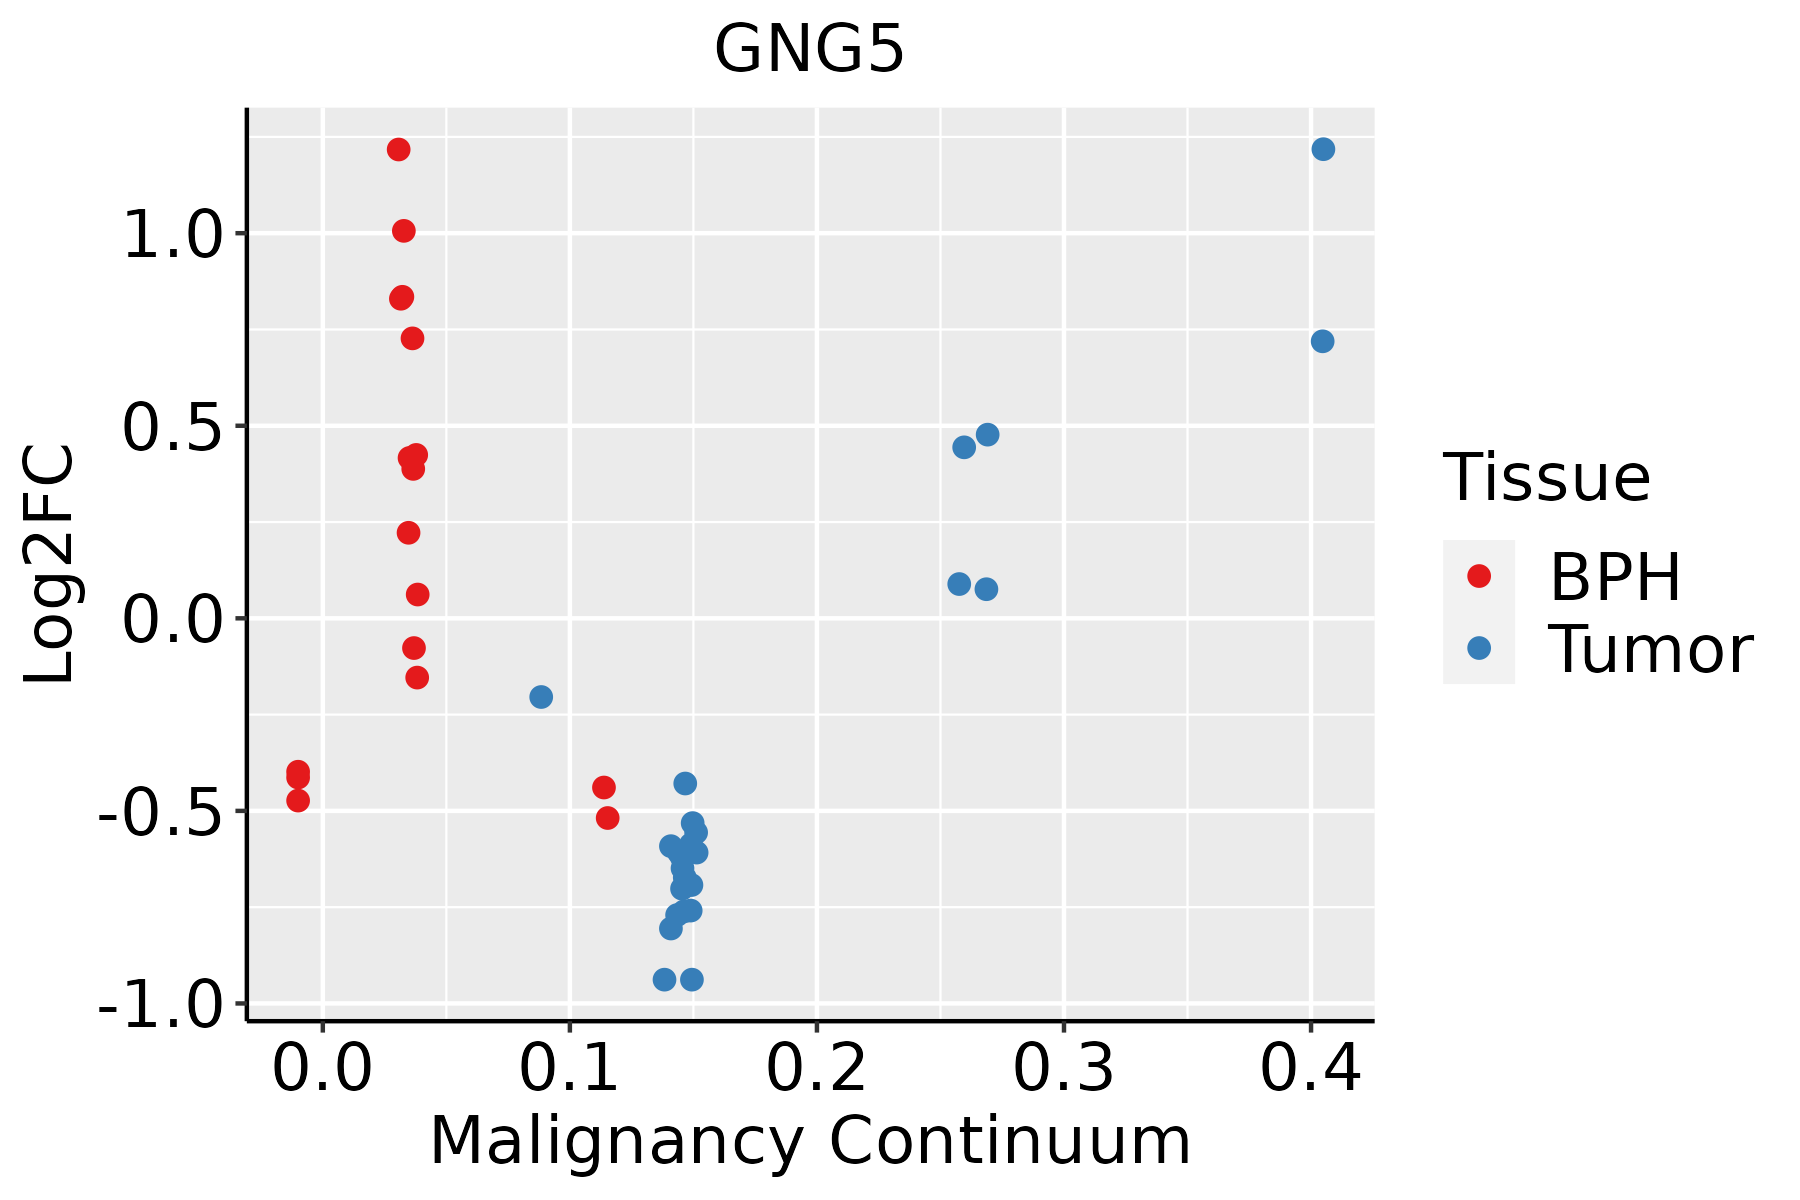 | BPH: Benign Prostatic Hyperplasia |
| Skin | 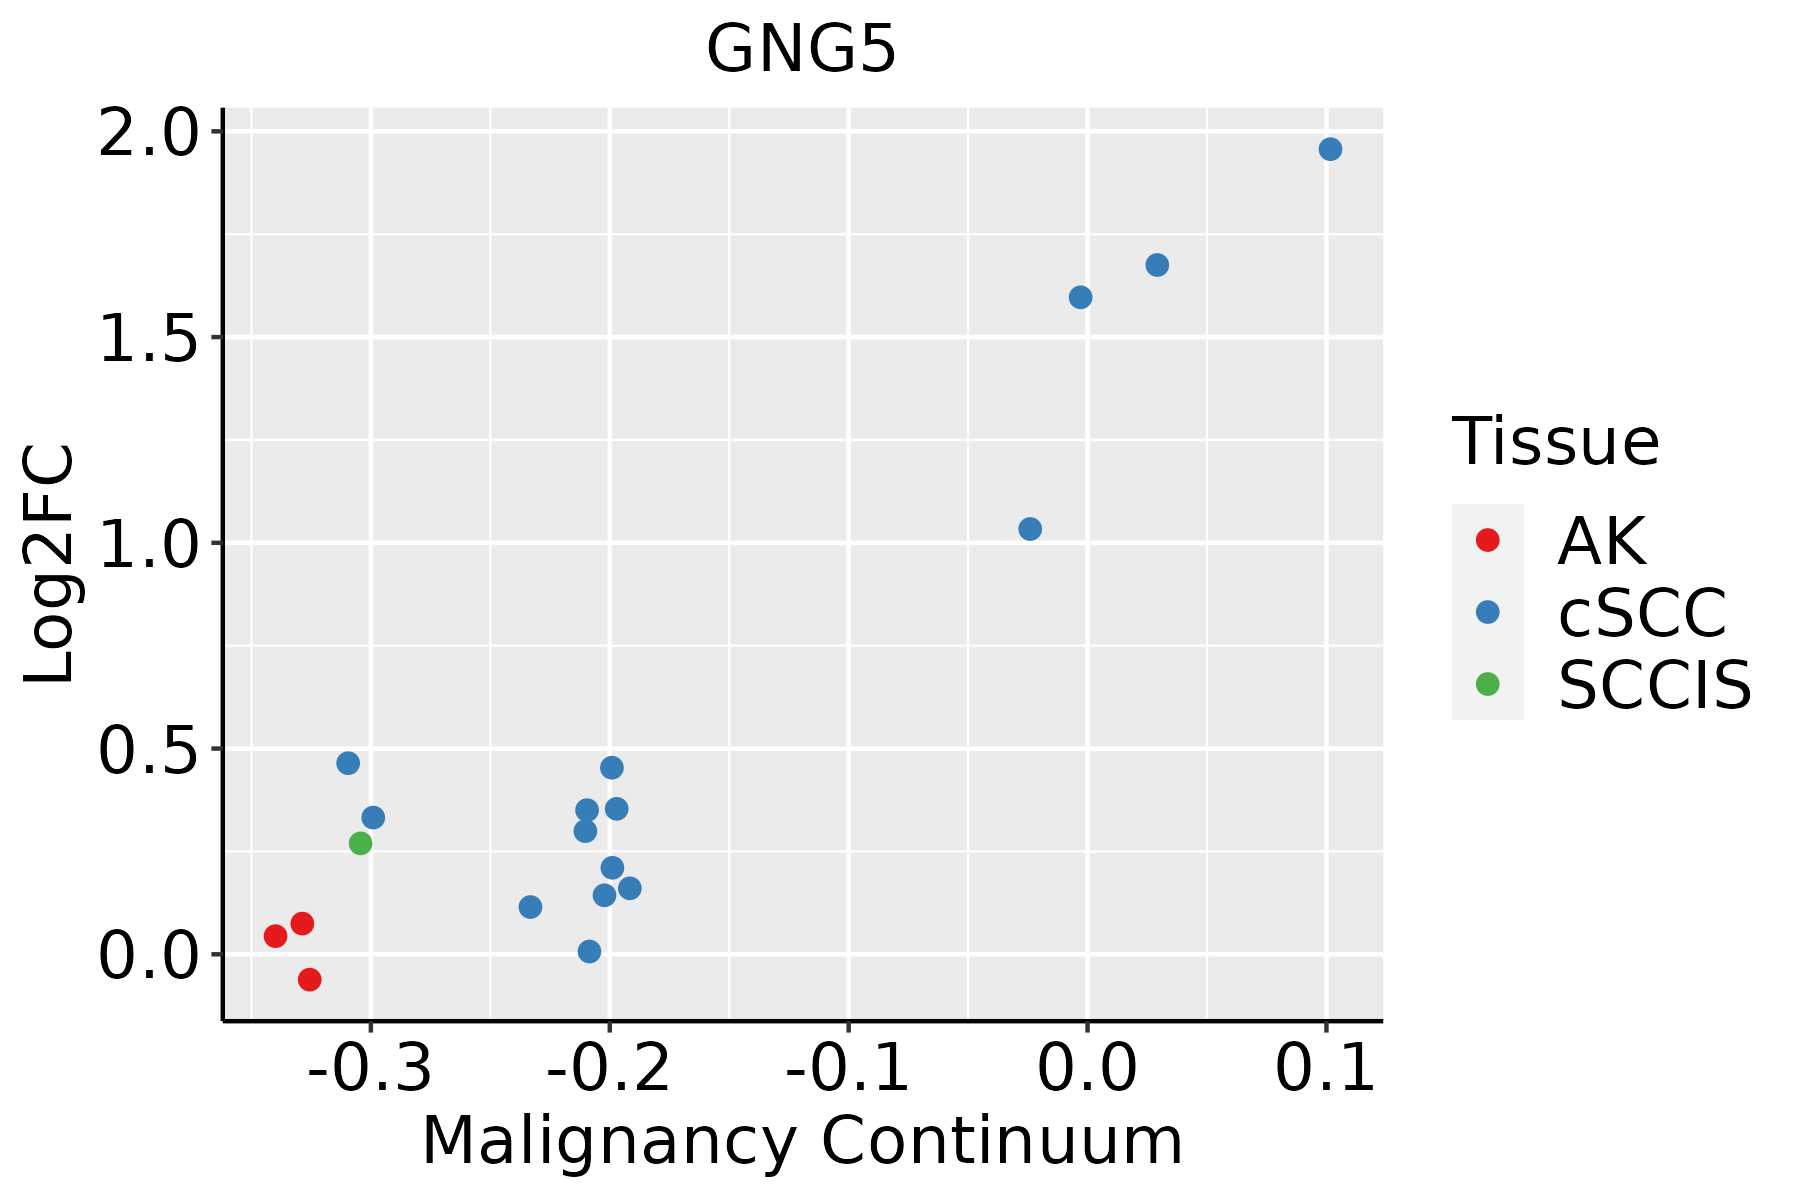 | AK: Actinic keratosis |
| cSCC: Cutaneous squamous cell carcinoma | ||
| SCCIS:squamous cell carcinoma in situ | ||
| Thyroid | 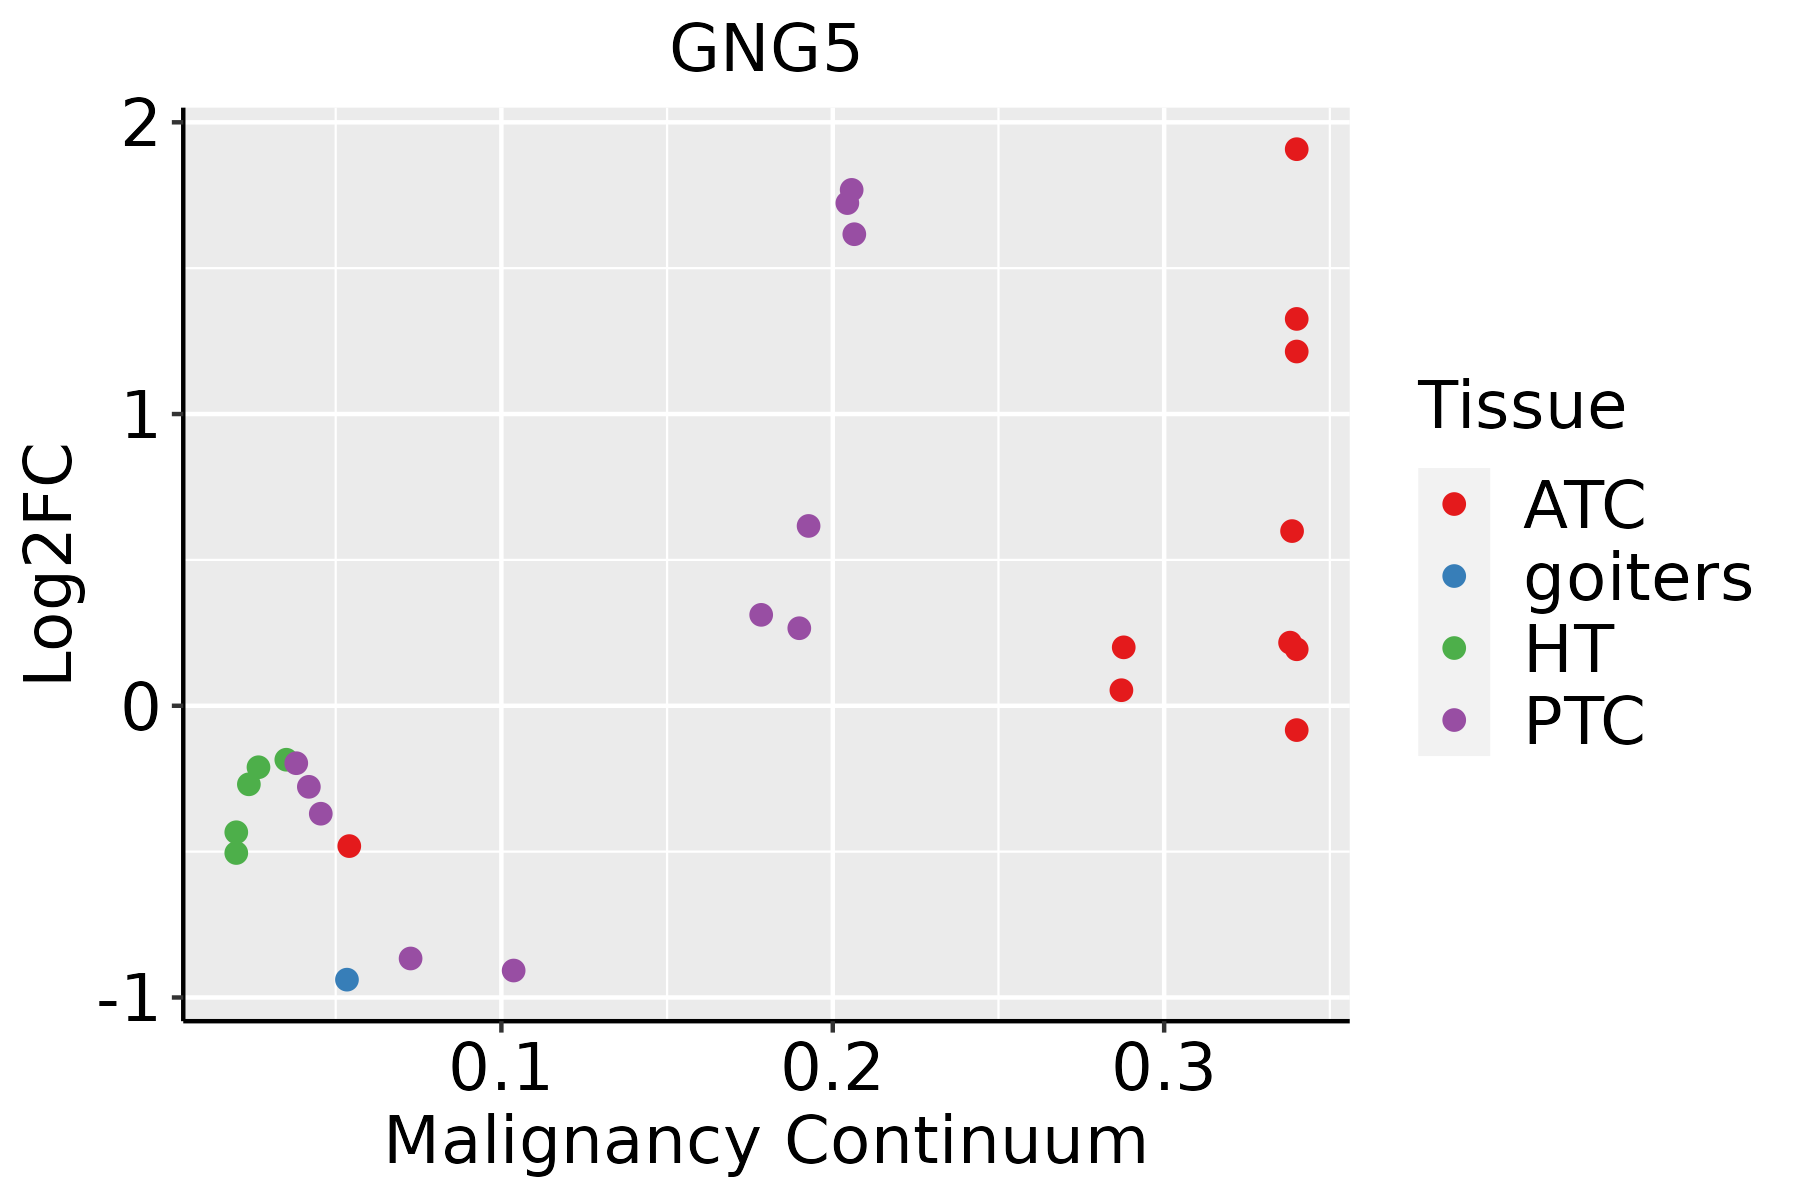 | ATC: Anaplastic thyroid cancer |
| HT: Hashimoto's thyroiditis | ||
| PTC: Papillary thyroid cancer |
| ∗log2FC in expression of this searched gene in stem-like cells from each diseased tissue sample relative to stem-like cells in normal samples in each tissue plotted against the malignancy continuum. Samples are colored based on if they are from different disease stage. |
Top |
Malignant transformation related pathway analysis |
| Find out the enriched GO biological processes and KEGG pathways involved in transition from healthy to precancer to cancer |
| Tissue | Disease Stage | Enriched GO biological Processes |
| Colorectum | AD |  |
| Colorectum | SER |  |
| Colorectum | MSS |  |
| Colorectum | MSI-H |  |
| Colorectum | FAP |  |
| ∗Top 15 enriched GO BP terms are showed in the bar plot of each disease state in each tissue. Each row represents a significant GO biological process which is colored according to the -log10(p.adjust). |
| Page: 1 2 3 4 5 6 7 8 9 |
| GO ID | Tissue | Disease Stage | Description | Gene Ratio | Bg Ratio | pvalue | p.adjust | Count |
| Page: 1 |
| Pathway ID | Tissue | Disease Stage | Description | Gene Ratio | Bg Ratio | pvalue | p.adjust | qvalue | Count |
| hsa0516718 | Breast | Precancer | Kaposi sarcoma-associated herpesvirus infection | 36/684 | 194/8465 | 1.68e-06 | 2.53e-05 | 1.94e-05 | 36 |
| hsa0472316 | Breast | Precancer | Retrograde endocannabinoid signaling | 25/684 | 148/8465 | 3.05e-04 | 2.47e-03 | 1.89e-03 | 25 |
| hsa0516316 | Breast | Precancer | Human cytomegalovirus infection | 32/684 | 225/8465 | 1.13e-03 | 7.57e-03 | 5.80e-03 | 32 |
| hsa0516719 | Breast | Precancer | Kaposi sarcoma-associated herpesvirus infection | 36/684 | 194/8465 | 1.68e-06 | 2.53e-05 | 1.94e-05 | 36 |
| hsa0472317 | Breast | Precancer | Retrograde endocannabinoid signaling | 25/684 | 148/8465 | 3.05e-04 | 2.47e-03 | 1.89e-03 | 25 |
| hsa0516317 | Breast | Precancer | Human cytomegalovirus infection | 32/684 | 225/8465 | 1.13e-03 | 7.57e-03 | 5.80e-03 | 32 |
| hsa0516723 | Breast | IDC | Kaposi sarcoma-associated herpesvirus infection | 38/867 | 194/8465 | 5.87e-05 | 5.96e-04 | 4.46e-04 | 38 |
| hsa0472323 | Breast | IDC | Retrograde endocannabinoid signaling | 31/867 | 148/8465 | 7.62e-05 | 7.50e-04 | 5.61e-04 | 31 |
| hsa0516324 | Breast | IDC | Human cytomegalovirus infection | 39/867 | 225/8465 | 6.66e-04 | 5.41e-03 | 4.05e-03 | 39 |
| hsa0517014 | Breast | IDC | Human immunodeficiency virus 1 infection | 33/867 | 212/8465 | 9.28e-03 | 4.37e-02 | 3.27e-02 | 33 |
| hsa0516733 | Breast | IDC | Kaposi sarcoma-associated herpesvirus infection | 38/867 | 194/8465 | 5.87e-05 | 5.96e-04 | 4.46e-04 | 38 |
| hsa0472333 | Breast | IDC | Retrograde endocannabinoid signaling | 31/867 | 148/8465 | 7.62e-05 | 7.50e-04 | 5.61e-04 | 31 |
| hsa0516334 | Breast | IDC | Human cytomegalovirus infection | 39/867 | 225/8465 | 6.66e-04 | 5.41e-03 | 4.05e-03 | 39 |
| hsa0517015 | Breast | IDC | Human immunodeficiency virus 1 infection | 33/867 | 212/8465 | 9.28e-03 | 4.37e-02 | 3.27e-02 | 33 |
| hsa0516743 | Breast | DCIS | Kaposi sarcoma-associated herpesvirus infection | 38/846 | 194/8465 | 3.43e-05 | 3.69e-04 | 2.72e-04 | 38 |
| hsa0472342 | Breast | DCIS | Retrograde endocannabinoid signaling | 29/846 | 148/8465 | 2.82e-04 | 2.34e-03 | 1.72e-03 | 29 |
| hsa0516344 | Breast | DCIS | Human cytomegalovirus infection | 38/846 | 225/8465 | 8.11e-04 | 5.95e-03 | 4.38e-03 | 38 |
| hsa0517024 | Breast | DCIS | Human immunodeficiency virus 1 infection | 33/846 | 212/8465 | 6.49e-03 | 3.22e-02 | 2.37e-02 | 33 |
| hsa0516753 | Breast | DCIS | Kaposi sarcoma-associated herpesvirus infection | 38/846 | 194/8465 | 3.43e-05 | 3.69e-04 | 2.72e-04 | 38 |
| hsa0472352 | Breast | DCIS | Retrograde endocannabinoid signaling | 29/846 | 148/8465 | 2.82e-04 | 2.34e-03 | 1.72e-03 | 29 |
| Page: 1 2 3 4 5 6 7 8 9 10 |
Top |
Cell-cell communication analysis |
| Identification of potential cell-cell interactions between two cell types and their ligand-receptor pairs for different disease states |
| Ligand | Receptor | LRpair | Pathway | Tissue | Disease Stage |
| Page: 1 |
Top |
Single-cell gene regulatory network inference analysis |
| Find out the significant the regulons (TFs) and the target genes of each regulon across cell types for different disease states |
| TF | Cell Type | Tissue | Disease Stage | Target Gene | RSS | Regulon Activity |
| ∗The dot plots of a searched regulon are shown for all cell subpopulations in each disease state of each tissue based on the regulon specific score inferred using pySCENIC and by calculating the average expression. |
| Page: 1 |
Top |
Somatic mutation of malignant transformation related genes |
| Annotation of somatic variants for genes involved in malignant transformation |
| Hugo Symbol | Variant Class | Variant Classification | dbSNP RS | HGVSc | HGVSp | HGVSp Short | SWISSPROT | BIOTYPE | SIFT | PolyPhen | Tumor Sample Barcode | Tissue | Histology | Sex | Age | Stage | Therapy Types | Drugs | Outcome |
| GNG5 | SNV | Missense_Mutation | c.92N>T | p.Ala31Val | p.A31V | P63218 | protein_coding | tolerated(0.06) | benign(0.424) | TCGA-AD-6889-01 | Colorectum | colon adenocarcinoma | Male | >=65 | I/II | Chemotherapy | xeloda | PD | |
| GNG5 | SNV | Missense_Mutation | rs61754630 | c.167C>T | p.Thr56Ile | p.T56I | P63218 | protein_coding | tolerated(0.05) | benign(0.052) | TCGA-AX-A2HC-01 | Endometrium | uterine corpus endometrioid carcinoma | Female | <65 | III/IV | Chemotherapy | paclitaxel | PD |
| GNG5 | SNV | Missense_Mutation | c.108A>T | p.Lys36Asn | p.K36N | P63218 | protein_coding | tolerated(0.12) | possibly_damaging(0.673) | TCGA-21-1070-01 | Lung | lung squamous cell carcinoma | Female | <65 | III/IV | Unknown | Unknown | SD |
| Page: 1 |
Top |
Related drugs of malignant transformation related genes |
| Identification of chemicals and drugs interact with genes involved in malignant transfromation |
| (DGIdb 4.0) |
| Entrez ID | Symbol | Category | Interaction Types | Drug Claim Name | Drug Name | PMIDs |
| Page: 1 |

Copyright 2023-Present -The University of Texas Health Science Center at Houston |