| Tissue | Expression Dynamics | Abbreviation |
| Colorectum (GSE201348) |  | FAP: Familial adenomatous polyposis |
| CRC: Colorectal cancer |
| Colorectum (HTA11) |  | AD: Adenomas |
| SER: Sessile serrated lesions |
| MSI-H: Microsatellite-high colorectal cancer |
| MSS: Microsatellite stable colorectal cancer |
| Esophagus | 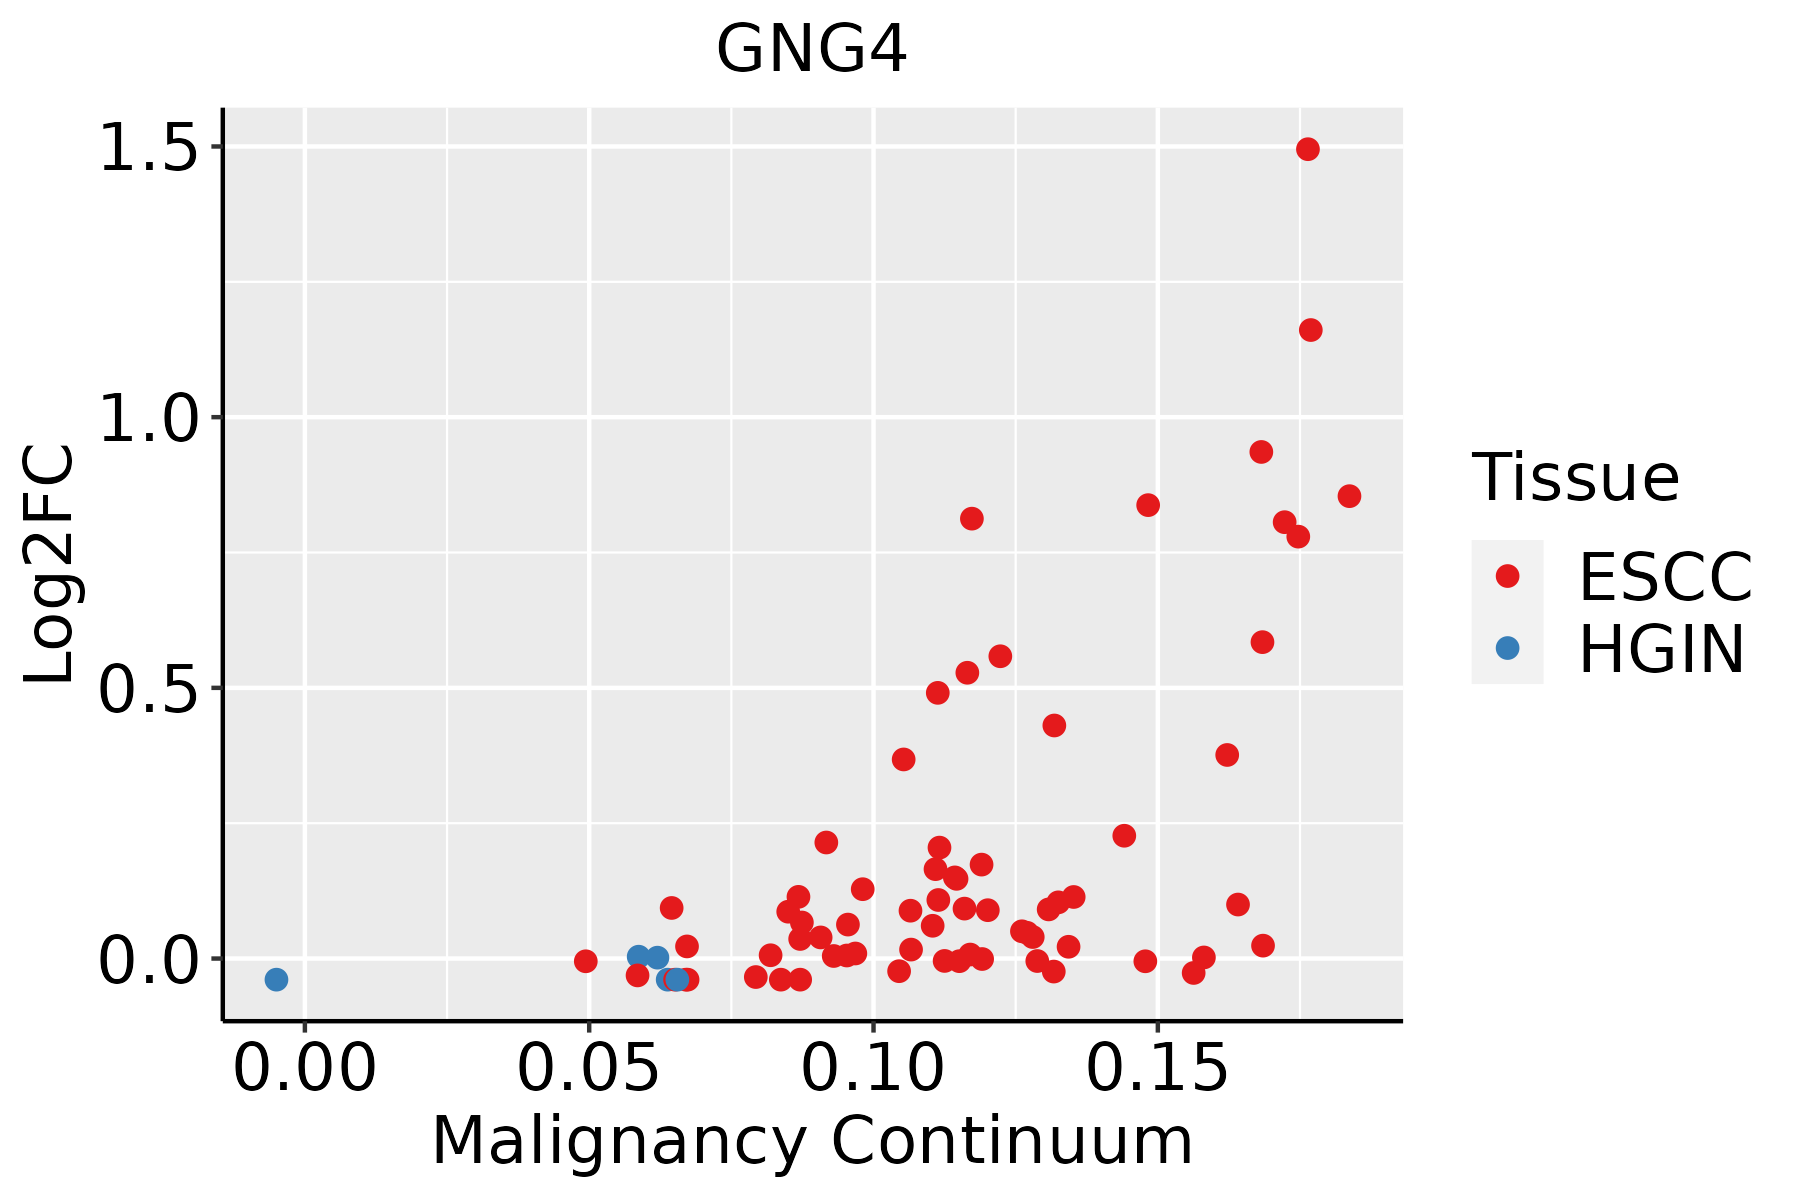 | ESCC: Esophageal squamous cell carcinoma |
| HGIN: High-grade intraepithelial neoplasias |
| LGIN: Low-grade intraepithelial neoplasias |
| Liver |  | HCC: Hepatocellular carcinoma |
| NAFLD: Non-alcoholic fatty liver disease |
| Oral Cavity | 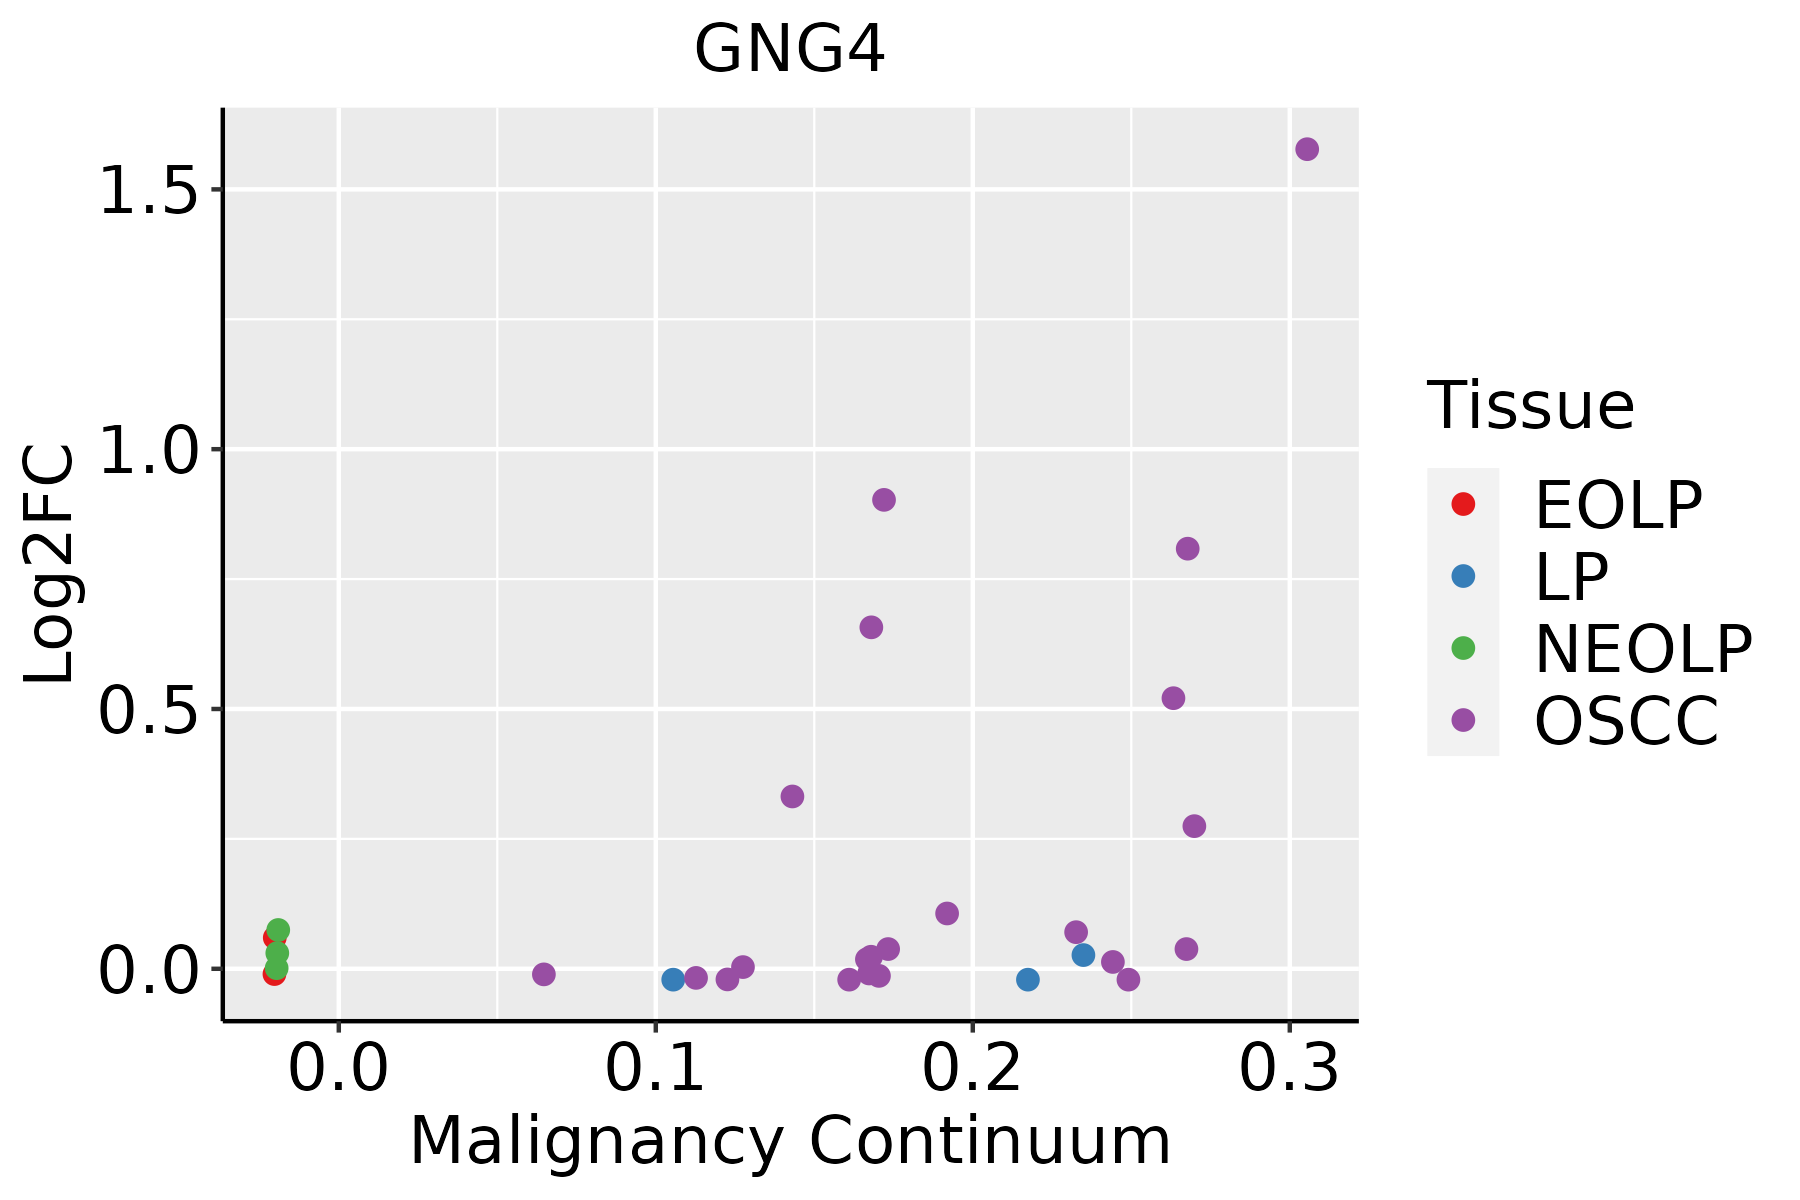 | EOLP: Erosive Oral lichen planus |
| LP: leukoplakia |
| NEOLP: Non-erosive oral lichen planus |
| OSCC: Oral squamous cell carcinoma |
| GO ID | Tissue | Disease Stage | Description | Gene Ratio | Bg Ratio | pvalue | p.adjust | Count |
| GO:0016049 | Colorectum | AD | cell growth | 143/3918 | 482/18723 | 2.83e-06 | 8.09e-05 | 143 |
| GO:0001558 | Colorectum | AD | regulation of cell growth | 124/3918 | 414/18723 | 7.67e-06 | 1.86e-04 | 124 |
| GO:0045926 | Colorectum | AD | negative regulation of growth | 70/3918 | 249/18723 | 4.07e-03 | 2.83e-02 | 70 |
| GO:00160492 | Colorectum | MSS | cell growth | 123/3467 | 482/18723 | 7.15e-05 | 1.21e-03 | 123 |
| GO:00015582 | Colorectum | MSS | regulation of cell growth | 105/3467 | 414/18723 | 2.97e-04 | 3.90e-03 | 105 |
| GO:00160494 | Colorectum | CRC | cell growth | 95/2078 | 482/18723 | 1.51e-08 | 2.75e-06 | 95 |
| GO:00015584 | Colorectum | CRC | regulation of cell growth | 78/2078 | 414/18723 | 1.84e-06 | 9.11e-05 | 78 |
| GO:0016049110 | Esophagus | ESCC | cell growth | 289/8552 | 482/18723 | 1.29e-10 | 3.77e-09 | 289 |
| GO:000155819 | Esophagus | ESCC | regulation of cell growth | 248/8552 | 414/18723 | 2.97e-09 | 6.45e-08 | 248 |
| GO:00459267 | Esophagus | ESCC | negative regulation of growth | 148/8552 | 249/18723 | 7.88e-06 | 7.73e-05 | 148 |
| GO:00303085 | Esophagus | ESCC | negative regulation of cell growth | 108/8552 | 188/18723 | 7.46e-04 | 3.87e-03 | 108 |
| GO:001604921 | Liver | HCC | cell growth | 269/7958 | 482/18723 | 1.84e-09 | 5.35e-08 | 269 |
| GO:000155821 | Liver | HCC | regulation of cell growth | 228/7958 | 414/18723 | 1.34e-07 | 2.55e-06 | 228 |
| GO:00459263 | Liver | HCC | negative regulation of growth | 129/7958 | 249/18723 | 1.81e-03 | 9.37e-03 | 129 |
| GO:0030308 | Liver | HCC | negative regulation of cell growth | 98/7958 | 188/18723 | 4.74e-03 | 2.02e-02 | 98 |
| GO:001604917 | Oral cavity | OSCC | cell growth | 268/7305 | 482/18723 | 6.55e-14 | 3.51e-12 | 268 |
| GO:000155816 | Oral cavity | OSCC | regulation of cell growth | 228/7305 | 414/18723 | 1.74e-11 | 6.09e-10 | 228 |
| GO:00459266 | Oral cavity | OSCC | negative regulation of growth | 135/7305 | 249/18723 | 7.29e-07 | 1.03e-05 | 135 |
| GO:00303084 | Oral cavity | OSCC | negative regulation of cell growth | 101/7305 | 188/18723 | 2.85e-05 | 2.63e-04 | 101 |
| Pathway ID | Tissue | Disease Stage | Description | Gene Ratio | Bg Ratio | pvalue | p.adjust | qvalue | Count |
| hsa047234 | Colorectum | MSS | Retrograde endocannabinoid signaling | 61/1875 | 148/8465 | 1.21e-07 | 1.93e-06 | 1.18e-06 | 61 |
| hsa051634 | Colorectum | MSS | Human cytomegalovirus infection | 74/1875 | 225/8465 | 1.12e-04 | 1.01e-03 | 6.19e-04 | 74 |
| hsa051704 | Colorectum | MSS | Human immunodeficiency virus 1 infection | 69/1875 | 212/8465 | 2.66e-04 | 1.98e-03 | 1.21e-03 | 69 |
| hsa047284 | Colorectum | MSS | Dopaminergic synapse | 45/1875 | 132/8465 | 1.02e-03 | 5.94e-03 | 3.64e-03 | 45 |
| hsa05167 | Colorectum | MSS | Kaposi sarcoma-associated herpesvirus infection | 60/1875 | 194/8465 | 2.59e-03 | 1.27e-02 | 7.81e-03 | 60 |
| hsa04713 | Colorectum | MSS | Circadian entrainment | 32/1875 | 97/8465 | 8.84e-03 | 3.25e-02 | 1.99e-02 | 32 |
| hsa04725 | Colorectum | MSS | Cholinergic synapse | 36/1875 | 113/8465 | 1.05e-02 | 3.69e-02 | 2.26e-02 | 36 |
| hsa04926 | Colorectum | MSS | Relaxin signaling pathway | 40/1875 | 129/8465 | 1.18e-02 | 3.99e-02 | 2.44e-02 | 40 |
| hsa047235 | Colorectum | MSS | Retrograde endocannabinoid signaling | 61/1875 | 148/8465 | 1.21e-07 | 1.93e-06 | 1.18e-06 | 61 |
| hsa051635 | Colorectum | MSS | Human cytomegalovirus infection | 74/1875 | 225/8465 | 1.12e-04 | 1.01e-03 | 6.19e-04 | 74 |
| hsa051705 | Colorectum | MSS | Human immunodeficiency virus 1 infection | 69/1875 | 212/8465 | 2.66e-04 | 1.98e-03 | 1.21e-03 | 69 |
| hsa047285 | Colorectum | MSS | Dopaminergic synapse | 45/1875 | 132/8465 | 1.02e-03 | 5.94e-03 | 3.64e-03 | 45 |
| hsa051671 | Colorectum | MSS | Kaposi sarcoma-associated herpesvirus infection | 60/1875 | 194/8465 | 2.59e-03 | 1.27e-02 | 7.81e-03 | 60 |
| hsa047131 | Colorectum | MSS | Circadian entrainment | 32/1875 | 97/8465 | 8.84e-03 | 3.25e-02 | 1.99e-02 | 32 |
| hsa047251 | Colorectum | MSS | Cholinergic synapse | 36/1875 | 113/8465 | 1.05e-02 | 3.69e-02 | 2.26e-02 | 36 |
| hsa049261 | Colorectum | MSS | Relaxin signaling pathway | 40/1875 | 129/8465 | 1.18e-02 | 3.99e-02 | 2.44e-02 | 40 |
| hsa04014 | Colorectum | CRC | Ras signaling pathway | 49/1091 | 236/8465 | 4.04e-04 | 4.50e-03 | 3.05e-03 | 49 |
| hsa051638 | Colorectum | CRC | Human cytomegalovirus infection | 45/1091 | 225/8465 | 1.54e-03 | 1.17e-02 | 7.94e-03 | 45 |
| hsa041512 | Colorectum | CRC | PI3K-Akt signaling pathway | 64/1091 | 354/8465 | 2.70e-03 | 1.77e-02 | 1.20e-02 | 64 |
| hsa047288 | Colorectum | CRC | Dopaminergic synapse | 28/1091 | 132/8465 | 4.86e-03 | 2.66e-02 | 1.80e-02 | 28 |
| Hugo Symbol | Variant Class | Variant Classification | dbSNP RS | HGVSc | HGVSp | HGVSp Short | SWISSPROT | BIOTYPE | SIFT | PolyPhen | Tumor Sample Barcode | Tissue | Histology | Sex | Age | Stage | Therapy Types | Drugs | Outcome |
| GNG4 | insertion | Frame_Shift_Ins | novel | c.139_140insAGACAGGGTCTCACTATGTTGCCTGGGTTAGTCTCGAACT | p.Ala47GlufsTer69 | p.A47Efs*69 | P50150 | protein_coding | | | TCGA-A2-A0ER-01 | Breast | breast invasive carcinoma | Female | <65 | I/II | Chemotherapy | cytoxan | SD |
| GNG4 | SNV | Missense_Mutation | rs756924811 | c.197N>A | p.Arg66His | p.R66H | P50150 | protein_coding | deleterious(0) | probably_damaging(0.966) | TCGA-D5-6535-01 | Colorectum | colon adenocarcinoma | Female | >=65 | III/IV | Unknown | Unknown | SD |
| GNG4 | SNV | Missense_Mutation | rs764998095 | c.196C>T | p.Arg66Cys | p.R66C | P50150 | protein_coding | deleterious(0) | probably_damaging(0.966) | TCGA-AG-A002-01 | Colorectum | rectum adenocarcinoma | Male | <65 | I/II | Unknown | Unknown | SD |
| GNG4 | SNV | Missense_Mutation | rs777087327 | c.44N>G | p.Gln15Arg | p.Q15R | P50150 | protein_coding | tolerated(0.1) | probably_damaging(0.992) | TCGA-AX-A0J0-01 | Endometrium | uterine corpus endometrioid carcinoma | Female | <65 | I/II | Unknown | Unknown | SD |
| GNG4 | SNV | Missense_Mutation | | c.116C>T | p.Ala39Val | p.A39V | P50150 | protein_coding | deleterious(0.02) | possibly_damaging(0.869) | TCGA-AX-A2HC-01 | Endometrium | uterine corpus endometrioid carcinoma | Female | <65 | III/IV | Chemotherapy | paclitaxel | PD |
| GNG4 | SNV | Missense_Mutation | | c.116C>T | p.Ala39Val | p.A39V | P50150 | protein_coding | deleterious(0.02) | possibly_damaging(0.869) | TCGA-AX-A2HD-01 | Endometrium | uterine corpus endometrioid carcinoma | Female | >=65 | III/IV | Unknown | Unknown | SD |
| GNG4 | SNV | Missense_Mutation | | c.163A>G | p.Ile55Val | p.I55V | P50150 | protein_coding | tolerated(0.18) | benign(0.235) | TCGA-B5-A11E-01 | Endometrium | uterine corpus endometrioid carcinoma | Female | <65 | I/II | Unknown | Unknown | SD |
| GNG4 | SNV | Missense_Mutation | rs759798253 | c.210N>A | p.Phe70Leu | p.F70L | P50150 | protein_coding | tolerated(1) | benign(0.009) | TCGA-B5-A1MR-01 | Endometrium | uterine corpus endometrioid carcinoma | Female | >=65 | III/IV | Unknown | Unknown | SD |
| GNG4 | SNV | Missense_Mutation | rs769944125 | c.145G>A | p.Val49Met | p.V49M | P50150 | protein_coding | deleterious(0.03) | benign(0.015) | TCGA-B5-A3FC-01 | Endometrium | uterine corpus endometrioid carcinoma | Female | <65 | I/II | Unknown | Unknown | SD |
| GNG4 | SNV | Missense_Mutation | rs747916965 | c.148C>T | p.Arg50Trp | p.R50W | P50150 | protein_coding | deleterious(0) | possibly_damaging(0.761) | TCGA-BS-A0UM-01 | Endometrium | uterine corpus endometrioid carcinoma | Female | <65 | I/II | Chemotherapy | adriamycin | SD |


