
|
|||||
|
 | |
| |
| |
| |
| |
| |
|
Gene: GNG2 |
Gene summary for GNG2 |
| Gene information | Species | Human | Gene symbol | GNG2 | Gene ID | 54331 |
| Gene name | G protein subunit gamma 2 | |
| Gene Alias | GNG2 | |
| Cytomap | 14q22.1 | |
| Gene Type | protein-coding | GO ID | GO:0007154 | UniProtAcc | P59768 |
Top |
Malignant transformation analysis |
| Identification of the aberrant gene expression in precancerous and cancerous lesions by comparing the gene expression of stem-like cells in diseased tissues with normal stem cells |
| Entrez ID | Symbol | Replicates | Species | Organ | Tissue | Adj P-value | Log2FC | Malignancy |
| 54331 | GNG2 | LZE4T | Human | Esophagus | ESCC | 2.31e-03 | 1.81e-01 | 0.0811 |
| 54331 | GNG2 | LZE7T | Human | Esophagus | ESCC | 2.10e-06 | 3.93e-01 | 0.0667 |
| 54331 | GNG2 | LZE6T | Human | Esophagus | ESCC | 1.58e-18 | 9.78e-01 | 0.0845 |
| 54331 | GNG2 | P10T-E | Human | Esophagus | ESCC | 3.37e-06 | 8.82e-02 | 0.116 |
| 54331 | GNG2 | P11T-E | Human | Esophagus | ESCC | 8.40e-17 | 7.15e-01 | 0.1426 |
| 54331 | GNG2 | P12T-E | Human | Esophagus | ESCC | 3.10e-19 | 5.08e-01 | 0.1122 |
| 54331 | GNG2 | P16T-E | Human | Esophagus | ESCC | 9.52e-12 | 2.27e-01 | 0.1153 |
| 54331 | GNG2 | P19T-E | Human | Esophagus | ESCC | 1.92e-08 | 8.35e-01 | 0.1662 |
| 54331 | GNG2 | P24T-E | Human | Esophagus | ESCC | 8.69e-04 | 2.26e-01 | 0.1287 |
| 54331 | GNG2 | P32T-E | Human | Esophagus | ESCC | 9.69e-13 | 4.02e-01 | 0.1666 |
| 54331 | GNG2 | P37T-E | Human | Esophagus | ESCC | 2.56e-27 | 6.41e-01 | 0.1371 |
| 54331 | GNG2 | P44T-E | Human | Esophagus | ESCC | 7.88e-03 | 1.77e-01 | 0.1096 |
| 54331 | GNG2 | C21 | Human | Oral cavity | OSCC | 7.03e-03 | 2.32e-01 | 0.2678 |
| 54331 | GNG2 | C30 | Human | Oral cavity | OSCC | 1.66e-04 | 3.18e-01 | 0.3055 |
| 54331 | GNG2 | C38 | Human | Oral cavity | OSCC | 5.04e-10 | 6.90e-01 | 0.172 |
| 54331 | GNG2 | C07 | Human | Oral cavity | OSCC | 5.85e-03 | 6.70e-01 | 0.2491 |
| 54331 | GNG2 | C09 | Human | Oral cavity | OSCC | 4.31e-12 | 2.66e-01 | 0.1431 |
| 54331 | GNG2 | LN22 | Human | Oral cavity | OSCC | 6.06e-04 | 4.77e-01 | 0.1733 |
| 54331 | GNG2 | EOLP-1 | Human | Oral cavity | EOLP | 2.48e-06 | 3.65e-01 | -0.0202 |
| 54331 | GNG2 | NEOLP-1 | Human | Oral cavity | NEOLP | 5.13e-03 | 2.49e-01 | -0.0194 |
| Page: 1 2 |
| Tissue | Expression Dynamics | Abbreviation |
| Esophagus | 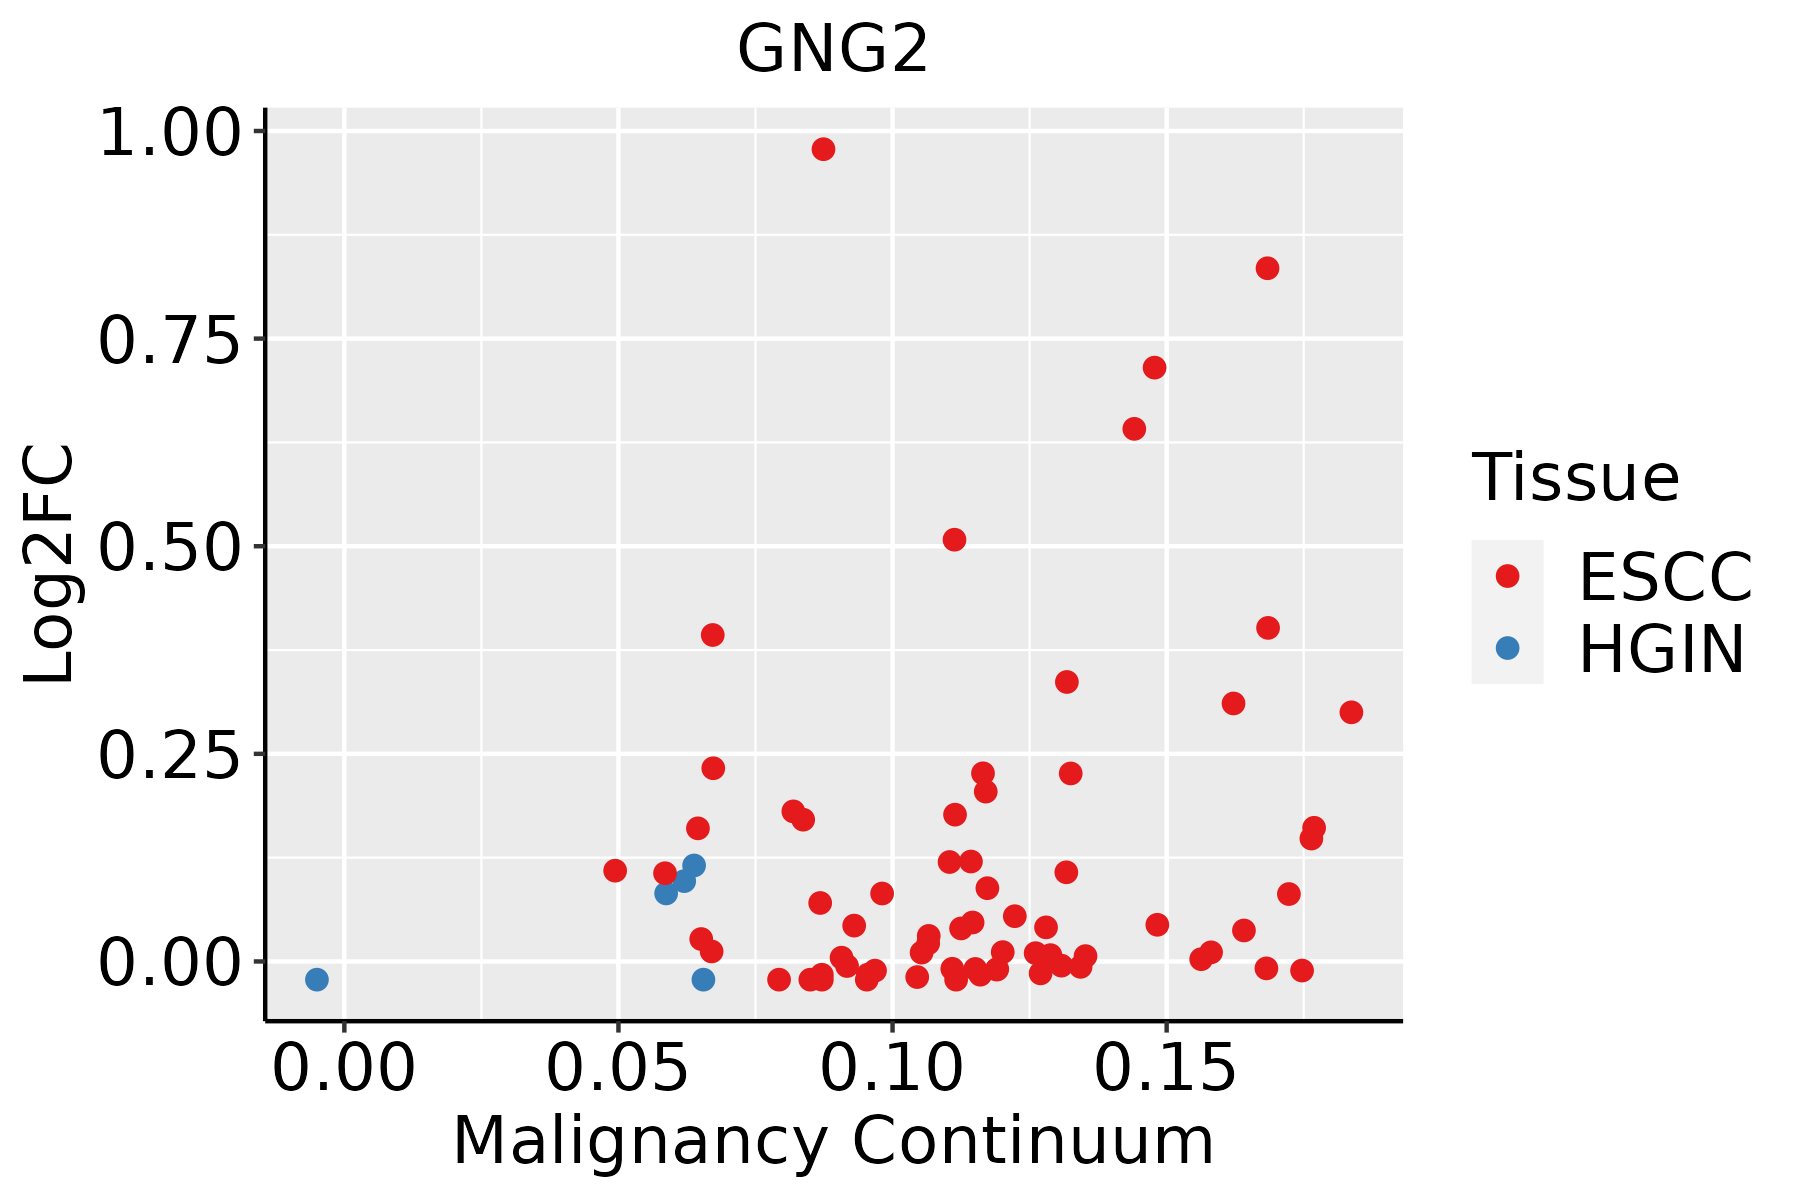 | ESCC: Esophageal squamous cell carcinoma |
| HGIN: High-grade intraepithelial neoplasias | ||
| LGIN: Low-grade intraepithelial neoplasias | ||
| Oral Cavity | 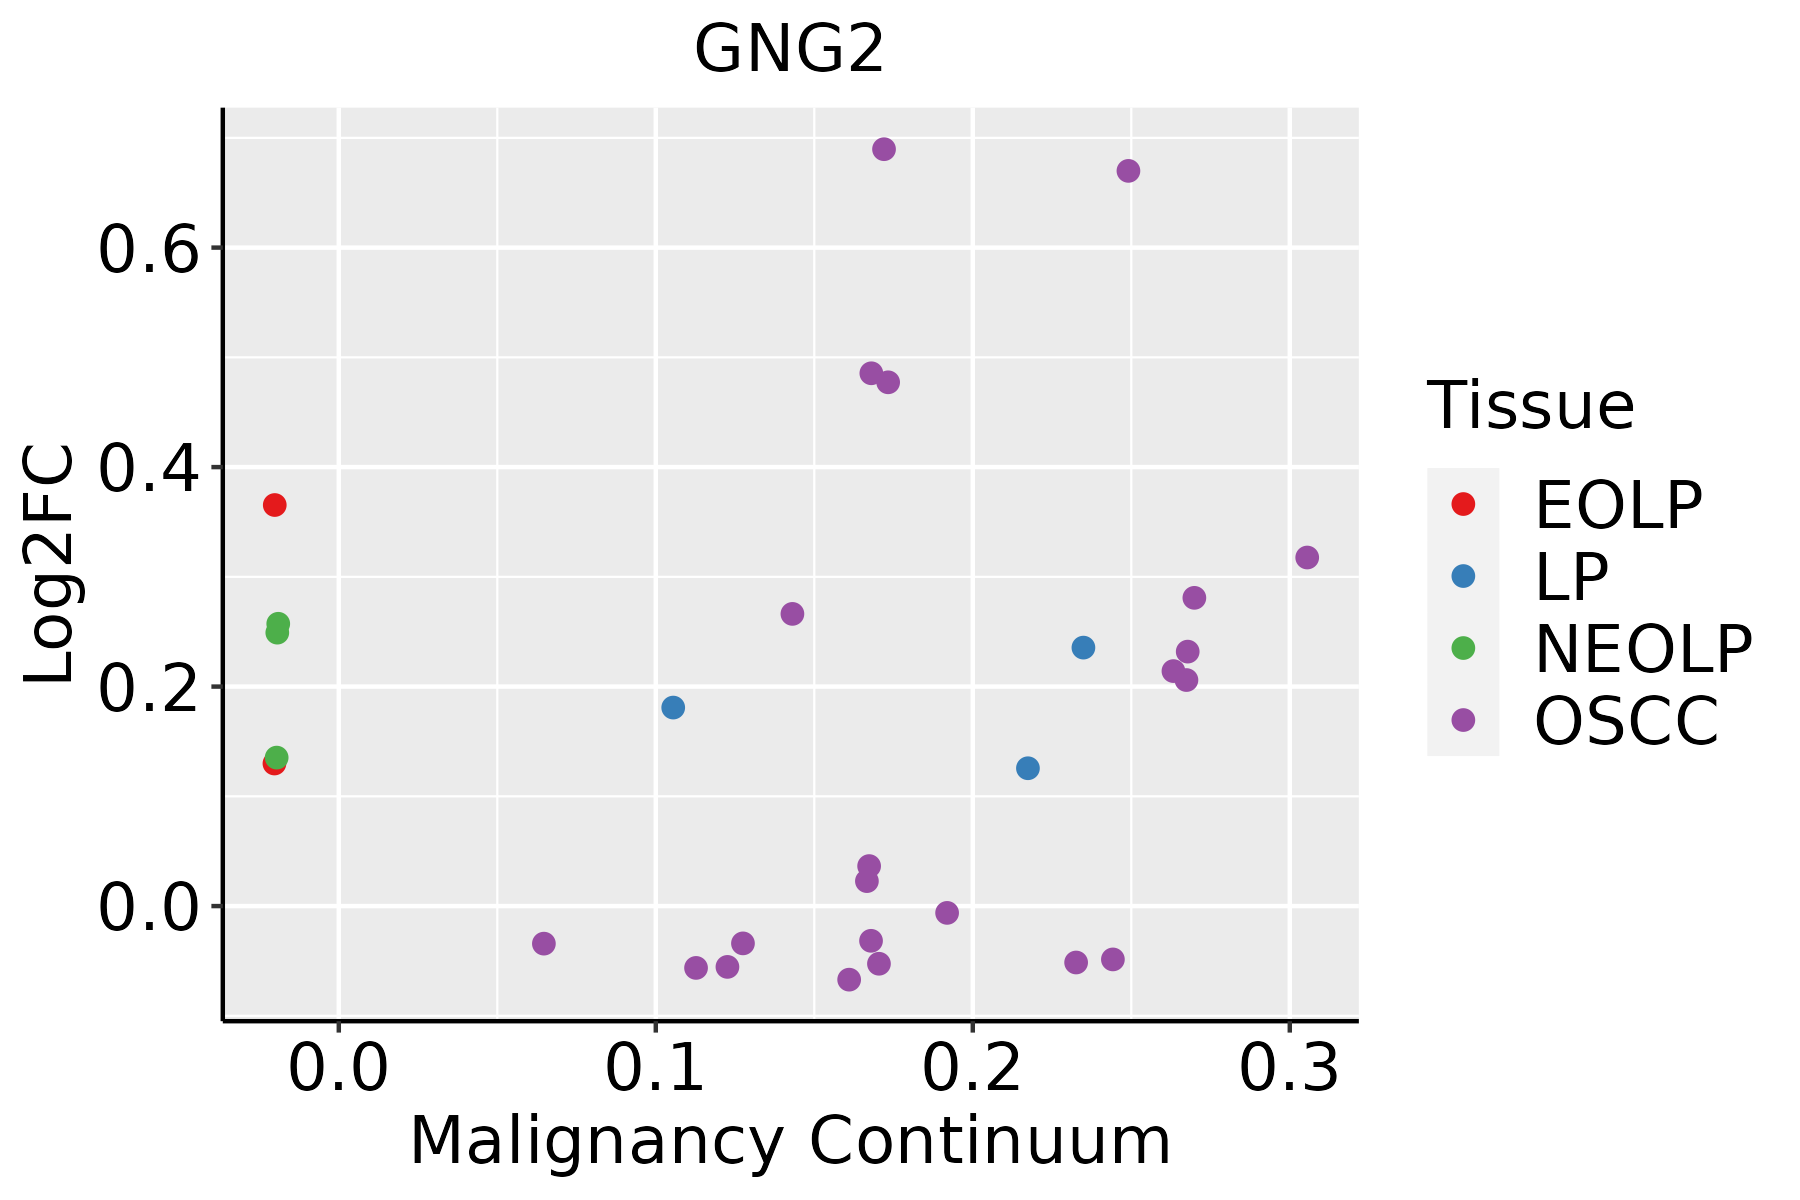 | EOLP: Erosive Oral lichen planus |
| LP: leukoplakia | ||
| NEOLP: Non-erosive oral lichen planus | ||
| OSCC: Oral squamous cell carcinoma |
| ∗log2FC in expression of this searched gene in stem-like cells from each diseased tissue sample relative to stem-like cells in normal samples in each tissue plotted against the malignancy continuum. Samples are colored based on if they are from different disease stage. |
Top |
Malignant transformation related pathway analysis |
| Find out the enriched GO biological processes and KEGG pathways involved in transition from healthy to precancer to cancer |
| Tissue | Disease Stage | Enriched GO biological Processes |
| Colorectum | AD |  |
| Colorectum | SER |  |
| Colorectum | MSS |  |
| Colorectum | MSI-H |  |
| Colorectum | FAP |  |
| ∗Top 15 enriched GO BP terms are showed in the bar plot of each disease state in each tissue. Each row represents a significant GO biological process which is colored according to the -log10(p.adjust). |
| Page: 1 2 3 4 5 6 7 8 9 |
| GO ID | Tissue | Disease Stage | Description | Gene Ratio | Bg Ratio | pvalue | p.adjust | Count |
| GO:1901654111 | Esophagus | ESCC | response to ketone | 118/8552 | 194/18723 | 1.45e-05 | 1.31e-04 | 118 |
| GO:19016556 | Esophagus | ESCC | cellular response to ketone | 59/8552 | 96/18723 | 1.32e-03 | 6.30e-03 | 59 |
| GO:0097305111 | Esophagus | ESCC | response to alcohol | 138/8552 | 253/18723 | 2.70e-03 | 1.14e-02 | 138 |
| GO:190165419 | Oral cavity | OSCC | response to ketone | 114/7305 | 194/18723 | 1.82e-08 | 3.60e-07 | 114 |
| GO:19016555 | Oral cavity | OSCC | cellular response to ketone | 56/7305 | 96/18723 | 9.61e-05 | 7.25e-04 | 56 |
| GO:009730519 | Oral cavity | OSCC | response to alcohol | 127/7305 | 253/18723 | 1.81e-04 | 1.24e-03 | 127 |
| GO:190165424 | Oral cavity | EOLP | response to ketone | 45/2218 | 194/18723 | 6.38e-06 | 1.24e-04 | 45 |
| GO:009730525 | Oral cavity | EOLP | response to alcohol | 53/2218 | 253/18723 | 2.31e-05 | 3.50e-04 | 53 |
| GO:190165513 | Oral cavity | EOLP | cellular response to ketone | 25/2218 | 96/18723 | 9.99e-05 | 1.14e-03 | 25 |
| GO:0071380 | Oral cavity | EOLP | cellular response to prostaglandin E stimulus | 7/2218 | 15/18723 | 8.78e-04 | 6.75e-03 | 7 |
| GO:00973063 | Oral cavity | EOLP | cellular response to alcohol | 20/2218 | 93/18723 | 5.62e-03 | 2.90e-02 | 20 |
| GO:0071379 | Oral cavity | EOLP | cellular response to prostaglandin stimulus | 7/2218 | 20/18723 | 6.20e-03 | 3.09e-02 | 7 |
| GO:190165432 | Oral cavity | NEOLP | response to ketone | 37/2005 | 194/18723 | 3.52e-04 | 3.38e-03 | 37 |
| GO:009730532 | Oral cavity | NEOLP | response to alcohol | 43/2005 | 253/18723 | 1.50e-03 | 1.06e-02 | 43 |
| GO:009730612 | Oral cavity | NEOLP | cellular response to alcohol | 19/2005 | 93/18723 | 4.12e-03 | 2.33e-02 | 19 |
| Page: 1 |
| Pathway ID | Tissue | Disease Stage | Description | Gene Ratio | Bg Ratio | pvalue | p.adjust | qvalue | Count |
| hsa05170210 | Esophagus | ESCC | Human immunodeficiency virus 1 infection | 147/4205 | 212/8465 | 3.37e-09 | 3.53e-08 | 1.81e-08 | 147 |
| hsa05167211 | Esophagus | ESCC | Kaposi sarcoma-associated herpesvirus infection | 136/4205 | 194/8465 | 4.28e-09 | 4.22e-08 | 2.16e-08 | 136 |
| hsa05163210 | Esophagus | ESCC | Human cytomegalovirus infection | 148/4205 | 225/8465 | 5.73e-07 | 4.00e-06 | 2.05e-06 | 148 |
| hsa049268 | Esophagus | ESCC | Relaxin signaling pathway | 81/4205 | 129/8465 | 1.72e-03 | 5.09e-03 | 2.61e-03 | 81 |
| hsa041517 | Esophagus | ESCC | PI3K-Akt signaling pathway | 197/4205 | 354/8465 | 1.24e-02 | 2.83e-02 | 1.45e-02 | 197 |
| hsa0517038 | Esophagus | ESCC | Human immunodeficiency virus 1 infection | 147/4205 | 212/8465 | 3.37e-09 | 3.53e-08 | 1.81e-08 | 147 |
| hsa0516738 | Esophagus | ESCC | Kaposi sarcoma-associated herpesvirus infection | 136/4205 | 194/8465 | 4.28e-09 | 4.22e-08 | 2.16e-08 | 136 |
| hsa0516338 | Esophagus | ESCC | Human cytomegalovirus infection | 148/4205 | 225/8465 | 5.73e-07 | 4.00e-06 | 2.05e-06 | 148 |
| hsa0492616 | Esophagus | ESCC | Relaxin signaling pathway | 81/4205 | 129/8465 | 1.72e-03 | 5.09e-03 | 2.61e-03 | 81 |
| hsa0415114 | Esophagus | ESCC | PI3K-Akt signaling pathway | 197/4205 | 354/8465 | 1.24e-02 | 2.83e-02 | 1.45e-02 | 197 |
| hsa0516729 | Oral cavity | OSCC | Kaposi sarcoma-associated herpesvirus infection | 125/3704 | 194/8465 | 3.67e-09 | 3.84e-08 | 1.96e-08 | 125 |
| hsa0517027 | Oral cavity | OSCC | Human immunodeficiency virus 1 infection | 133/3704 | 212/8465 | 1.42e-08 | 1.40e-07 | 7.12e-08 | 133 |
| hsa0516328 | Oral cavity | OSCC | Human cytomegalovirus infection | 139/3704 | 225/8465 | 2.77e-08 | 2.38e-07 | 1.21e-07 | 139 |
| hsa041516 | Oral cavity | OSCC | PI3K-Akt signaling pathway | 185/3704 | 354/8465 | 6.26e-04 | 1.86e-03 | 9.49e-04 | 185 |
| hsa049267 | Oral cavity | OSCC | Relaxin signaling pathway | 74/3704 | 129/8465 | 1.20e-03 | 3.37e-03 | 1.72e-03 | 74 |
| hsa05167113 | Oral cavity | OSCC | Kaposi sarcoma-associated herpesvirus infection | 125/3704 | 194/8465 | 3.67e-09 | 3.84e-08 | 1.96e-08 | 125 |
| hsa05170111 | Oral cavity | OSCC | Human immunodeficiency virus 1 infection | 133/3704 | 212/8465 | 1.42e-08 | 1.40e-07 | 7.12e-08 | 133 |
| hsa05163112 | Oral cavity | OSCC | Human cytomegalovirus infection | 139/3704 | 225/8465 | 2.77e-08 | 2.38e-07 | 1.21e-07 | 139 |
| hsa0415113 | Oral cavity | OSCC | PI3K-Akt signaling pathway | 185/3704 | 354/8465 | 6.26e-04 | 1.86e-03 | 9.49e-04 | 185 |
| hsa0492615 | Oral cavity | OSCC | Relaxin signaling pathway | 74/3704 | 129/8465 | 1.20e-03 | 3.37e-03 | 1.72e-03 | 74 |
| Page: 1 2 3 |
Top |
Cell-cell communication analysis |
| Identification of potential cell-cell interactions between two cell types and their ligand-receptor pairs for different disease states |
| Ligand | Receptor | LRpair | Pathway | Tissue | Disease Stage |
| Page: 1 |
Top |
Single-cell gene regulatory network inference analysis |
| Find out the significant the regulons (TFs) and the target genes of each regulon across cell types for different disease states |
| TF | Cell Type | Tissue | Disease Stage | Target Gene | RSS | Regulon Activity |
| ∗The dot plots of a searched regulon are shown for all cell subpopulations in each disease state of each tissue based on the regulon specific score inferred using pySCENIC and by calculating the average expression. |
| Page: 1 |
Top |
Somatic mutation of malignant transformation related genes |
| Annotation of somatic variants for genes involved in malignant transformation |
| Hugo Symbol | Variant Class | Variant Classification | dbSNP RS | HGVSc | HGVSp | HGVSp Short | SWISSPROT | BIOTYPE | SIFT | PolyPhen | Tumor Sample Barcode | Tissue | Histology | Sex | Age | Stage | Therapy Types | Drugs | Outcome |
| GNG2 | SNV | Missense_Mutation | novel | c.157C>G | p.Pro53Ala | p.P53A | P59768 | protein_coding | tolerated(0.23) | probably_damaging(0.999) | TCGA-XX-A89A-01 | Breast | breast invasive carcinoma | Female | >=65 | I/II | Unknown | Unknown | SD |
| GNG2 | SNV | Missense_Mutation | c.101N>T | p.Ala34Val | p.A34V | P59768 | protein_coding | deleterious(0.02) | possibly_damaging(0.698) | TCGA-B5-A1MX-01 | Endometrium | uterine corpus endometrioid carcinoma | Female | <65 | I/II | Hormone Therapy | megace | SD | |
| GNG2 | SNV | Missense_Mutation | c.106G>T | p.Asp36Tyr | p.D36Y | P59768 | protein_coding | deleterious(0) | probably_damaging(0.977) | TCGA-BS-A0UF-01 | Endometrium | uterine corpus endometrioid carcinoma | Female | >=65 | I/II | Unknown | Unknown | SD | |
| GNG2 | SNV | Missense_Mutation | c.179N>T | p.Pro60Leu | p.P60L | P59768 | protein_coding | deleterious(0.02) | probably_damaging(0.999) | TCGA-D1-A16Y-01 | Endometrium | uterine corpus endometrioid carcinoma | Female | <65 | I/II | Unknown | Unknown | SD | |
| GNG2 | SNV | Missense_Mutation | novel | c.199N>G | p.Phe67Val | p.F67V | P59768 | protein_coding | tolerated(0.54) | benign(0.433) | TCGA-EO-A3B0-01 | Endometrium | uterine corpus endometrioid carcinoma | Female | <65 | III/IV | Unknown | Unknown | SD |
| GNG2 | SNV | Missense_Mutation | rs139067662 | c.164N>T | p.Pro55Leu | p.P55L | P59768 | protein_coding | deleterious(0.02) | probably_damaging(0.999) | TCGA-38-4631-01 | Lung | lung adenocarcinoma | Female | >=65 | I/II | Unknown | Unknown | PD |
| GNG2 | SNV | Missense_Mutation | novel | c.195N>T | p.Lys65Asn | p.K65N | P59768 | protein_coding | deleterious(0.03) | possibly_damaging(0.447) | TCGA-49-4514-01 | Lung | lung adenocarcinoma | Female | >=65 | I/II | Unknown | Unknown | SD |
| GNG2 | SNV | Missense_Mutation | novel | c.78C>A | p.Asp26Glu | p.D26E | P59768 | protein_coding | tolerated(1) | benign(0.011) | TCGA-78-7155-01 | Lung | lung adenocarcinoma | Male | >=65 | I/II | Chemotherapy | carboplatin | PD |
| GNG2 | SNV | Missense_Mutation | c.81G>C | p.Arg27Ser | p.R27S | P59768 | protein_coding | deleterious(0.01) | possibly_damaging(0.596) | TCGA-99-8025-01 | Lung | lung adenocarcinoma | Female | >=65 | III/IV | Chemotherapy | gemzar | SD | |
| GNG2 | SNV | Missense_Mutation | novel | c.140A>G | p.Glu47Gly | p.E47G | P59768 | protein_coding | tolerated(0.08) | possibly_damaging(0.575) | TCGA-56-7730-01 | Lung | lung squamous cell carcinoma | Male | >=65 | I/II | Chemotherapy | unknown | PD |
| Page: 1 2 |
Top |
Related drugs of malignant transformation related genes |
| Identification of chemicals and drugs interact with genes involved in malignant transfromation |
| (DGIdb 4.0) |
| Entrez ID | Symbol | Category | Interaction Types | Drug Claim Name | Drug Name | PMIDs |
| Page: 1 |

Copyright 2023-Present -The University of Texas Health Science Center at Houston |