
|
|||||
|
 | |
| |
| |
| |
| |
| |
|
Gene: GNG11 |
Gene summary for GNG11 |
| Gene information | Species | Human | Gene symbol | GNG11 | Gene ID | 2791 |
| Gene name | G protein subunit gamma 11 | |
| Gene Alias | GNGT11 | |
| Cytomap | 7q21.3 | |
| Gene Type | protein-coding | GO ID | GO:0007154 | UniProtAcc | P61952 |
Top |
Malignant transformation analysis |
| Identification of the aberrant gene expression in precancerous and cancerous lesions by comparing the gene expression of stem-like cells in diseased tissues with normal stem cells |
| Entrez ID | Symbol | Replicates | Species | Organ | Tissue | Adj P-value | Log2FC | Malignancy |
| 2791 | GNG11 | AEH-subject1 | Human | Endometrium | AEH | 9.79e-24 | -5.24e-01 | -0.3059 |
| 2791 | GNG11 | AEH-subject2 | Human | Endometrium | AEH | 1.56e-19 | -4.77e-01 | -0.2525 |
| 2791 | GNG11 | AEH-subject3 | Human | Endometrium | AEH | 5.12e-07 | -3.07e-01 | -0.2576 |
| 2791 | GNG11 | AEH-subject4 | Human | Endometrium | AEH | 7.10e-08 | -3.80e-01 | -0.2657 |
| 2791 | GNG11 | AEH-subject5 | Human | Endometrium | AEH | 8.43e-14 | -4.44e-01 | -0.2953 |
| 2791 | GNG11 | EEC-subject1 | Human | Endometrium | EEC | 2.66e-26 | -5.57e-01 | -0.2682 |
| 2791 | GNG11 | EEC-subject2 | Human | Endometrium | EEC | 7.07e-37 | -6.29e-01 | -0.2607 |
| 2791 | GNG11 | EEC-subject3 | Human | Endometrium | EEC | 8.33e-35 | -4.79e-01 | -0.2525 |
| 2791 | GNG11 | EEC-subject4 | Human | Endometrium | EEC | 6.46e-04 | -2.20e-01 | -0.2571 |
| 2791 | GNG11 | EEC-subject5 | Human | Endometrium | EEC | 3.72e-15 | -4.23e-01 | -0.249 |
| 2791 | GNG11 | GSM5276934 | Human | Endometrium | EEC | 5.22e-07 | -3.63e-01 | -0.0913 |
| 2791 | GNG11 | GSM5276937 | Human | Endometrium | EEC | 6.31e-03 | -2.54e-01 | -0.0897 |
| 2791 | GNG11 | GSM6177620_NYU_UCEC1_lib1_lib1 | Human | Endometrium | EEC | 1.08e-34 | -6.61e-01 | -0.1869 |
| 2791 | GNG11 | GSM6177620_NYU_UCEC1_lib2_lib2 | Human | Endometrium | EEC | 4.28e-31 | -6.61e-01 | -0.1875 |
| 2791 | GNG11 | GSM6177620_NYU_UCEC1_lib3_lib3 | Human | Endometrium | EEC | 3.10e-33 | -6.46e-01 | -0.1883 |
| 2791 | GNG11 | GSM6177621_NYU_UCEC2_lib1_lib1 | Human | Endometrium | EEC | 1.62e-39 | -6.22e-01 | -0.1934 |
| 2791 | GNG11 | GSM6177622_NYU_UCEC3_lib1_lib1 | Human | Endometrium | EEC | 3.56e-47 | -6.61e-01 | -0.1917 |
| 2791 | GNG11 | GSM6177622_NYU_UCEC3_lib2_lib2 | Human | Endometrium | EEC | 1.05e-45 | -6.61e-01 | -0.1916 |
| 2791 | GNG11 | GSM6177623_NYU_UCEC3_Vis | Human | Endometrium | EEC | 7.22e-13 | -3.99e-01 | -0.1269 |
| 2791 | GNG11 | P11T-E | Human | Esophagus | ESCC | 3.11e-06 | 5.16e-01 | 0.1426 |
| Page: 1 2 3 |
| Tissue | Expression Dynamics | Abbreviation |
| Endometrium | 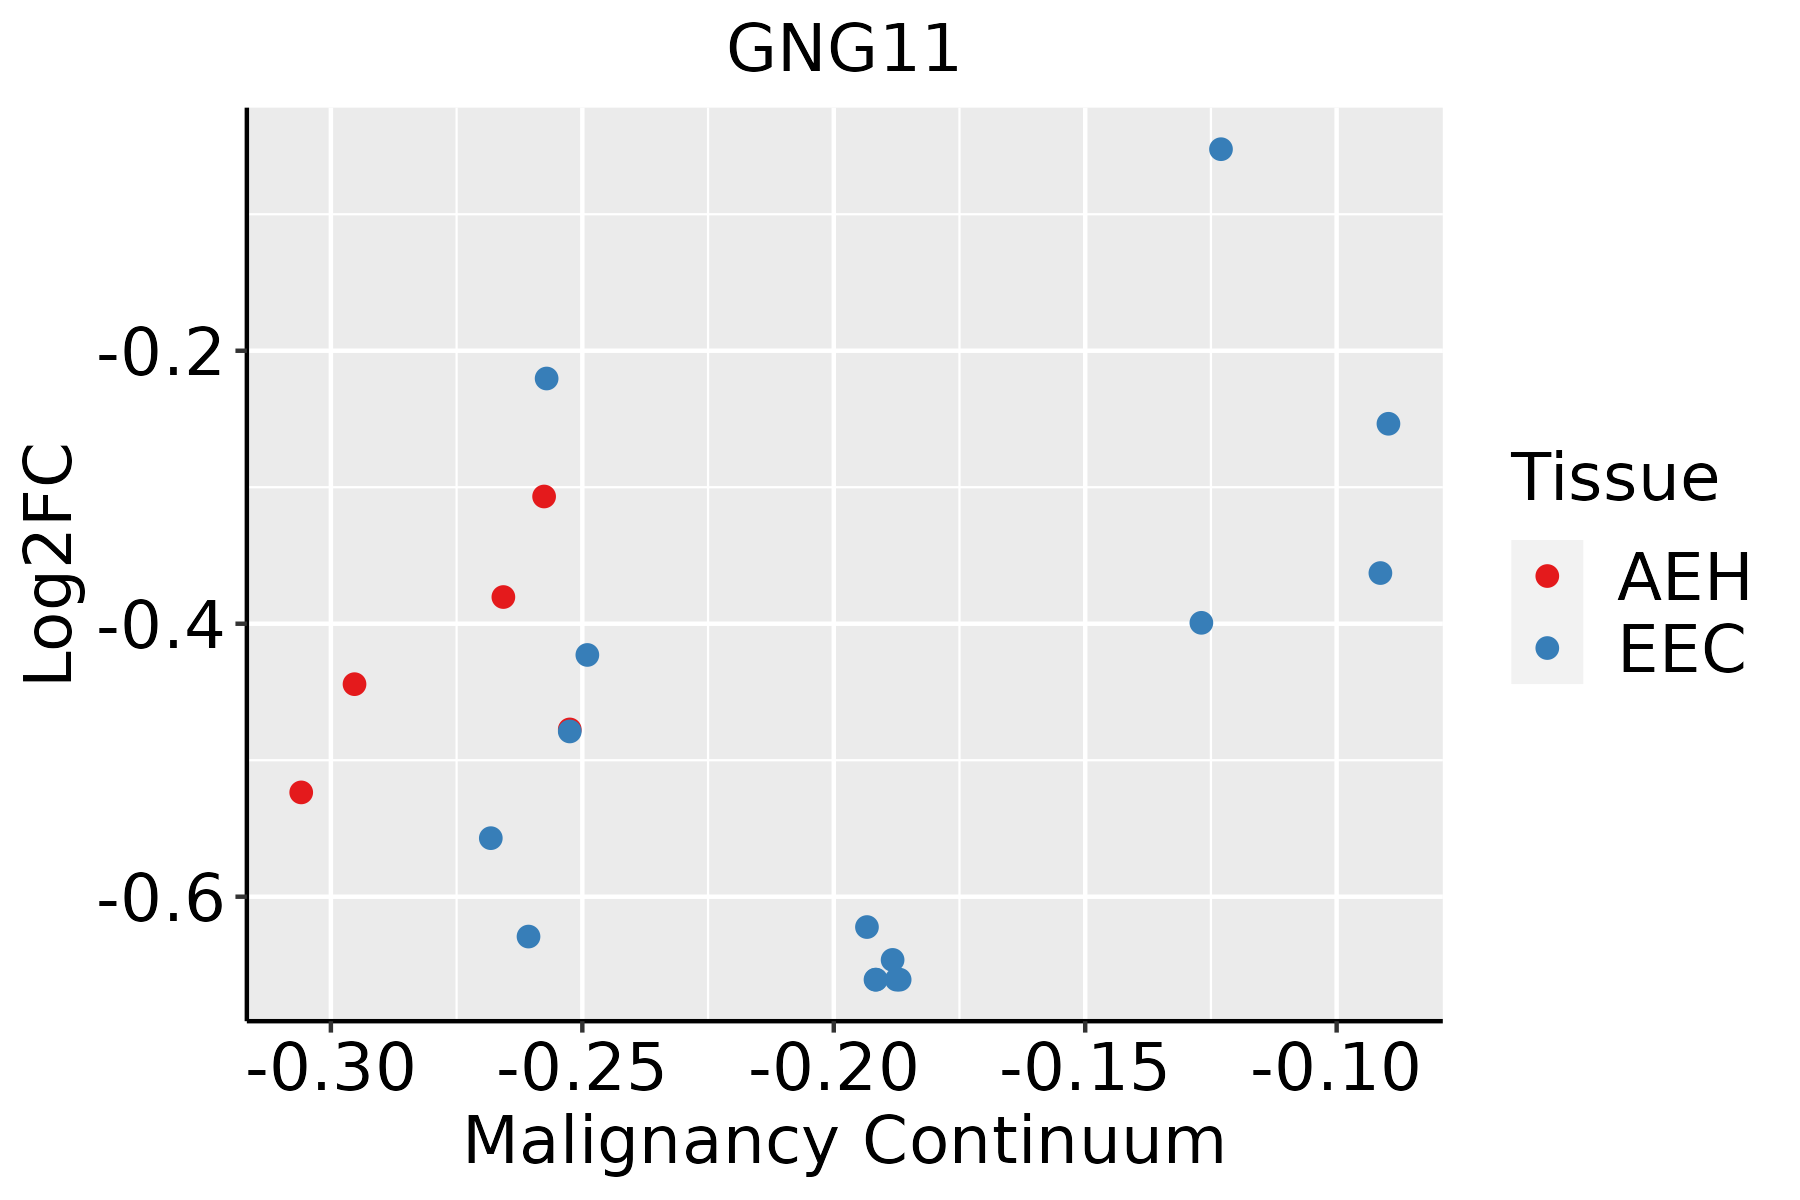 | AEH: Atypical endometrial hyperplasia |
| EEC: Endometrioid Cancer | ||
| Esophagus | 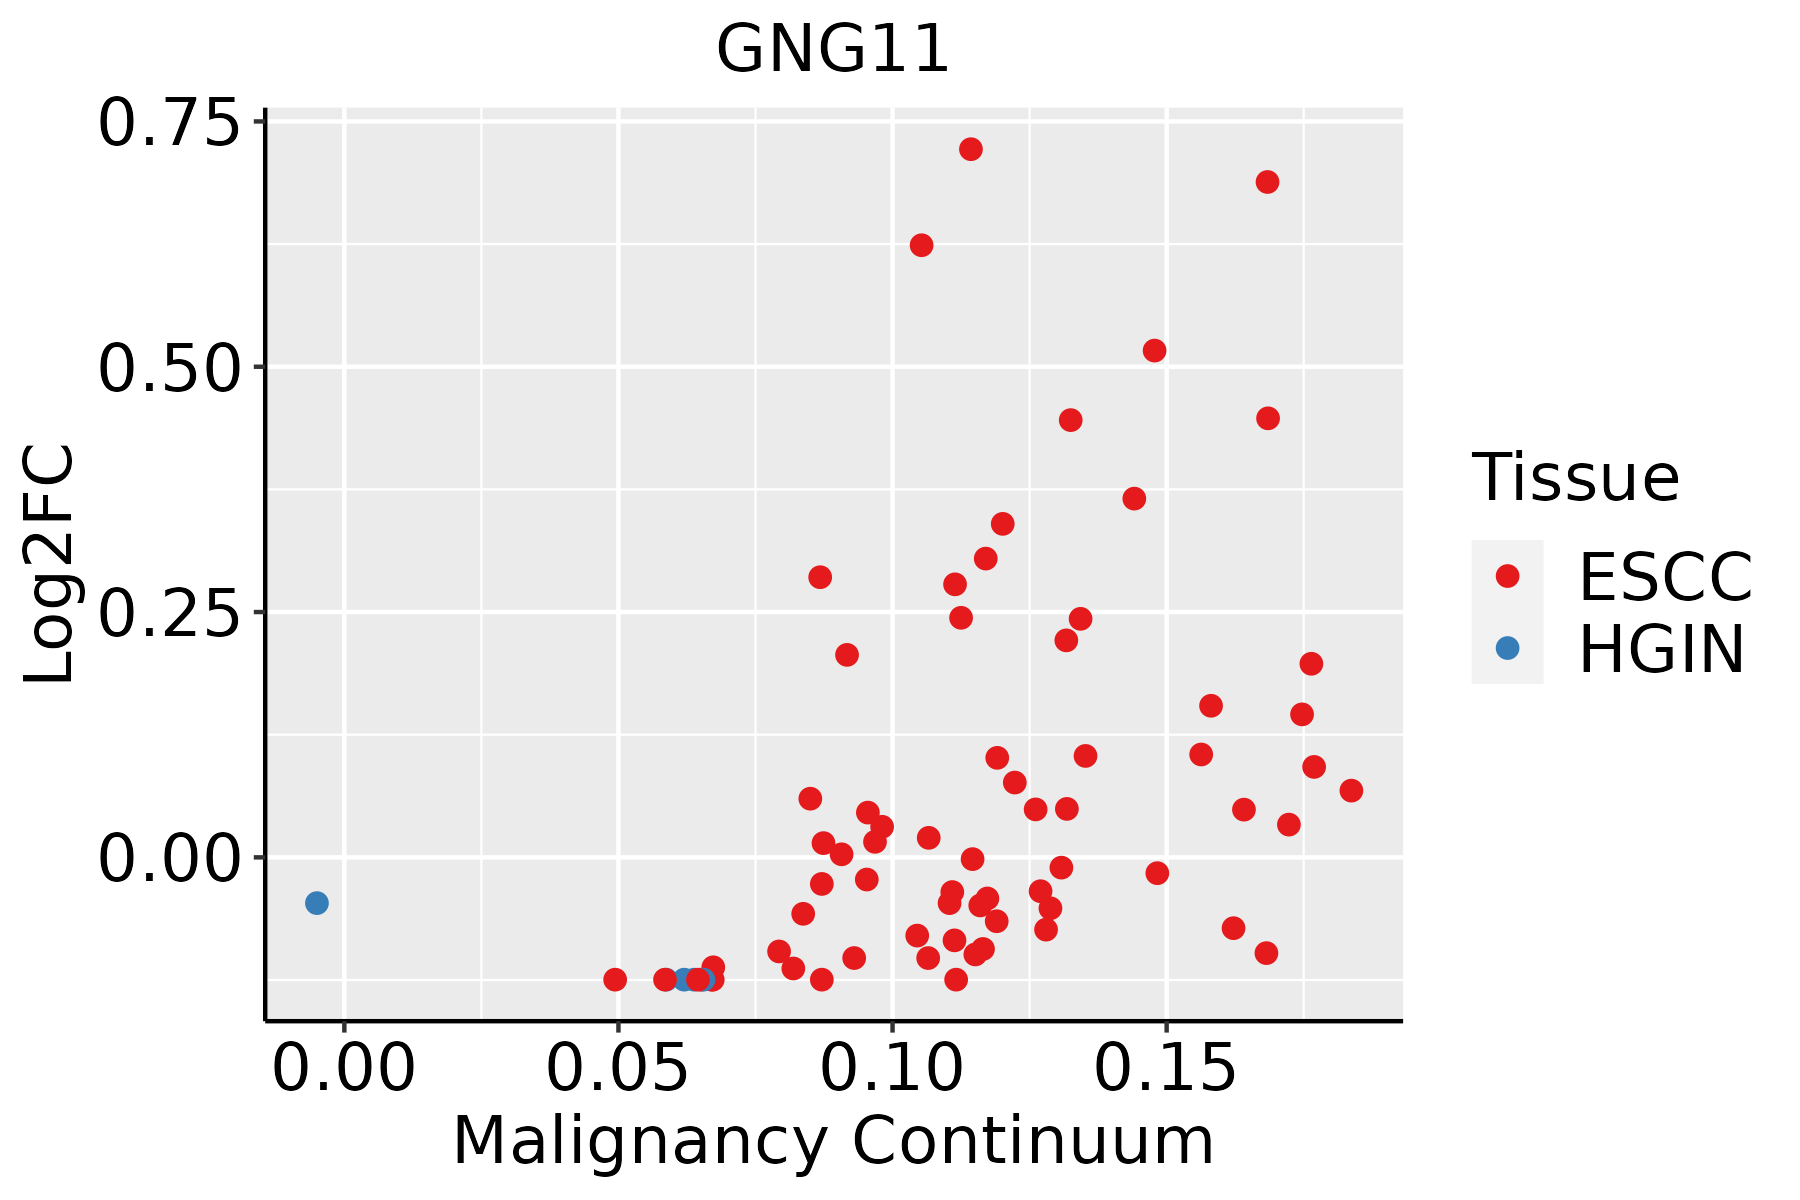 | ESCC: Esophageal squamous cell carcinoma |
| HGIN: High-grade intraepithelial neoplasias | ||
| LGIN: Low-grade intraepithelial neoplasias | ||
| Oral Cavity | 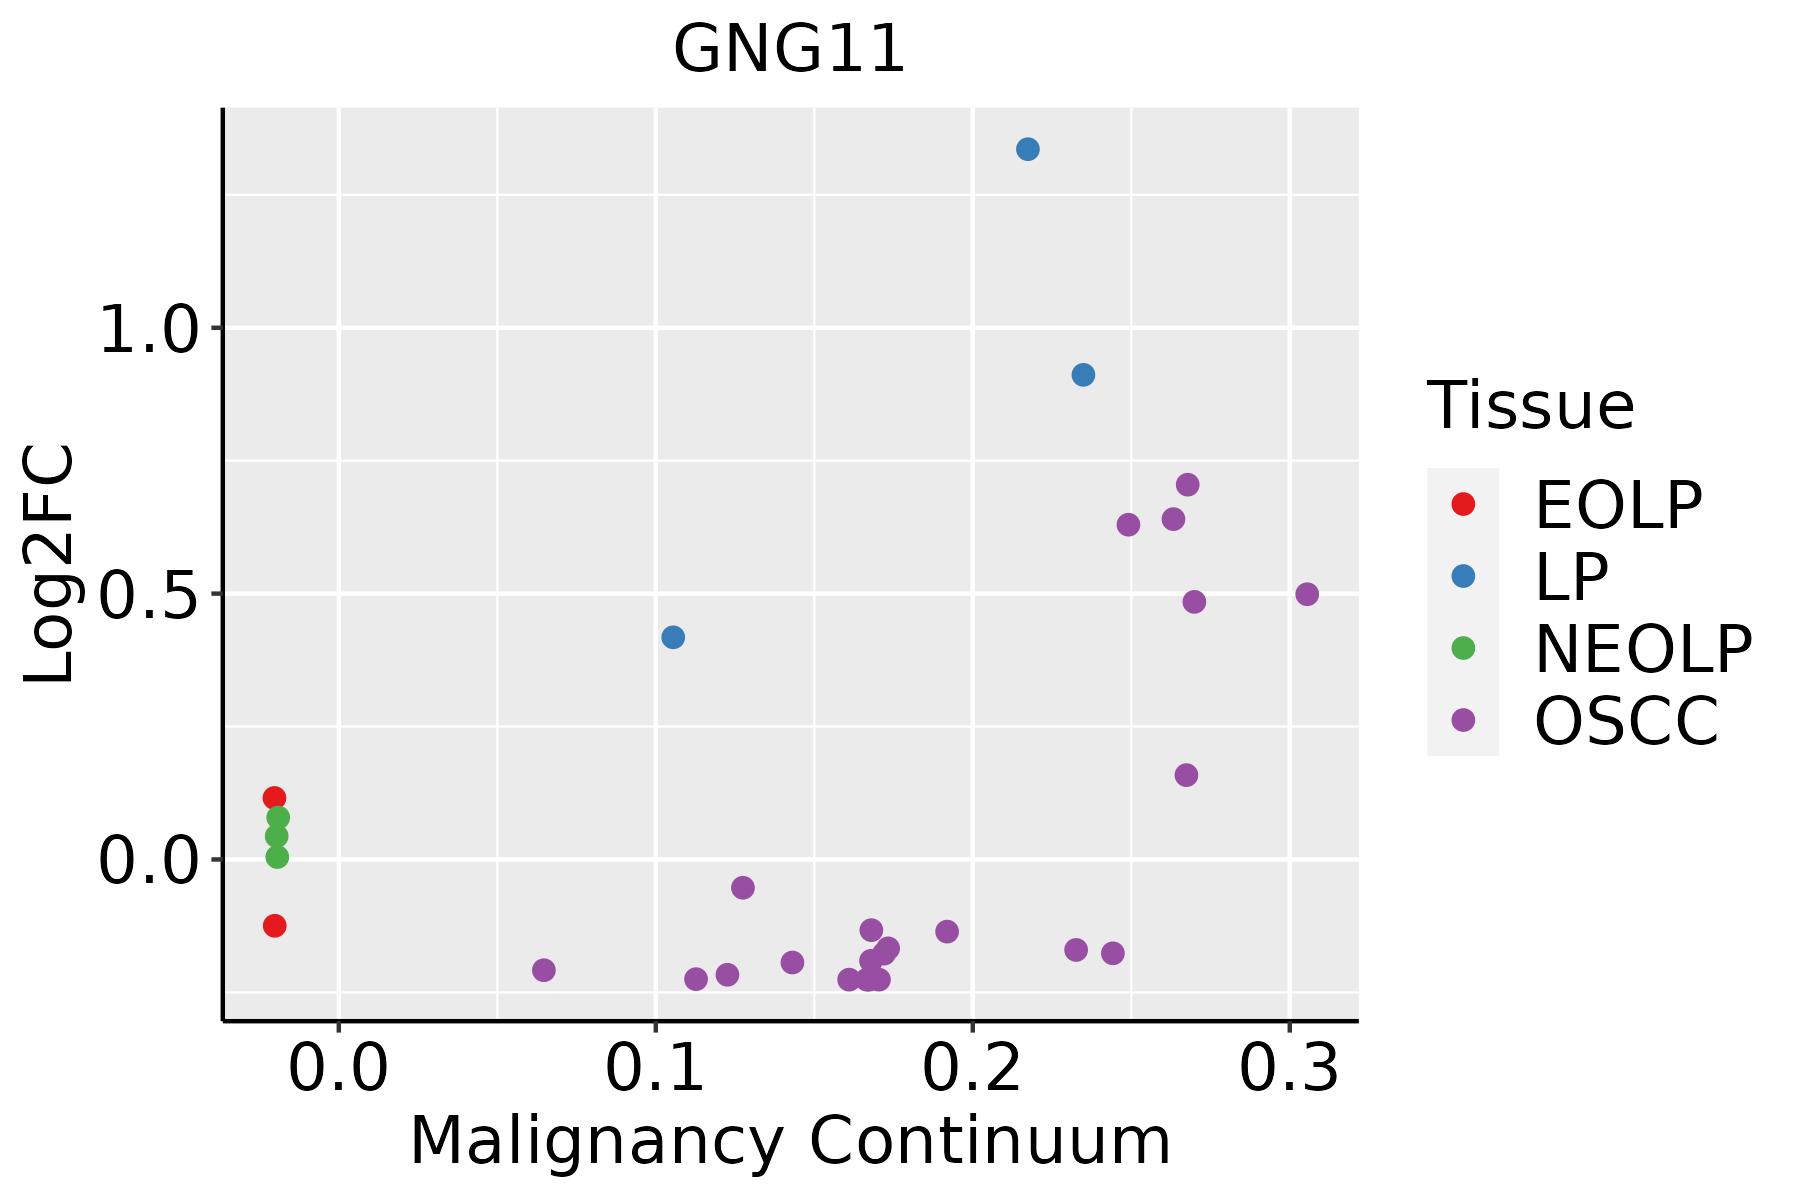 | EOLP: Erosive Oral lichen planus |
| LP: leukoplakia | ||
| NEOLP: Non-erosive oral lichen planus | ||
| OSCC: Oral squamous cell carcinoma | ||
| Skin |  | AK: Actinic keratosis |
| cSCC: Cutaneous squamous cell carcinoma | ||
| SCCIS:squamous cell carcinoma in situ | ||
| Thyroid | 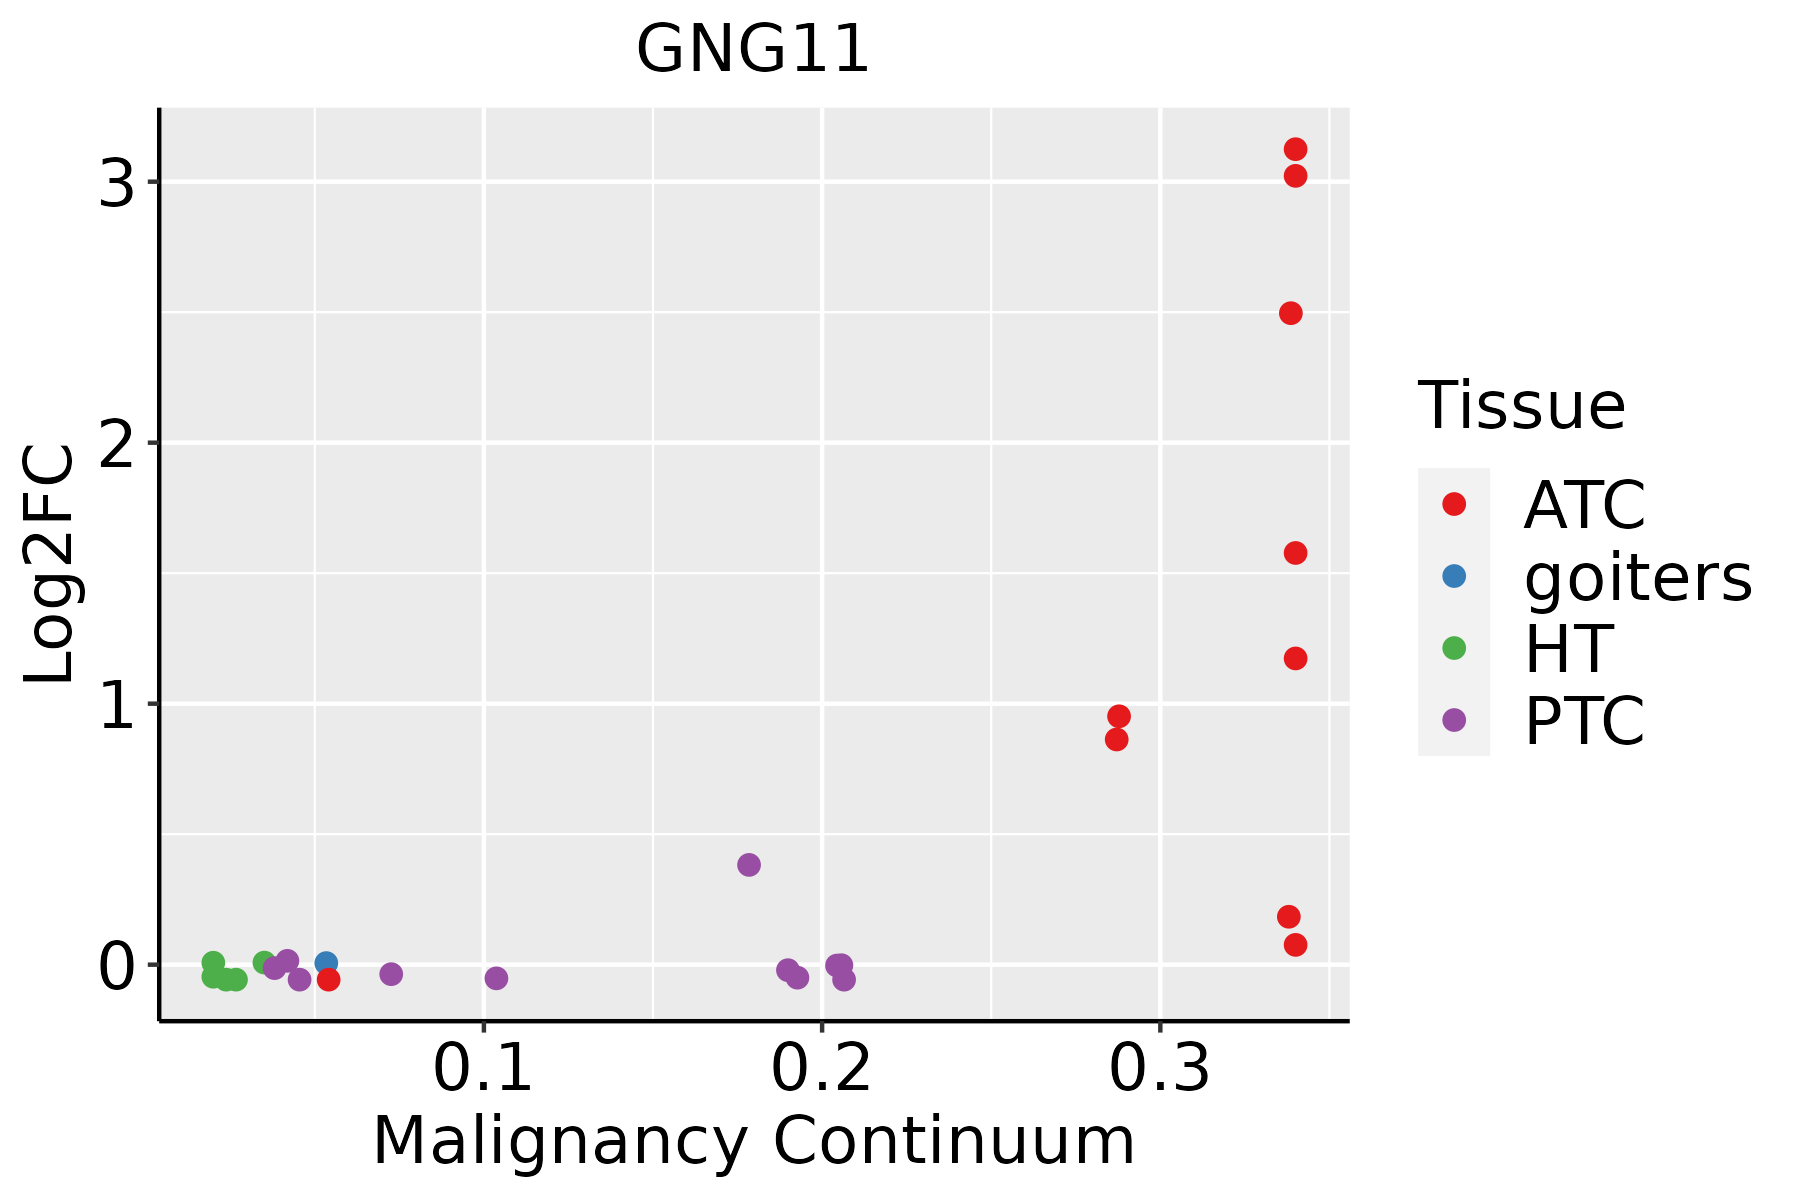 | ATC: Anaplastic thyroid cancer |
| HT: Hashimoto's thyroiditis | ||
| PTC: Papillary thyroid cancer |
| ∗log2FC in expression of this searched gene in stem-like cells from each diseased tissue sample relative to stem-like cells in normal samples in each tissue plotted against the malignancy continuum. Samples are colored based on if they are from different disease stage. |
Top |
Malignant transformation related pathway analysis |
| Find out the enriched GO biological processes and KEGG pathways involved in transition from healthy to precancer to cancer |
| Tissue | Disease Stage | Enriched GO biological Processes |
| Colorectum | AD |  |
| Colorectum | SER |  |
| Colorectum | MSS |  |
| Colorectum | MSI-H |  |
| Colorectum | FAP |  |
| ∗Top 15 enriched GO BP terms are showed in the bar plot of each disease state in each tissue. Each row represents a significant GO biological process which is colored according to the -log10(p.adjust). |
| Page: 1 2 3 4 5 6 7 8 9 |
| GO ID | Tissue | Disease Stage | Description | Gene Ratio | Bg Ratio | pvalue | p.adjust | Count |
| Page: 1 |
| Pathway ID | Tissue | Disease Stage | Description | Gene Ratio | Bg Ratio | pvalue | p.adjust | qvalue | Count |
| hsa0472320 | Endometrium | AEH | Retrograde endocannabinoid signaling | 39/1197 | 148/8465 | 5.89e-05 | 5.80e-04 | 4.24e-04 | 39 |
| hsa0516725 | Endometrium | AEH | Kaposi sarcoma-associated herpesvirus infection | 44/1197 | 194/8465 | 7.97e-04 | 5.28e-03 | 3.87e-03 | 44 |
| hsa0517018 | Endometrium | AEH | Human immunodeficiency virus 1 infection | 43/1197 | 212/8465 | 8.19e-03 | 4.22e-02 | 3.09e-02 | 43 |
| hsa0516320 | Endometrium | AEH | Human cytomegalovirus infection | 45/1197 | 225/8465 | 8.98e-03 | 4.56e-02 | 3.34e-02 | 45 |
| hsa04723110 | Endometrium | AEH | Retrograde endocannabinoid signaling | 39/1197 | 148/8465 | 5.89e-05 | 5.80e-04 | 4.24e-04 | 39 |
| hsa05167111 | Endometrium | AEH | Kaposi sarcoma-associated herpesvirus infection | 44/1197 | 194/8465 | 7.97e-04 | 5.28e-03 | 3.87e-03 | 44 |
| hsa0517019 | Endometrium | AEH | Human immunodeficiency virus 1 infection | 43/1197 | 212/8465 | 8.19e-03 | 4.22e-02 | 3.09e-02 | 43 |
| hsa05163110 | Endometrium | AEH | Human cytomegalovirus infection | 45/1197 | 225/8465 | 8.98e-03 | 4.56e-02 | 3.34e-02 | 45 |
| hsa0472324 | Endometrium | EEC | Retrograde endocannabinoid signaling | 39/1237 | 148/8465 | 1.22e-04 | 1.18e-03 | 8.78e-04 | 39 |
| hsa0516726 | Endometrium | EEC | Kaposi sarcoma-associated herpesvirus infection | 45/1237 | 194/8465 | 8.55e-04 | 5.86e-03 | 4.37e-03 | 45 |
| hsa0516325 | Endometrium | EEC | Human cytomegalovirus infection | 47/1237 | 225/8465 | 6.17e-03 | 3.12e-02 | 2.33e-02 | 47 |
| hsa0517025 | Endometrium | EEC | Human immunodeficiency virus 1 infection | 44/1237 | 212/8465 | 8.86e-03 | 4.05e-02 | 3.02e-02 | 44 |
| hsa0472334 | Endometrium | EEC | Retrograde endocannabinoid signaling | 39/1237 | 148/8465 | 1.22e-04 | 1.18e-03 | 8.78e-04 | 39 |
| hsa0516735 | Endometrium | EEC | Kaposi sarcoma-associated herpesvirus infection | 45/1237 | 194/8465 | 8.55e-04 | 5.86e-03 | 4.37e-03 | 45 |
| hsa0516335 | Endometrium | EEC | Human cytomegalovirus infection | 47/1237 | 225/8465 | 6.17e-03 | 3.12e-02 | 2.33e-02 | 47 |
| hsa0517035 | Endometrium | EEC | Human immunodeficiency virus 1 infection | 44/1237 | 212/8465 | 8.86e-03 | 4.05e-02 | 3.02e-02 | 44 |
| hsa049268 | Esophagus | ESCC | Relaxin signaling pathway | 81/4205 | 129/8465 | 1.72e-03 | 5.09e-03 | 2.61e-03 | 81 |
| hsa041517 | Esophagus | ESCC | PI3K-Akt signaling pathway | 197/4205 | 354/8465 | 1.24e-02 | 2.83e-02 | 1.45e-02 | 197 |
| hsa0492616 | Esophagus | ESCC | Relaxin signaling pathway | 81/4205 | 129/8465 | 1.72e-03 | 5.09e-03 | 2.61e-03 | 81 |
| hsa0415114 | Esophagus | ESCC | PI3K-Akt signaling pathway | 197/4205 | 354/8465 | 1.24e-02 | 2.83e-02 | 1.45e-02 | 197 |
| Page: 1 2 |
Top |
Cell-cell communication analysis |
| Identification of potential cell-cell interactions between two cell types and their ligand-receptor pairs for different disease states |
| Ligand | Receptor | LRpair | Pathway | Tissue | Disease Stage |
| Page: 1 |
Top |
Single-cell gene regulatory network inference analysis |
| Find out the significant the regulons (TFs) and the target genes of each regulon across cell types for different disease states |
| TF | Cell Type | Tissue | Disease Stage | Target Gene | RSS | Regulon Activity |
| ∗The dot plots of a searched regulon are shown for all cell subpopulations in each disease state of each tissue based on the regulon specific score inferred using pySCENIC and by calculating the average expression. |
| Page: 1 |
Top |
Somatic mutation of malignant transformation related genes |
| Annotation of somatic variants for genes involved in malignant transformation |
| Hugo Symbol | Variant Class | Variant Classification | dbSNP RS | HGVSc | HGVSp | HGVSp Short | SWISSPROT | BIOTYPE | SIFT | PolyPhen | Tumor Sample Barcode | Tissue | Histology | Sex | Age | Stage | Therapy Types | Drugs | Outcome |
| GNG11 | insertion | Frame_Shift_Ins | novel | c.61_62insGTACTCCTTTTCCT | p.Gln21ArgfsTer11 | p.Q21Rfs*11 | P61952 | protein_coding | TCGA-A7-A0CJ-01 | Breast | breast invasive carcinoma | Female | <65 | I/II | Chemotherapy | cytoxan | SD | ||
| GNG11 | SNV | Missense_Mutation | c.5C>A | p.Pro2His | p.P2H | P61952 | protein_coding | deleterious_low_confidence(0) | probably_damaging(0.997) | TCGA-AZ-6601-01 | Colorectum | colon adenocarcinoma | Male | >=65 | I/II | Unknown | Unknown | PD | |
| GNG11 | SNV | Missense_Mutation | c.18C>G | p.Ile6Met | p.I6M | P61952 | protein_coding | tolerated(0.41) | possibly_damaging(0.759) | TCGA-AF-3911-01 | Colorectum | rectum adenocarcinoma | Male | <65 | III/IV | Chemotherapy | 5-fu | PD | |
| GNG11 | SNV | Missense_Mutation | novel | c.19G>A | p.Glu7Lys | p.E7K | P61952 | protein_coding | deleterious(0.04) | possibly_damaging(0.456) | TCGA-F5-6814-01 | Colorectum | rectum adenocarcinoma | Male | <65 | I/II | Unknown | Unknown | SD |
| GNG11 | SNV | Missense_Mutation | novel | c.22G>T | p.Asp8Tyr | p.D8Y | P61952 | protein_coding | deleterious(0) | probably_damaging(0.994) | TCGA-AX-A2HC-01 | Endometrium | uterine corpus endometrioid carcinoma | Female | <65 | III/IV | Chemotherapy | paclitaxel | PD |
| GNG11 | SNV | Missense_Mutation | novel | c.40N>G | p.Lys14Glu | p.K14E | P61952 | protein_coding | tolerated(0.25) | possibly_damaging(0.844) | TCGA-EO-A22R-01 | Endometrium | uterine corpus endometrioid carcinoma | Female | <65 | I/II | Unknown | Unknown | SD |
| GNG11 | SNV | Missense_Mutation | c.203N>T | p.Gly68Val | p.G68V | P61952 | protein_coding | deleterious(0) | probably_damaging(0.941) | TCGA-05-4430-01 | Lung | lung adenocarcinoma | Female | <65 | I/II | Unknown | Unknown | SD | |
| GNG11 | SNV | Missense_Mutation | c.143N>A | p.Ser48Tyr | p.S48Y | P61952 | protein_coding | deleterious(0) | possibly_damaging(0.663) | TCGA-50-6592-01 | Lung | lung adenocarcinoma | Female | >=65 | I/II | Unknown | Unknown | PD | |
| GNG11 | SNV | Missense_Mutation | c.68N>A | p.Arg23His | p.R23H | P61952 | protein_coding | deleterious(0) | possibly_damaging(0.839) | TCGA-21-1080-01 | Lung | lung squamous cell carcinoma | Male | >=65 | I/II | Unknown | Unknown | SD | |
| GNG11 | SNV | Missense_Mutation | novel | c.101C>G | p.Ser34Cys | p.S34C | P61952 | protein_coding | deleterious(0) | probably_damaging(0.997) | TCGA-33-AASI-01 | Lung | lung squamous cell carcinoma | Female | >=65 | I/II | Chemotherapy | taxotere | PD |
| Page: 1 2 |
Top |
Related drugs of malignant transformation related genes |
| Identification of chemicals and drugs interact with genes involved in malignant transfromation |
| (DGIdb 4.0) |
| Entrez ID | Symbol | Category | Interaction Types | Drug Claim Name | Drug Name | PMIDs |
| Page: 1 |

Copyright 2023-Present -The University of Texas Health Science Center at Houston |