
|
|||||
|
 | |
| |
| |
| |
| |
| |
|
Gene: GNB5 |
Gene summary for GNB5 |
| Gene information | Species | Human | Gene symbol | GNB5 | Gene ID | 10681 |
| Gene name | G protein subunit beta 5 | |
| Gene Alias | GB5 | |
| Cytomap | 15q21.2 | |
| Gene Type | protein-coding | GO ID | GO:0006810 | UniProtAcc | A0A024R5R9 |
Top |
Malignant transformation analysis |
| Identification of the aberrant gene expression in precancerous and cancerous lesions by comparing the gene expression of stem-like cells in diseased tissues with normal stem cells |
| Entrez ID | Symbol | Replicates | Species | Organ | Tissue | Adj P-value | Log2FC | Malignancy |
| 10681 | GNB5 | LZE2T | Human | Esophagus | ESCC | 6.35e-05 | 5.31e-01 | 0.082 |
| 10681 | GNB5 | LZE4T | Human | Esophagus | ESCC | 8.98e-11 | 4.62e-01 | 0.0811 |
| 10681 | GNB5 | LZE8T | Human | Esophagus | ESCC | 8.88e-07 | 1.57e-01 | 0.067 |
| 10681 | GNB5 | LZE20T | Human | Esophagus | ESCC | 4.78e-02 | 5.44e-02 | 0.0662 |
| 10681 | GNB5 | LZE22T | Human | Esophagus | ESCC | 1.01e-02 | 2.04e-01 | 0.068 |
| 10681 | GNB5 | LZE24T | Human | Esophagus | ESCC | 1.21e-02 | 1.22e-01 | 0.0596 |
| 10681 | GNB5 | LZE6T | Human | Esophagus | ESCC | 1.36e-03 | 1.59e-01 | 0.0845 |
| 10681 | GNB5 | P1T-E | Human | Esophagus | ESCC | 2.78e-06 | 2.37e-01 | 0.0875 |
| 10681 | GNB5 | P2T-E | Human | Esophagus | ESCC | 1.19e-11 | 2.18e-01 | 0.1177 |
| 10681 | GNB5 | P4T-E | Human | Esophagus | ESCC | 1.04e-21 | 4.63e-01 | 0.1323 |
| 10681 | GNB5 | P5T-E | Human | Esophagus | ESCC | 4.53e-11 | 1.94e-01 | 0.1327 |
| 10681 | GNB5 | P8T-E | Human | Esophagus | ESCC | 9.02e-24 | 3.68e-01 | 0.0889 |
| 10681 | GNB5 | P9T-E | Human | Esophagus | ESCC | 2.13e-10 | 4.03e-01 | 0.1131 |
| 10681 | GNB5 | P10T-E | Human | Esophagus | ESCC | 1.16e-25 | 4.87e-01 | 0.116 |
| 10681 | GNB5 | P11T-E | Human | Esophagus | ESCC | 4.49e-05 | 2.59e-01 | 0.1426 |
| 10681 | GNB5 | P12T-E | Human | Esophagus | ESCC | 1.24e-17 | 5.40e-01 | 0.1122 |
| 10681 | GNB5 | P15T-E | Human | Esophagus | ESCC | 6.42e-19 | 4.50e-01 | 0.1149 |
| 10681 | GNB5 | P16T-E | Human | Esophagus | ESCC | 5.15e-16 | 3.24e-01 | 0.1153 |
| 10681 | GNB5 | P20T-E | Human | Esophagus | ESCC | 4.71e-22 | 3.51e-01 | 0.1124 |
| 10681 | GNB5 | P21T-E | Human | Esophagus | ESCC | 2.36e-24 | 3.65e-01 | 0.1617 |
| Page: 1 2 3 4 5 6 |
| Tissue | Expression Dynamics | Abbreviation |
| Esophagus |  | ESCC: Esophageal squamous cell carcinoma |
| HGIN: High-grade intraepithelial neoplasias | ||
| LGIN: Low-grade intraepithelial neoplasias | ||
| Liver | 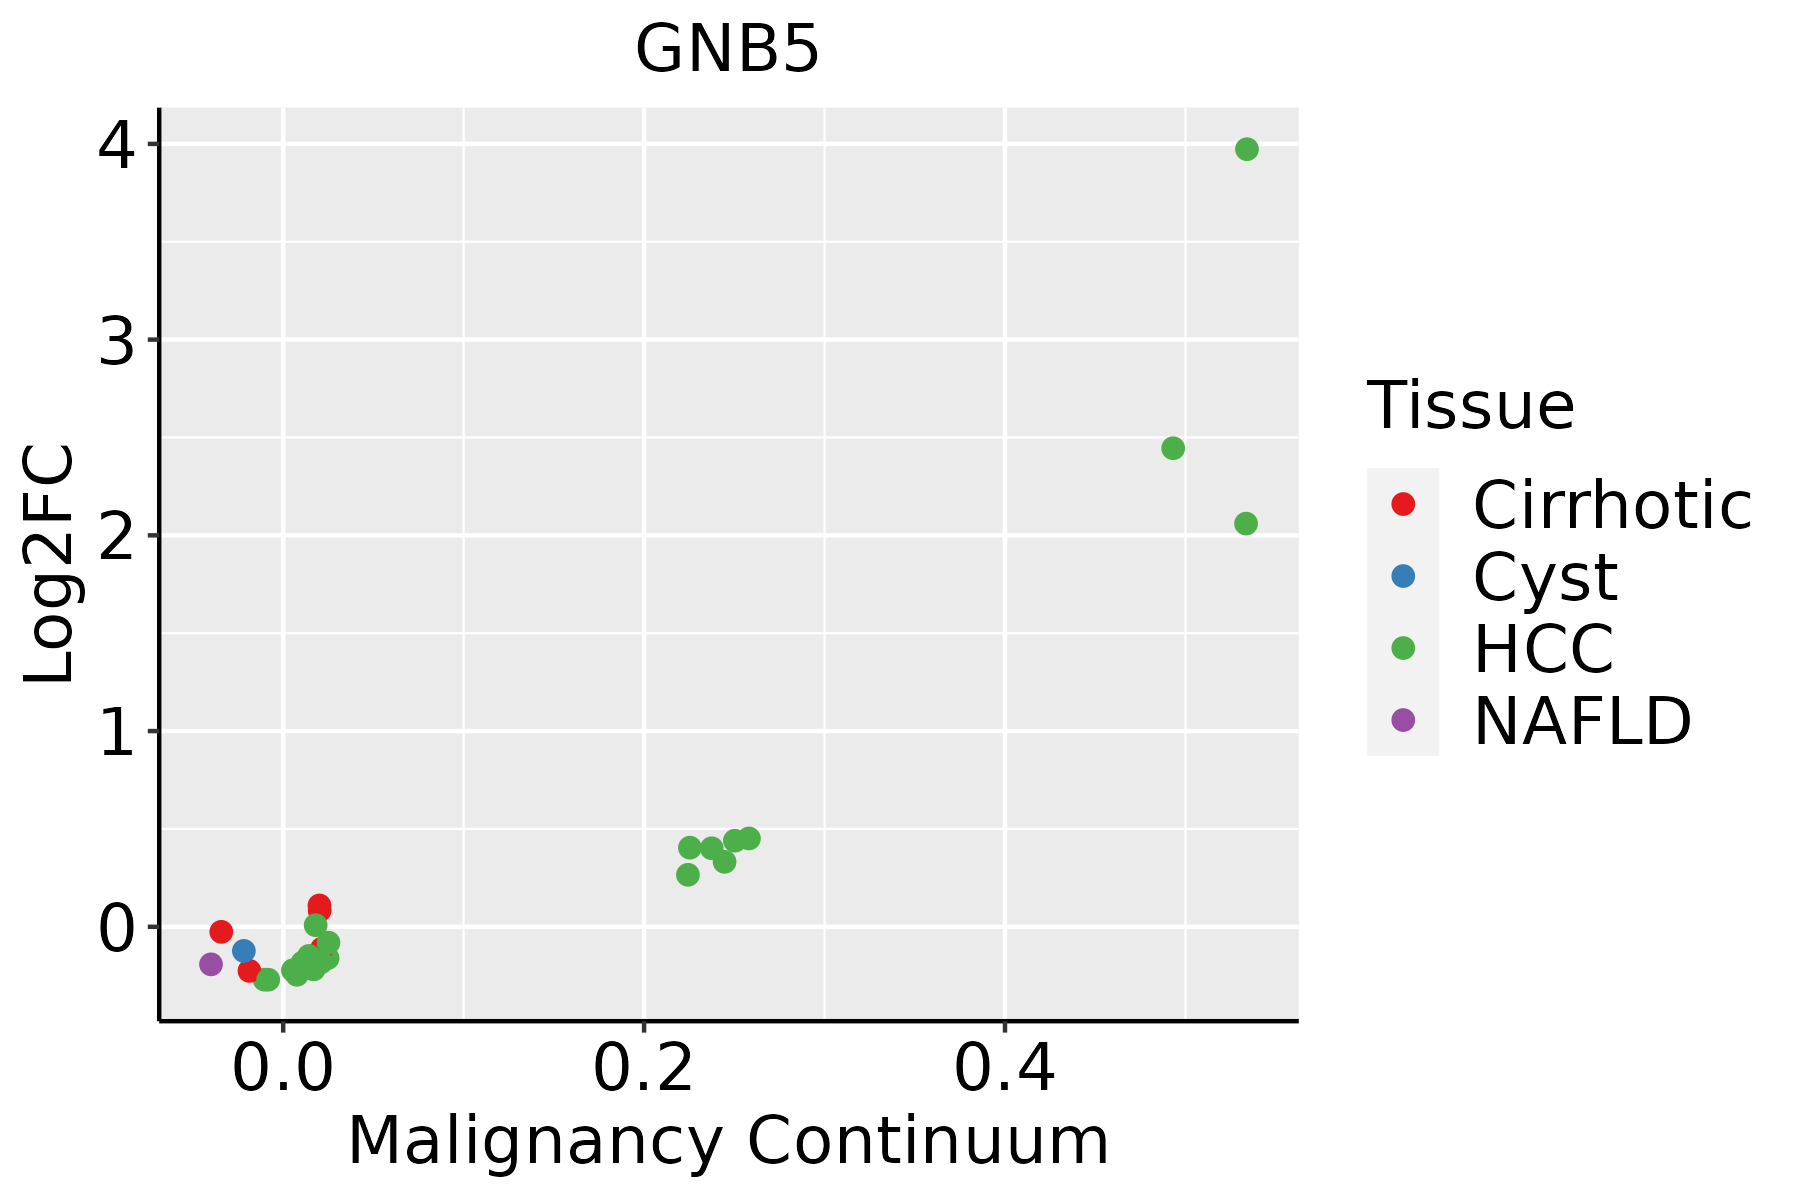 | HCC: Hepatocellular carcinoma |
| NAFLD: Non-alcoholic fatty liver disease | ||
| Oral Cavity | 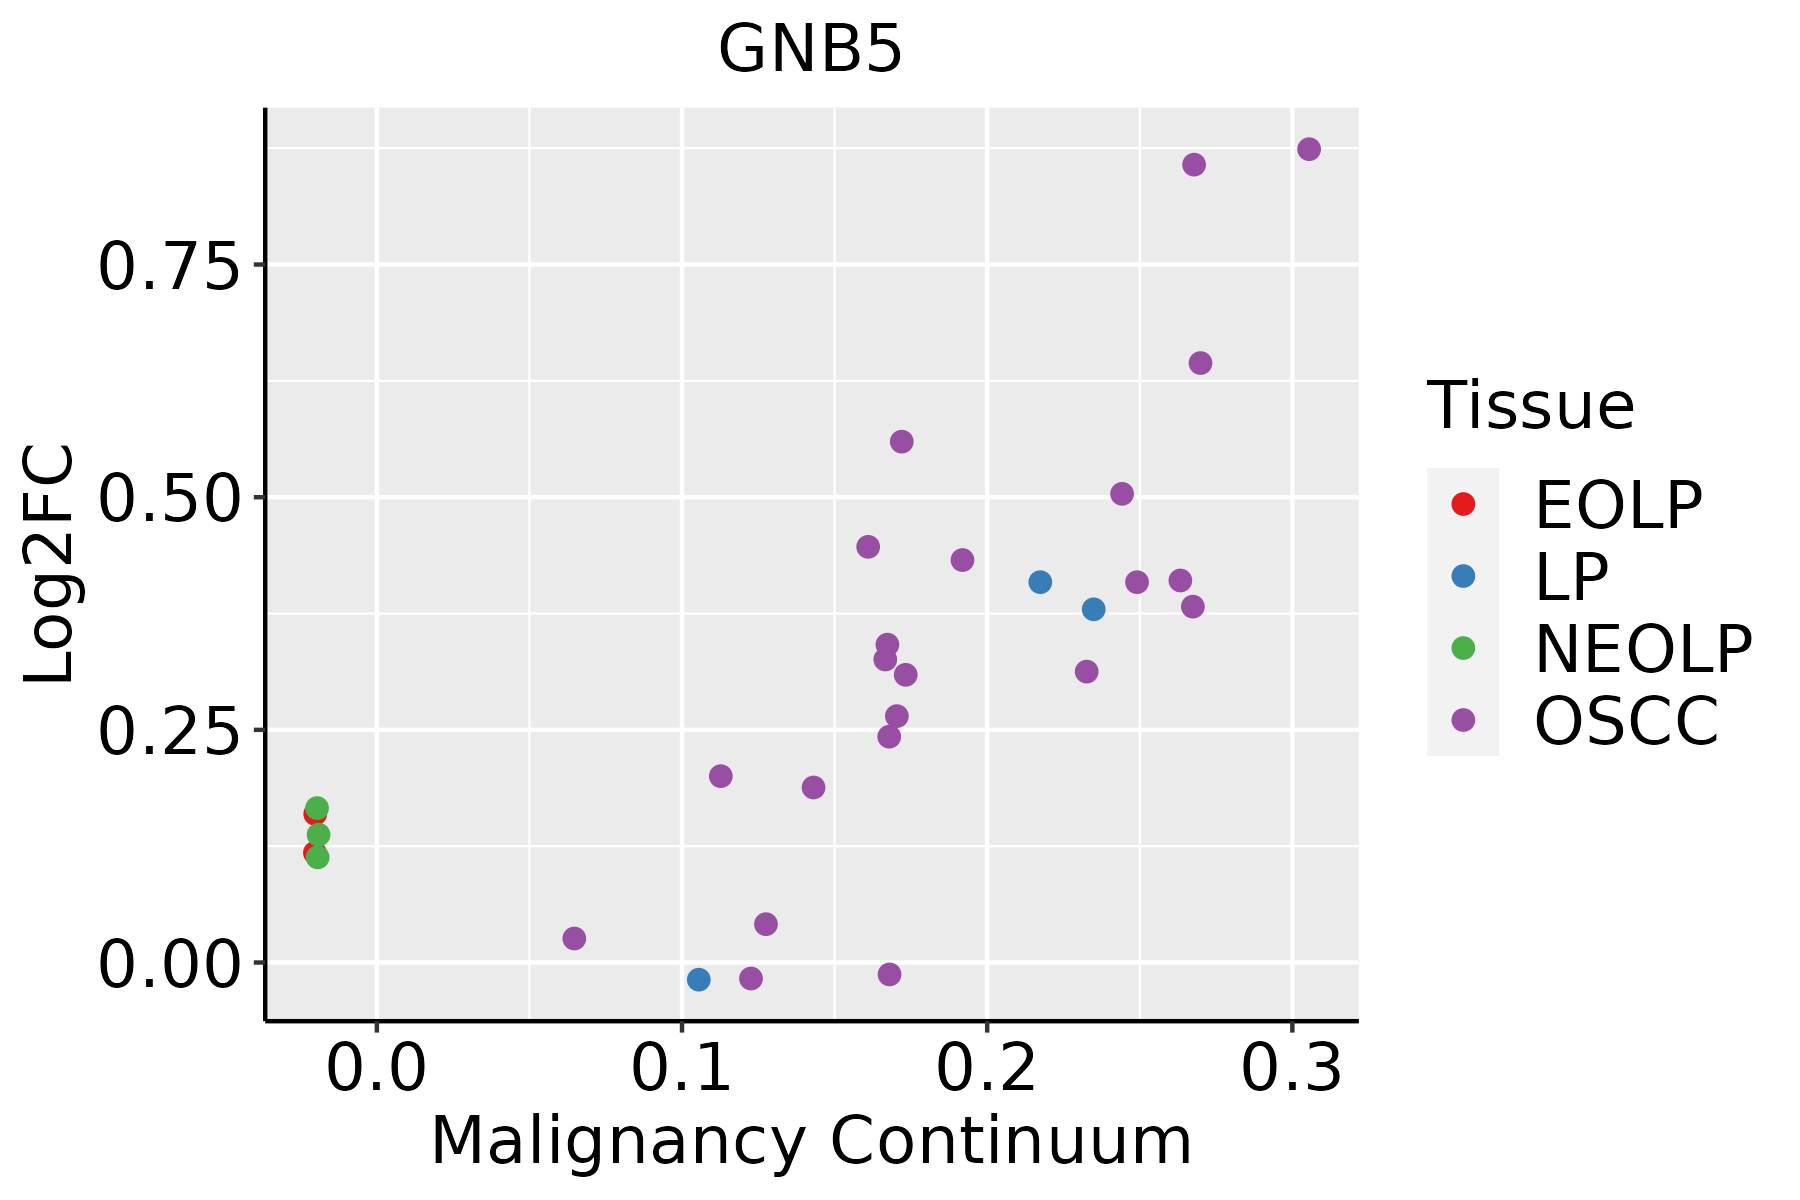 | EOLP: Erosive Oral lichen planus |
| LP: leukoplakia | ||
| NEOLP: Non-erosive oral lichen planus | ||
| OSCC: Oral squamous cell carcinoma | ||
| Skin | 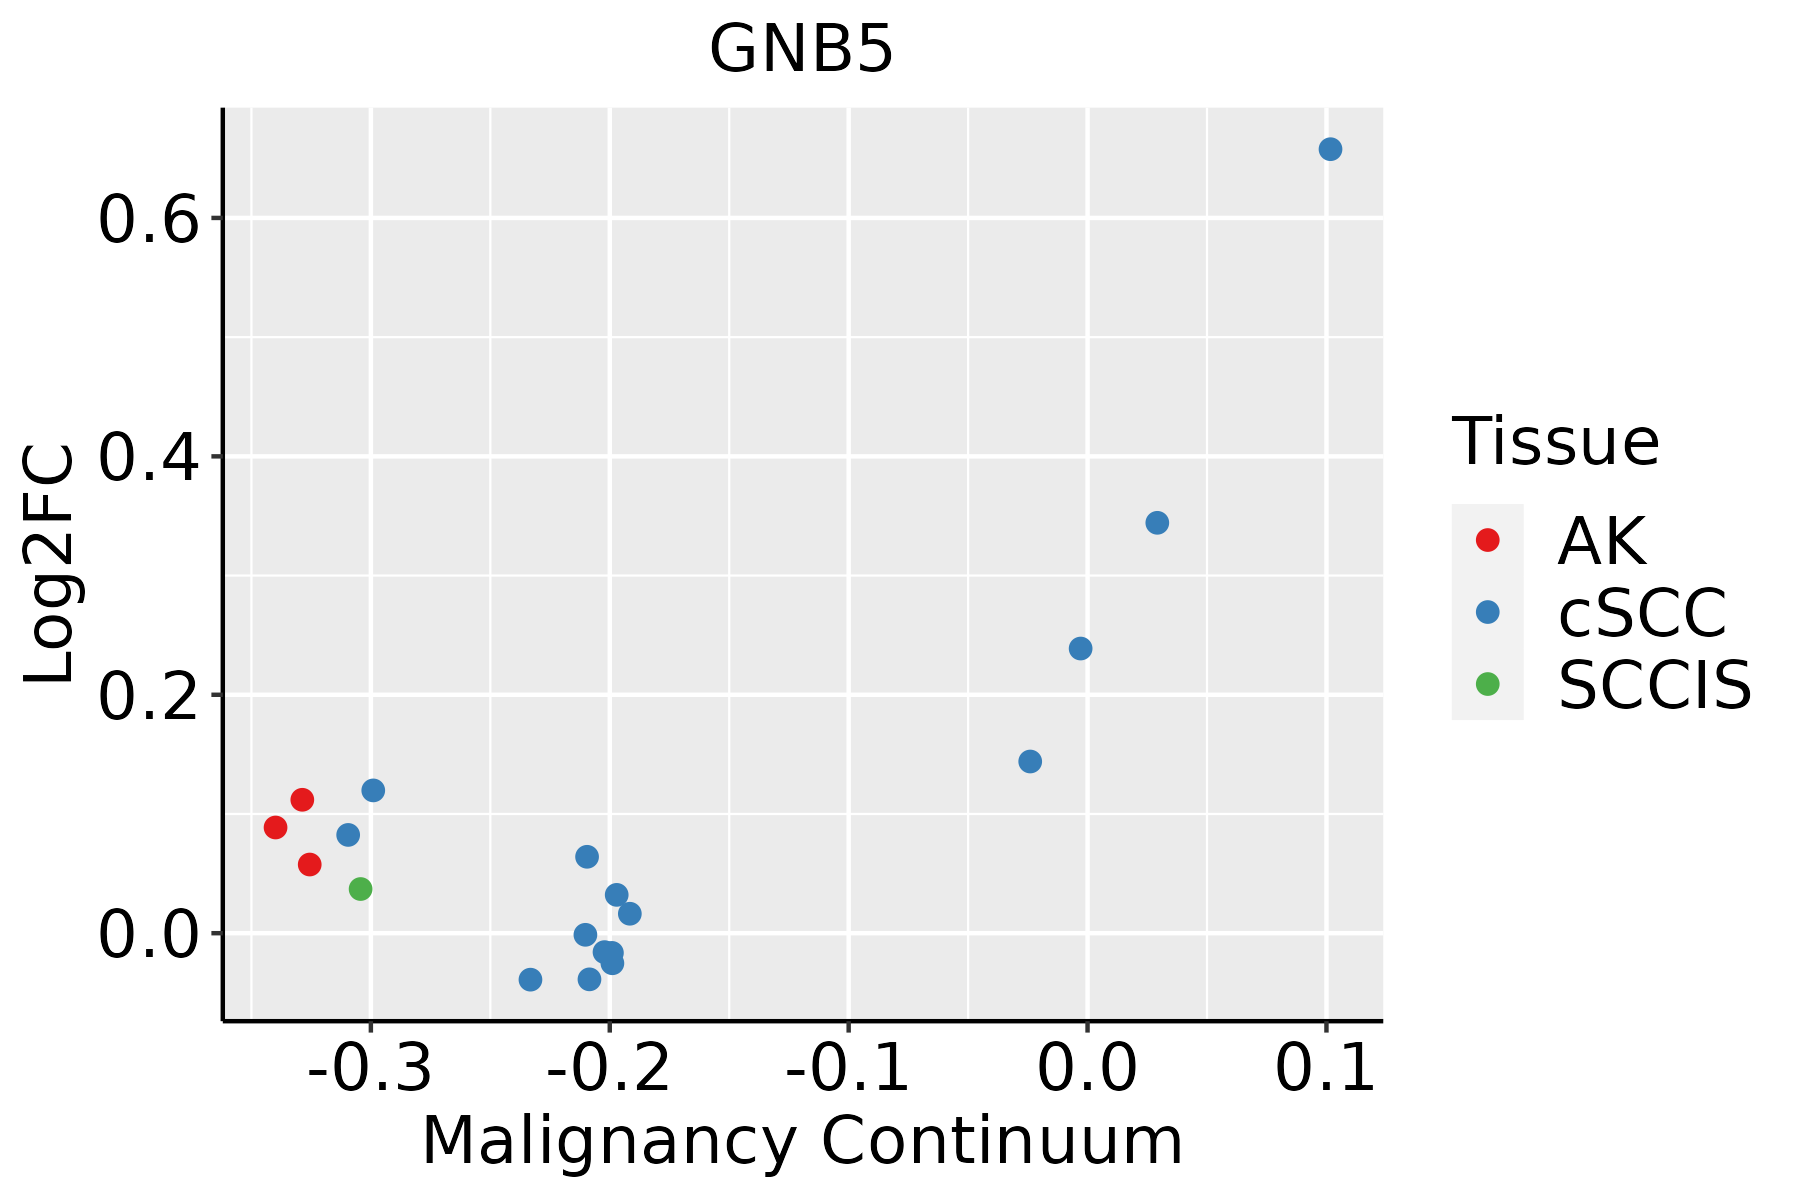 | AK: Actinic keratosis |
| cSCC: Cutaneous squamous cell carcinoma | ||
| SCCIS:squamous cell carcinoma in situ | ||
| Thyroid |  | ATC: Anaplastic thyroid cancer |
| HT: Hashimoto's thyroiditis | ||
| PTC: Papillary thyroid cancer |
| ∗log2FC in expression of this searched gene in stem-like cells from each diseased tissue sample relative to stem-like cells in normal samples in each tissue plotted against the malignancy continuum. Samples are colored based on if they are from different disease stage. |
Top |
Malignant transformation related pathway analysis |
| Find out the enriched GO biological processes and KEGG pathways involved in transition from healthy to precancer to cancer |
| Tissue | Disease Stage | Enriched GO biological Processes |
| Colorectum | AD |  |
| Colorectum | SER |  |
| Colorectum | MSS |  |
| Colorectum | MSI-H |  |
| Colorectum | FAP |  |
| ∗Top 15 enriched GO BP terms are showed in the bar plot of each disease state in each tissue. Each row represents a significant GO biological process which is colored according to the -log10(p.adjust). |
| Page: 1 2 3 4 5 6 7 8 9 |
| GO ID | Tissue | Disease Stage | Description | Gene Ratio | Bg Ratio | pvalue | p.adjust | Count |
| GO:000931419 | Esophagus | ESCC | response to radiation | 277/8552 | 456/18723 | 4.42e-11 | 1.43e-09 | 277 |
| GO:007121419 | Esophagus | ESCC | cellular response to abiotic stimulus | 206/8552 | 331/18723 | 7.52e-10 | 1.88e-08 | 206 |
| GO:010400419 | Esophagus | ESCC | cellular response to environmental stimulus | 206/8552 | 331/18723 | 7.52e-10 | 1.88e-08 | 206 |
| GO:007147816 | Esophagus | ESCC | cellular response to radiation | 122/8552 | 186/18723 | 3.07e-08 | 5.73e-07 | 122 |
| GO:000941611 | Esophagus | ESCC | response to light stimulus | 183/8552 | 320/18723 | 2.03e-05 | 1.76e-04 | 183 |
| GO:00714821 | Esophagus | ESCC | cellular response to light stimulus | 75/8552 | 123/18723 | 4.45e-04 | 2.50e-03 | 75 |
| GO:004308715 | Esophagus | ESCC | regulation of GTPase activity | 183/8552 | 348/18723 | 5.34e-03 | 2.00e-02 | 183 |
| GO:007121411 | Liver | Cirrhotic | cellular response to abiotic stimulus | 115/4634 | 331/18723 | 2.62e-05 | 3.38e-04 | 115 |
| GO:010400411 | Liver | Cirrhotic | cellular response to environmental stimulus | 115/4634 | 331/18723 | 2.62e-05 | 3.38e-04 | 115 |
| GO:007147811 | Liver | Cirrhotic | cellular response to radiation | 68/4634 | 186/18723 | 2.11e-04 | 1.94e-03 | 68 |
| GO:00510514 | Liver | Cirrhotic | negative regulation of transport | 141/4634 | 470/18723 | 5.06e-03 | 2.62e-02 | 141 |
| GO:007121421 | Liver | HCC | cellular response to abiotic stimulus | 183/7958 | 331/18723 | 1.59e-06 | 2.26e-05 | 183 |
| GO:010400421 | Liver | HCC | cellular response to environmental stimulus | 183/7958 | 331/18723 | 1.59e-06 | 2.26e-05 | 183 |
| GO:00714782 | Liver | HCC | cellular response to radiation | 104/7958 | 186/18723 | 1.48e-04 | 1.19e-03 | 104 |
| GO:00093146 | Liver | HCC | response to radiation | 223/7958 | 456/18723 | 3.08e-03 | 1.43e-02 | 223 |
| GO:007121416 | Oral cavity | OSCC | cellular response to abiotic stimulus | 186/7305 | 331/18723 | 1.38e-10 | 4.10e-09 | 186 |
| GO:010400416 | Oral cavity | OSCC | cellular response to environmental stimulus | 186/7305 | 331/18723 | 1.38e-10 | 4.10e-09 | 186 |
| GO:000931416 | Oral cavity | OSCC | response to radiation | 241/7305 | 456/18723 | 9.76e-10 | 2.40e-08 | 241 |
| GO:00714788 | Oral cavity | OSCC | cellular response to radiation | 109/7305 | 186/18723 | 4.54e-08 | 8.45e-07 | 109 |
| GO:00094164 | Oral cavity | OSCC | response to light stimulus | 159/7305 | 320/18723 | 5.98e-05 | 4.92e-04 | 159 |
| Page: 1 2 3 |
| Pathway ID | Tissue | Disease Stage | Description | Gene Ratio | Bg Ratio | pvalue | p.adjust | qvalue | Count |
| hsa05170210 | Esophagus | ESCC | Human immunodeficiency virus 1 infection | 147/4205 | 212/8465 | 3.37e-09 | 3.53e-08 | 1.81e-08 | 147 |
| hsa05167211 | Esophagus | ESCC | Kaposi sarcoma-associated herpesvirus infection | 136/4205 | 194/8465 | 4.28e-09 | 4.22e-08 | 2.16e-08 | 136 |
| hsa05163210 | Esophagus | ESCC | Human cytomegalovirus infection | 148/4205 | 225/8465 | 5.73e-07 | 4.00e-06 | 2.05e-06 | 148 |
| hsa049268 | Esophagus | ESCC | Relaxin signaling pathway | 81/4205 | 129/8465 | 1.72e-03 | 5.09e-03 | 2.61e-03 | 81 |
| hsa041517 | Esophagus | ESCC | PI3K-Akt signaling pathway | 197/4205 | 354/8465 | 1.24e-02 | 2.83e-02 | 1.45e-02 | 197 |
| hsa0517038 | Esophagus | ESCC | Human immunodeficiency virus 1 infection | 147/4205 | 212/8465 | 3.37e-09 | 3.53e-08 | 1.81e-08 | 147 |
| hsa0516738 | Esophagus | ESCC | Kaposi sarcoma-associated herpesvirus infection | 136/4205 | 194/8465 | 4.28e-09 | 4.22e-08 | 2.16e-08 | 136 |
| hsa0516338 | Esophagus | ESCC | Human cytomegalovirus infection | 148/4205 | 225/8465 | 5.73e-07 | 4.00e-06 | 2.05e-06 | 148 |
| hsa0492616 | Esophagus | ESCC | Relaxin signaling pathway | 81/4205 | 129/8465 | 1.72e-03 | 5.09e-03 | 2.61e-03 | 81 |
| hsa0415114 | Esophagus | ESCC | PI3K-Akt signaling pathway | 197/4205 | 354/8465 | 1.24e-02 | 2.83e-02 | 1.45e-02 | 197 |
| hsa0516312 | Liver | Cirrhotic | Human cytomegalovirus infection | 87/2530 | 225/8465 | 2.67e-03 | 1.10e-02 | 6.76e-03 | 87 |
| hsa0516714 | Liver | Cirrhotic | Kaposi sarcoma-associated herpesvirus infection | 73/2530 | 194/8465 | 1.17e-02 | 3.81e-02 | 2.35e-02 | 73 |
| hsa0472314 | Liver | Cirrhotic | Retrograde endocannabinoid signaling | 57/2530 | 148/8465 | 1.45e-02 | 4.39e-02 | 2.71e-02 | 57 |
| hsa0516313 | Liver | Cirrhotic | Human cytomegalovirus infection | 87/2530 | 225/8465 | 2.67e-03 | 1.10e-02 | 6.76e-03 | 87 |
| hsa0516715 | Liver | Cirrhotic | Kaposi sarcoma-associated herpesvirus infection | 73/2530 | 194/8465 | 1.17e-02 | 3.81e-02 | 2.35e-02 | 73 |
| hsa0472315 | Liver | Cirrhotic | Retrograde endocannabinoid signaling | 57/2530 | 148/8465 | 1.45e-02 | 4.39e-02 | 2.71e-02 | 57 |
| hsa051709 | Liver | HCC | Human immunodeficiency virus 1 infection | 125/4020 | 212/8465 | 4.51e-04 | 1.94e-03 | 1.08e-03 | 125 |
| hsa0516322 | Liver | HCC | Human cytomegalovirus infection | 131/4020 | 225/8465 | 6.86e-04 | 2.77e-03 | 1.54e-03 | 131 |
| hsa0516721 | Liver | HCC | Kaposi sarcoma-associated herpesvirus infection | 111/4020 | 194/8465 | 3.78e-03 | 1.16e-02 | 6.45e-03 | 111 |
| hsa049262 | Liver | HCC | Relaxin signaling pathway | 75/4020 | 129/8465 | 9.33e-03 | 2.46e-02 | 1.37e-02 | 75 |
| Page: 1 2 3 |
Top |
Cell-cell communication analysis |
| Identification of potential cell-cell interactions between two cell types and their ligand-receptor pairs for different disease states |
| Ligand | Receptor | LRpair | Pathway | Tissue | Disease Stage |
| Page: 1 |
Top |
Single-cell gene regulatory network inference analysis |
| Find out the significant the regulons (TFs) and the target genes of each regulon across cell types for different disease states |
| TF | Cell Type | Tissue | Disease Stage | Target Gene | RSS | Regulon Activity |
| ∗The dot plots of a searched regulon are shown for all cell subpopulations in each disease state of each tissue based on the regulon specific score inferred using pySCENIC and by calculating the average expression. |
| Page: 1 |
Top |
Somatic mutation of malignant transformation related genes |
| Annotation of somatic variants for genes involved in malignant transformation |
| Hugo Symbol | Variant Class | Variant Classification | dbSNP RS | HGVSc | HGVSp | HGVSp Short | SWISSPROT | BIOTYPE | SIFT | PolyPhen | Tumor Sample Barcode | Tissue | Histology | Sex | Age | Stage | Therapy Types | Drugs | Outcome |
| GNB5 | SNV | Missense_Mutation | c.805N>T | p.Arg269Cys | p.R269C | O14775 | protein_coding | deleterious(0) | probably_damaging(0.98) | TCGA-A8-A08P-01 | Breast | breast invasive carcinoma | Female | >=65 | III/IV | Chemotherapy | 5-fluorouracil | CR | |
| GNB5 | SNV | Missense_Mutation | c.344N>G | p.Lys115Arg | p.K115R | O14775 | protein_coding | tolerated(0.53) | benign(0.003) | TCGA-AO-A128-01 | Breast | breast invasive carcinoma | Female | <65 | I/II | Chemotherapy | doxorubicin | SD | |
| GNB5 | SNV | Missense_Mutation | novel | c.1135G>A | p.Gly379Arg | p.G379R | O14775 | protein_coding | deleterious(0) | probably_damaging(1) | TCGA-AR-A5QN-01 | Breast | breast invasive carcinoma | Female | >=65 | III/IV | Chemotherapy | taxotere | SD |
| GNB5 | SNV | Missense_Mutation | novel | c.721N>A | p.Leu241Ile | p.L241I | O14775 | protein_coding | deleterious(0.03) | probably_damaging(0.996) | TCGA-2W-A8YY-01 | Cervix | cervical & endocervical cancer | Female | <65 | I/II | Chemotherapy | cisplatin | CR |
| GNB5 | SNV | Missense_Mutation | c.256N>T | p.Arg86Trp | p.R86W | O14775 | protein_coding | deleterious(0.01) | benign(0.336) | TCGA-C5-A7CL-01 | Cervix | cervical & endocervical cancer | Female | <65 | III/IV | Chemotherapy | cisplatin | PD | |
| GNB5 | SNV | Missense_Mutation | novel | c.584N>A | p.Thr195Asn | p.T195N | O14775 | protein_coding | deleterious(0.03) | probably_damaging(0.996) | TCGA-C5-A901-01 | Cervix | cervical & endocervical cancer | Female | <65 | I/II | Unknown | Unknown | SD |
| GNB5 | SNV | Missense_Mutation | rs13380232 | c.703G>A | p.Gly235Arg | p.G235R | O14775 | protein_coding | deleterious(0) | probably_damaging(0.98) | TCGA-EA-A410-01 | Cervix | cervical & endocervical cancer | Female | <65 | I/II | Unknown | Unknown | SD |
| GNB5 | SNV | Missense_Mutation | c.673G>C | p.Glu225Gln | p.E225Q | O14775 | protein_coding | deleterious(0) | benign(0.007) | TCGA-HM-A4S6-01 | Cervix | cervical & endocervical cancer | Female | <65 | III/IV | Chemotherapy | cisplatin | CR | |
| GNB5 | SNV | Missense_Mutation | rs759589203 | c.1105N>T | p.Arg369Cys | p.R369C | O14775 | protein_coding | deleterious(0) | probably_damaging(0.998) | TCGA-AA-3877-01 | Colorectum | colon adenocarcinoma | Female | >=65 | I/II | Unknown | Unknown | SD |
| GNB5 | SNV | Missense_Mutation | c.895G>T | p.Gly299Trp | p.G299W | O14775 | protein_coding | deleterious(0) | probably_damaging(0.992) | TCGA-AD-6964-01 | Colorectum | colon adenocarcinoma | Male | <65 | III/IV | Chemotherapy | folfox | PD |
| Page: 1 2 3 4 5 |
Top |
Related drugs of malignant transformation related genes |
| Identification of chemicals and drugs interact with genes involved in malignant transfromation |
| (DGIdb 4.0) |
| Entrez ID | Symbol | Category | Interaction Types | Drug Claim Name | Drug Name | PMIDs |
| Page: 1 |

Copyright 2023-Present -The University of Texas Health Science Center at Houston |