
|
|||||
|
 | |
| |
| |
| |
| |
| |
|
Gene: GNB4 |
Gene summary for GNB4 |
| Gene information | Species | Human | Gene symbol | GNB4 | Gene ID | 59345 |
| Gene name | G protein subunit beta 4 | |
| Gene Alias | CMTD1F | |
| Cytomap | 3q26.33 | |
| Gene Type | protein-coding | GO ID | GO:0007154 | UniProtAcc | Q9HAV0 |
Top |
Malignant transformation analysis |
| Identification of the aberrant gene expression in precancerous and cancerous lesions by comparing the gene expression of stem-like cells in diseased tissues with normal stem cells |
| Entrez ID | Symbol | Replicates | Species | Organ | Tissue | Adj P-value | Log2FC | Malignancy |
| 59345 | GNB4 | LZE4T | Human | Esophagus | ESCC | 2.41e-03 | 1.41e-01 | 0.0811 |
| 59345 | GNB4 | LZE24T | Human | Esophagus | ESCC | 7.44e-06 | 1.91e-01 | 0.0596 |
| 59345 | GNB4 | LZE6T | Human | Esophagus | ESCC | 1.88e-02 | 2.20e-01 | 0.0845 |
| 59345 | GNB4 | P2T-E | Human | Esophagus | ESCC | 6.98e-45 | 9.37e-01 | 0.1177 |
| 59345 | GNB4 | P5T-E | Human | Esophagus | ESCC | 3.27e-38 | 8.93e-01 | 0.1327 |
| 59345 | GNB4 | P8T-E | Human | Esophagus | ESCC | 1.86e-05 | 2.39e-02 | 0.0889 |
| 59345 | GNB4 | P11T-E | Human | Esophagus | ESCC | 6.62e-14 | 6.01e-01 | 0.1426 |
| 59345 | GNB4 | P15T-E | Human | Esophagus | ESCC | 2.51e-04 | 1.69e-01 | 0.1149 |
| 59345 | GNB4 | P16T-E | Human | Esophagus | ESCC | 3.53e-36 | 6.34e-01 | 0.1153 |
| 59345 | GNB4 | P17T-E | Human | Esophagus | ESCC | 2.70e-08 | 3.67e-01 | 0.1278 |
| 59345 | GNB4 | P19T-E | Human | Esophagus | ESCC | 1.96e-06 | 9.38e-01 | 0.1662 |
| 59345 | GNB4 | P20T-E | Human | Esophagus | ESCC | 4.57e-14 | 1.47e-01 | 0.1124 |
| 59345 | GNB4 | P21T-E | Human | Esophagus | ESCC | 2.68e-11 | 3.07e-01 | 0.1617 |
| 59345 | GNB4 | P22T-E | Human | Esophagus | ESCC | 1.41e-38 | 8.92e-01 | 0.1236 |
| 59345 | GNB4 | P23T-E | Human | Esophagus | ESCC | 7.54e-18 | 4.98e-01 | 0.108 |
| 59345 | GNB4 | P24T-E | Human | Esophagus | ESCC | 2.44e-20 | 4.48e-01 | 0.1287 |
| 59345 | GNB4 | P26T-E | Human | Esophagus | ESCC | 9.75e-56 | 1.05e+00 | 0.1276 |
| 59345 | GNB4 | P27T-E | Human | Esophagus | ESCC | 2.92e-03 | 1.21e-01 | 0.1055 |
| 59345 | GNB4 | P28T-E | Human | Esophagus | ESCC | 6.51e-03 | 5.46e-02 | 0.1149 |
| 59345 | GNB4 | P31T-E | Human | Esophagus | ESCC | 3.75e-03 | 2.68e-02 | 0.1251 |
| Page: 1 2 3 4 5 |
| Tissue | Expression Dynamics | Abbreviation |
| Esophagus | 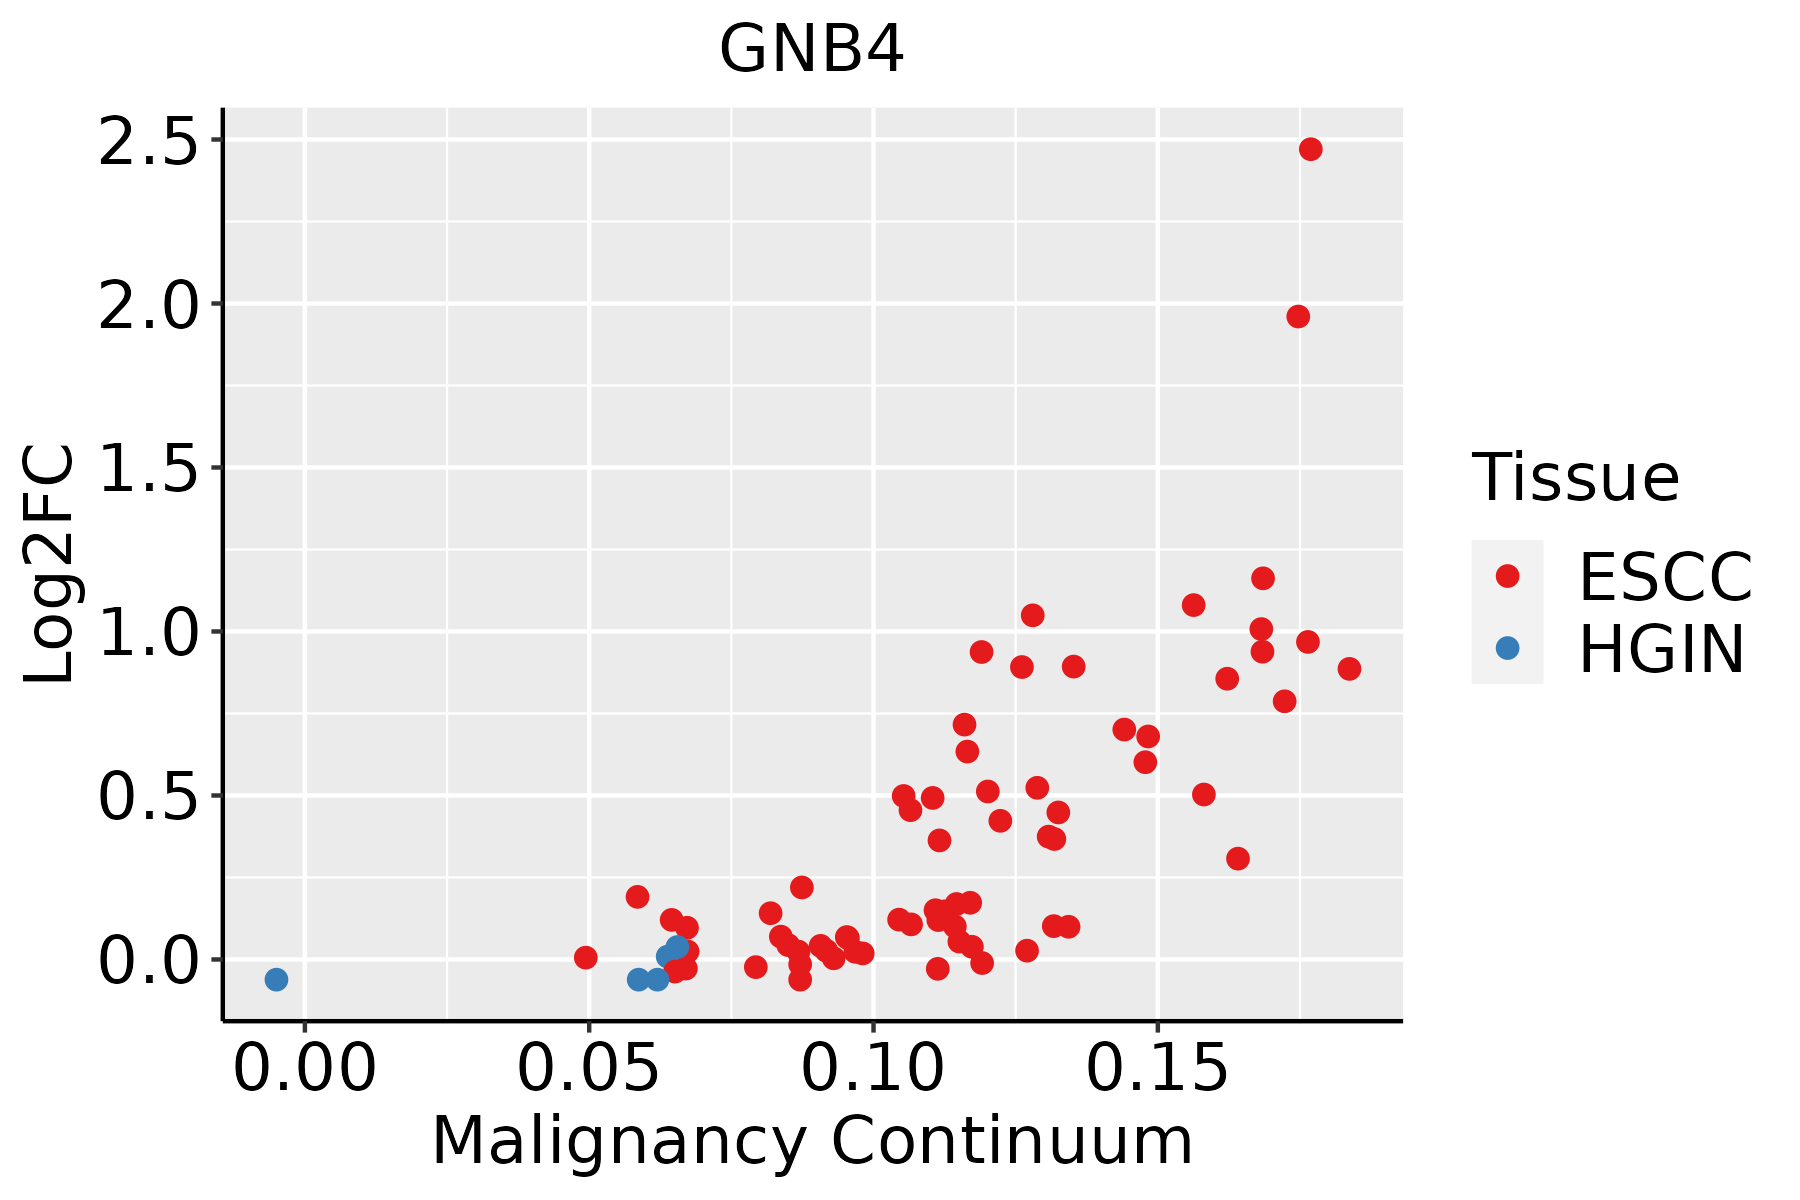 | ESCC: Esophageal squamous cell carcinoma |
| HGIN: High-grade intraepithelial neoplasias | ||
| LGIN: Low-grade intraepithelial neoplasias | ||
| Liver | 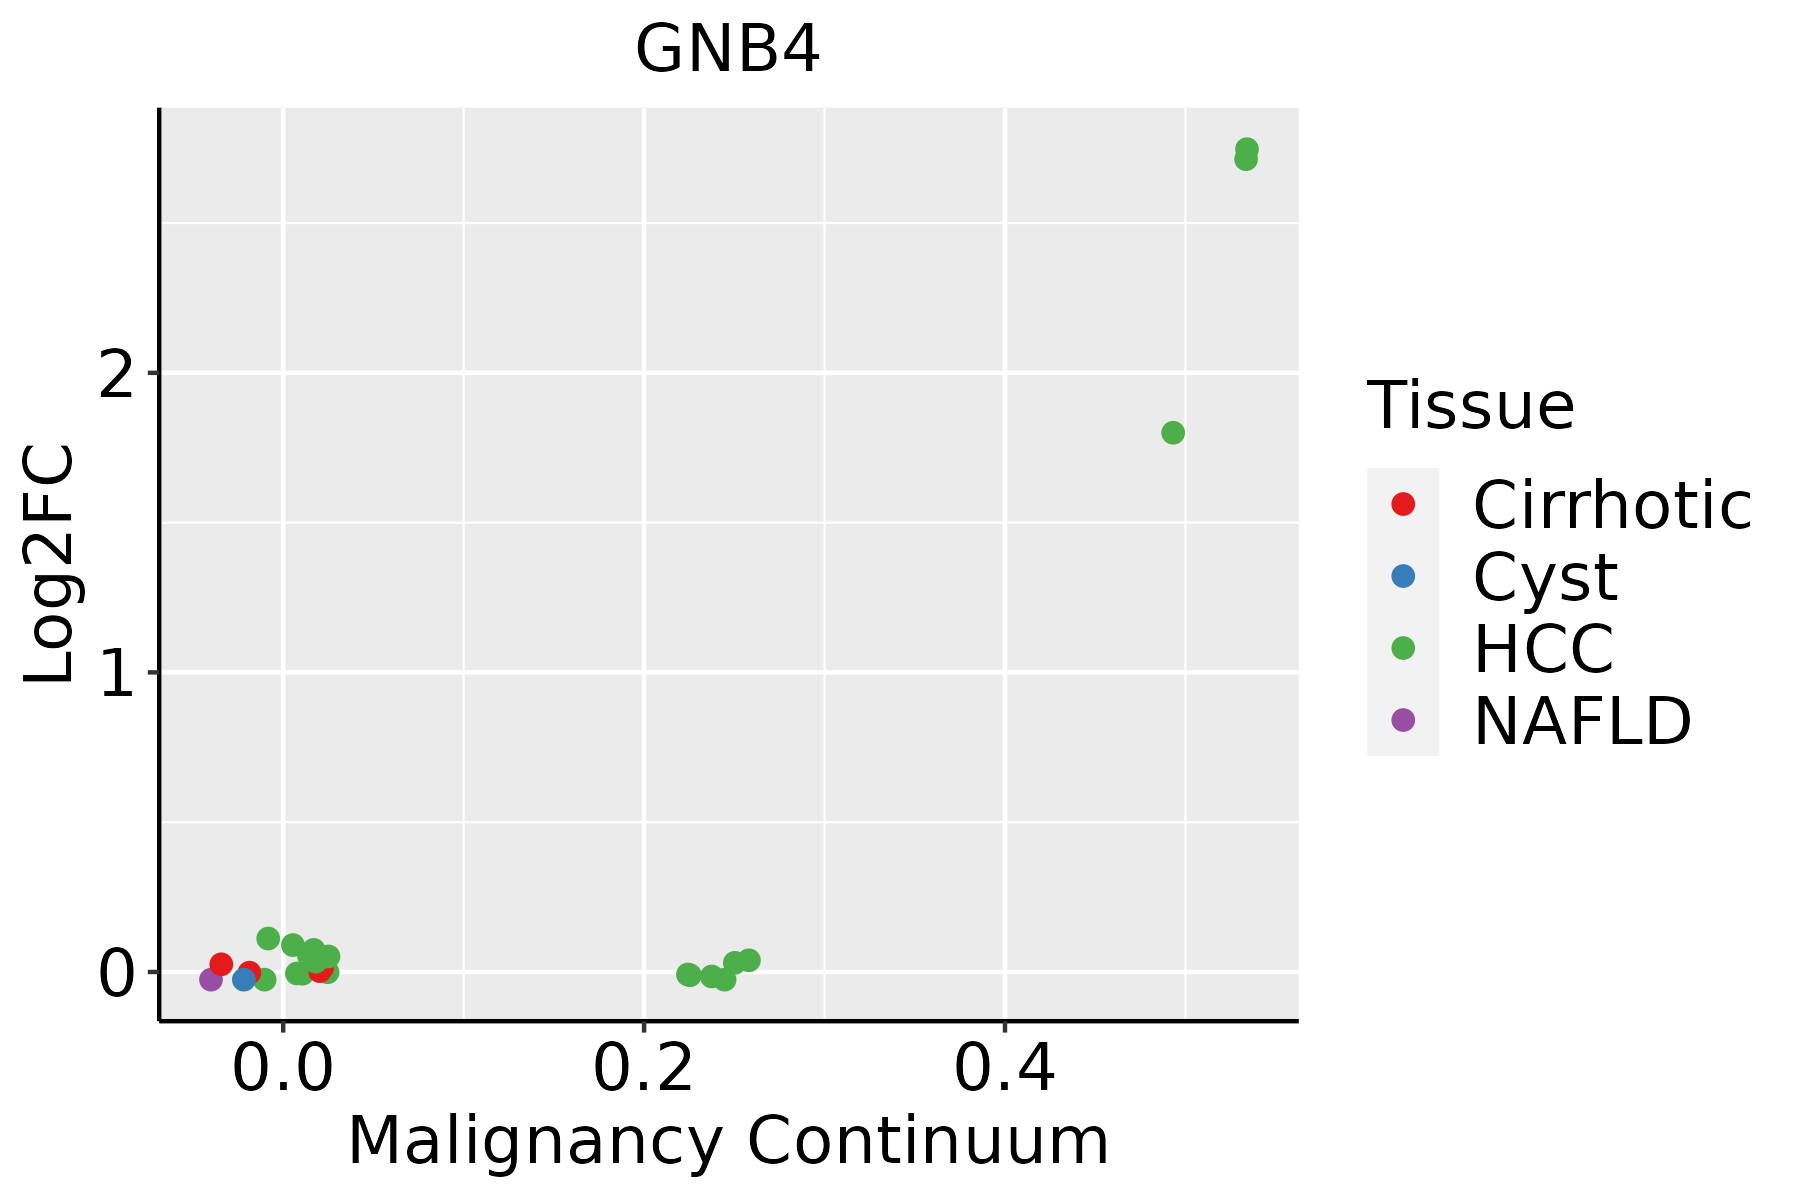 | HCC: Hepatocellular carcinoma |
| NAFLD: Non-alcoholic fatty liver disease | ||
| Oral Cavity | 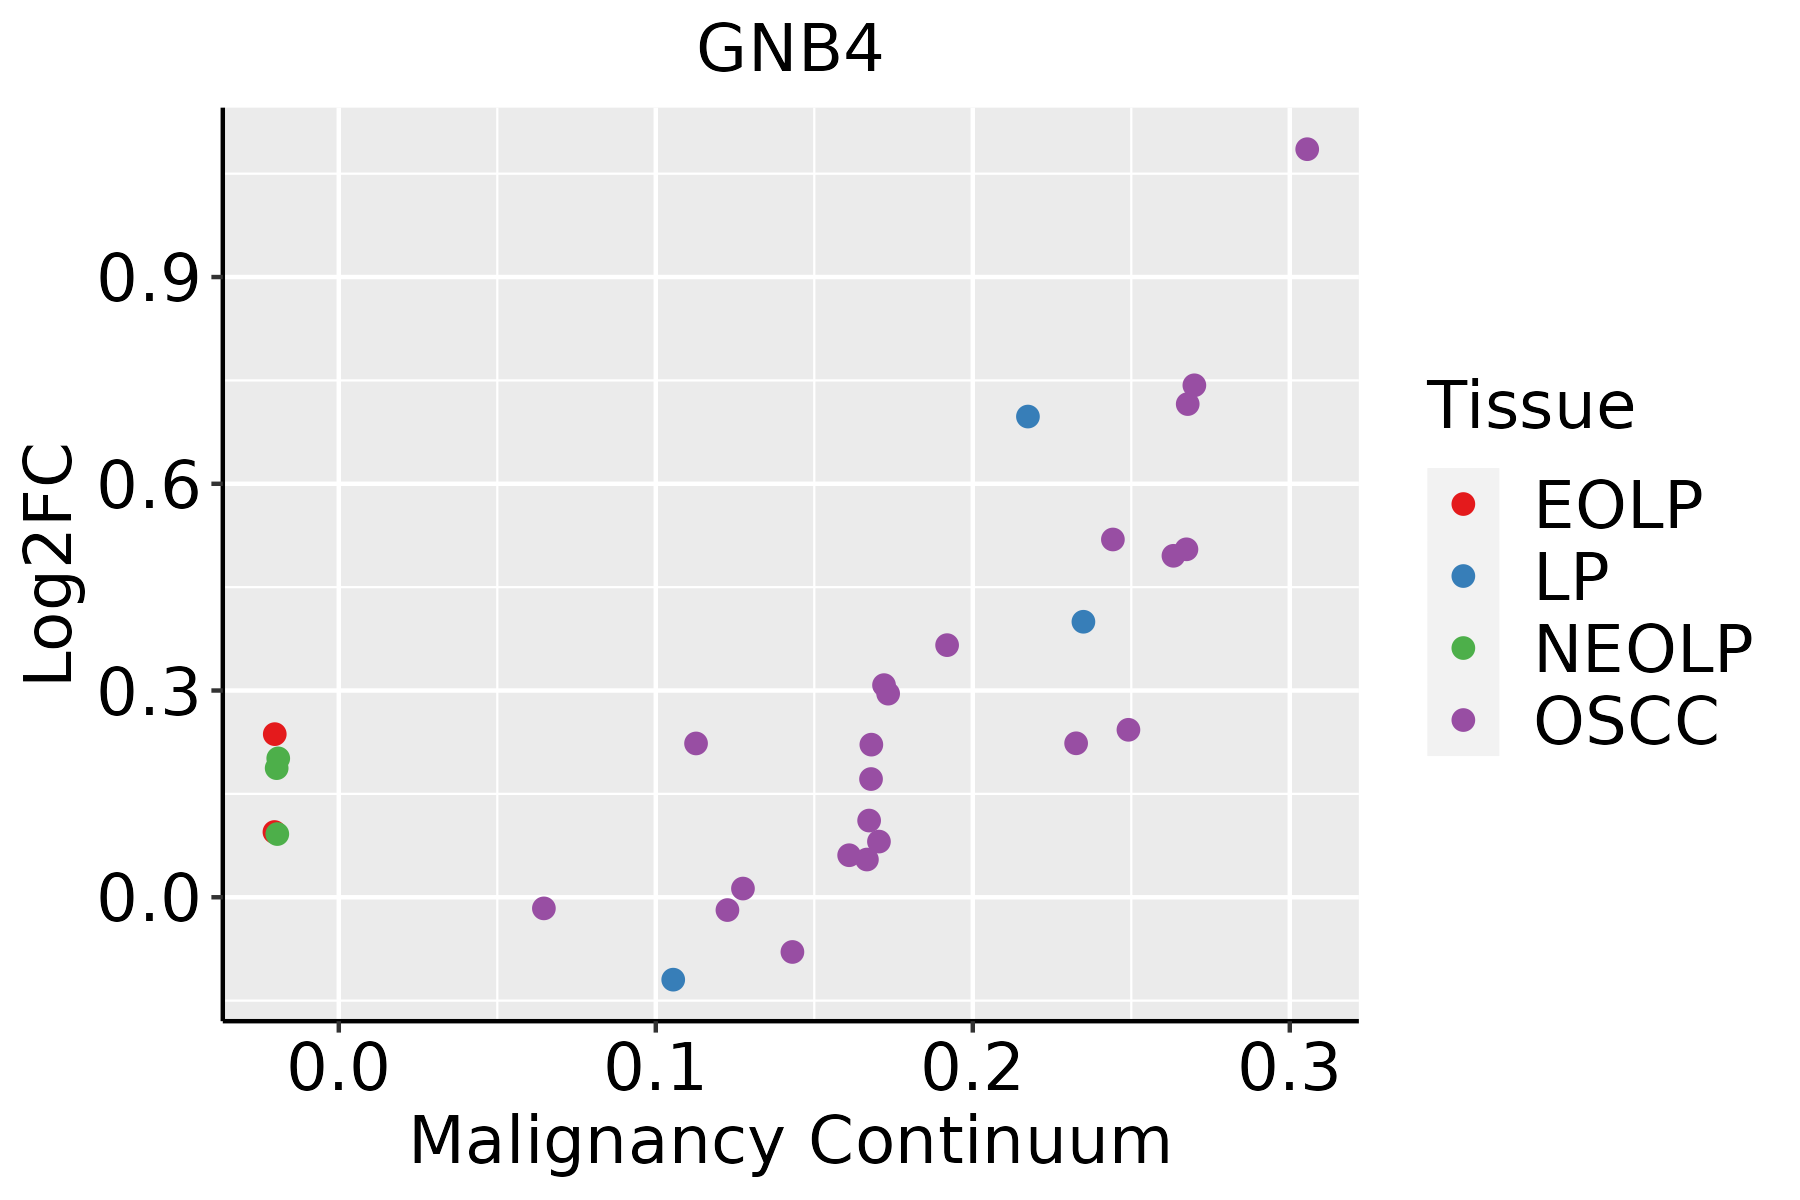 | EOLP: Erosive Oral lichen planus |
| LP: leukoplakia | ||
| NEOLP: Non-erosive oral lichen planus | ||
| OSCC: Oral squamous cell carcinoma | ||
| Skin | 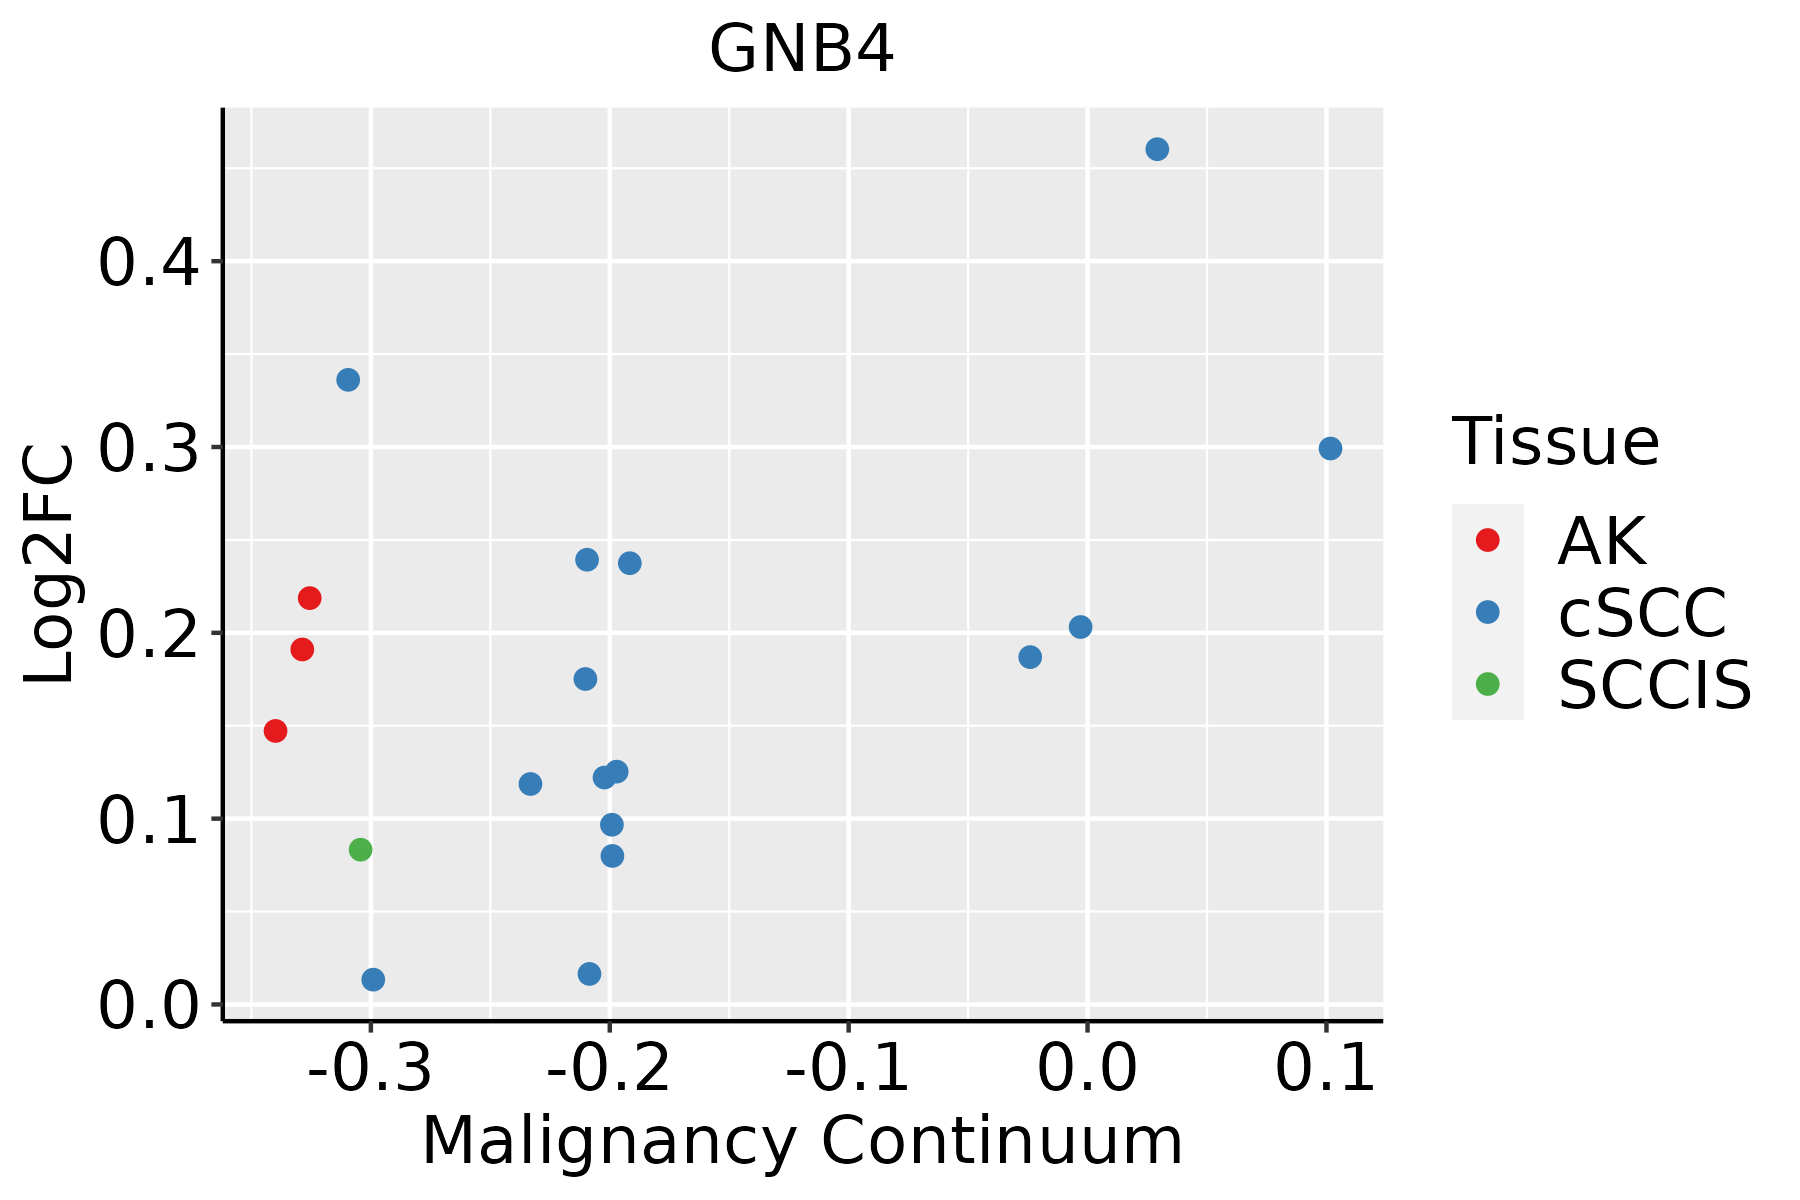 | AK: Actinic keratosis |
| cSCC: Cutaneous squamous cell carcinoma | ||
| SCCIS:squamous cell carcinoma in situ | ||
| Thyroid | 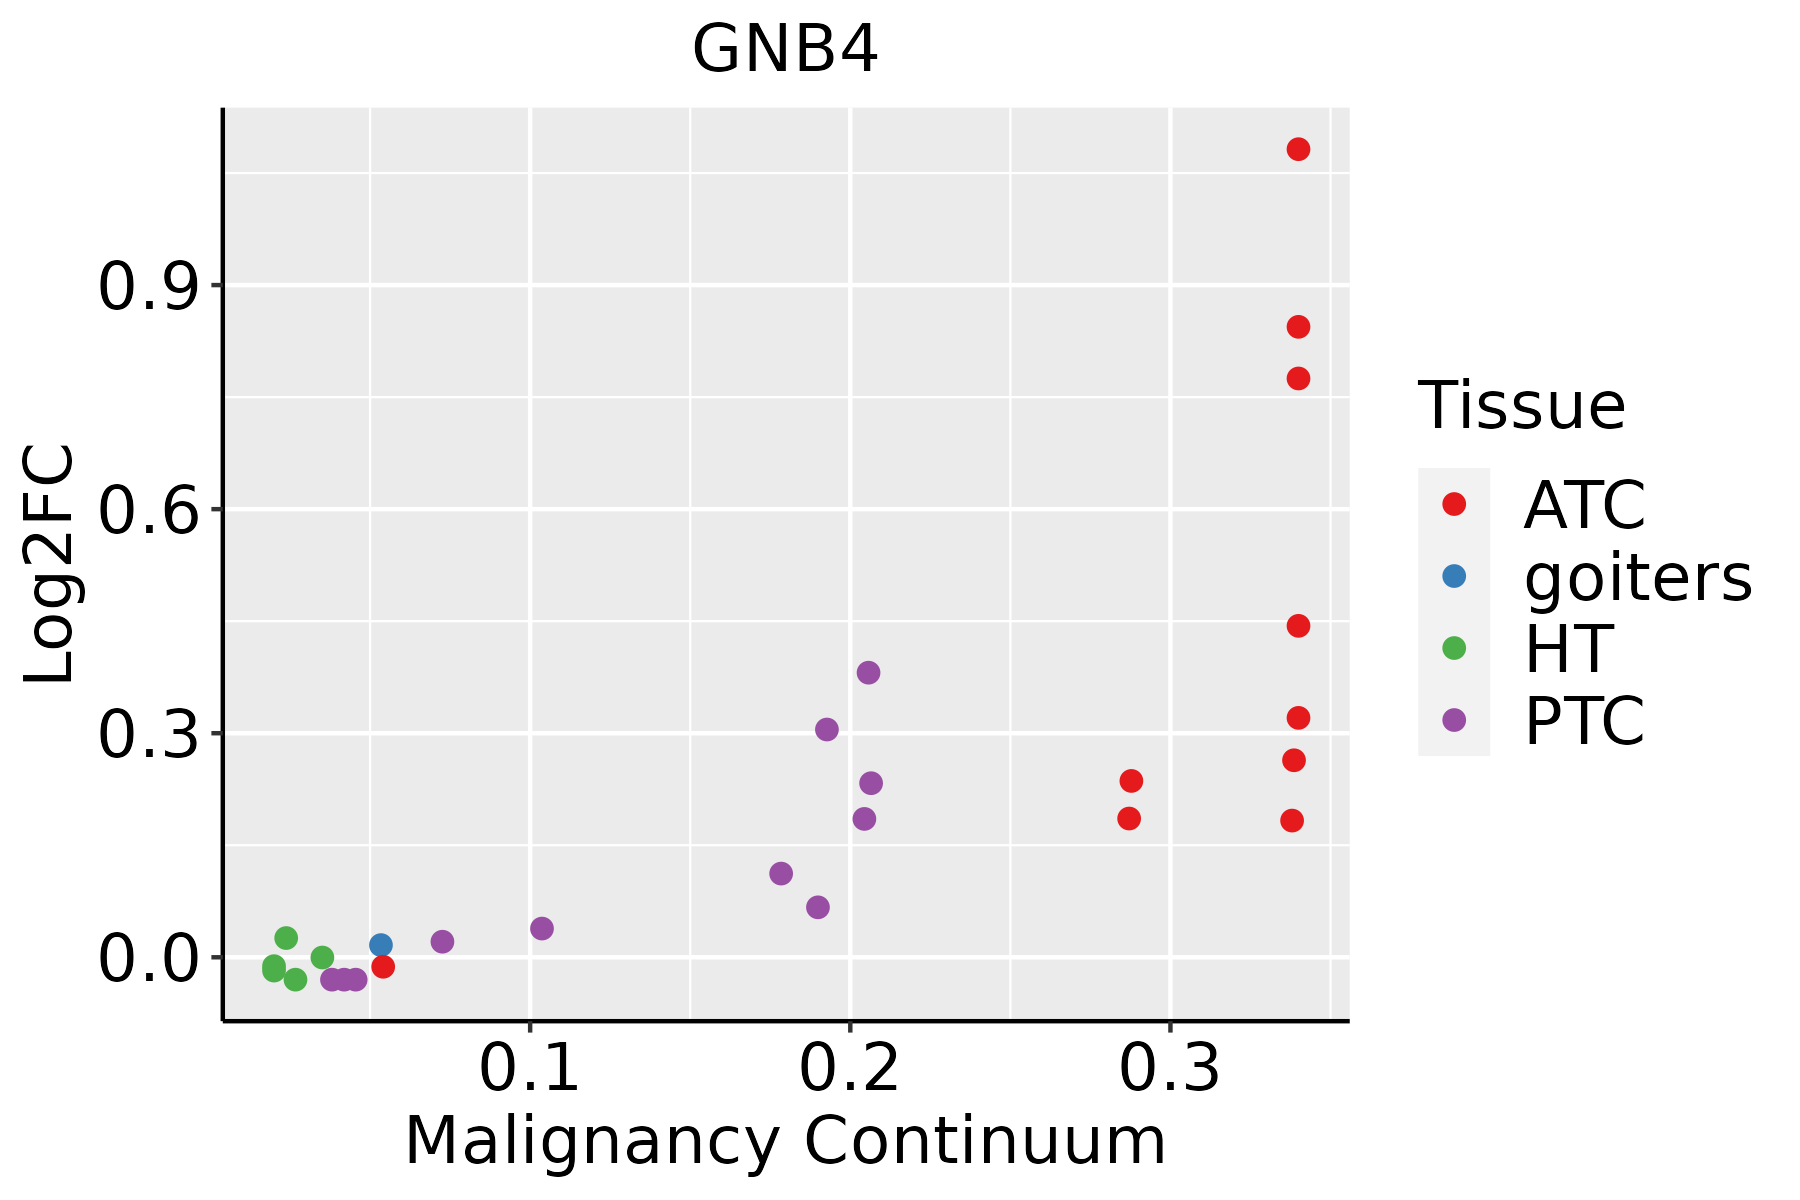 | ATC: Anaplastic thyroid cancer |
| HT: Hashimoto's thyroiditis | ||
| PTC: Papillary thyroid cancer |
| ∗log2FC in expression of this searched gene in stem-like cells from each diseased tissue sample relative to stem-like cells in normal samples in each tissue plotted against the malignancy continuum. Samples are colored based on if they are from different disease stage. |
Top |
Malignant transformation related pathway analysis |
| Find out the enriched GO biological processes and KEGG pathways involved in transition from healthy to precancer to cancer |
| Tissue | Disease Stage | Enriched GO biological Processes |
| Colorectum | AD |  |
| Colorectum | SER |  |
| Colorectum | MSS |  |
| Colorectum | MSI-H |  |
| Colorectum | FAP |  |
| ∗Top 15 enriched GO BP terms are showed in the bar plot of each disease state in each tissue. Each row represents a significant GO biological process which is colored according to the -log10(p.adjust). |
| Page: 1 2 3 4 5 6 7 8 9 |
| GO ID | Tissue | Disease Stage | Description | Gene Ratio | Bg Ratio | pvalue | p.adjust | Count |
| GO:0021762111 | Esophagus | ESCC | substantia nigra development | 35/8552 | 44/18723 | 4.40e-06 | 4.69e-05 | 35 |
| GO:004885718 | Esophagus | ESCC | neural nucleus development | 44/8552 | 64/18723 | 1.59e-04 | 1.05e-03 | 44 |
| GO:003090118 | Esophagus | ESCC | midbrain development | 58/8552 | 90/18723 | 2.52e-04 | 1.55e-03 | 58 |
| GO:002176222 | Liver | HCC | substantia nigra development | 33/7958 | 44/18723 | 1.21e-05 | 1.38e-04 | 33 |
| GO:003090121 | Liver | HCC | midbrain development | 54/7958 | 90/18723 | 6.04e-04 | 3.79e-03 | 54 |
| GO:004885722 | Liver | HCC | neural nucleus development | 38/7958 | 64/18723 | 4.78e-03 | 2.02e-02 | 38 |
| GO:002176219 | Oral cavity | OSCC | substantia nigra development | 28/7305 | 44/18723 | 8.15e-04 | 4.35e-03 | 28 |
| GO:003090116 | Oral cavity | OSCC | midbrain development | 46/7305 | 90/18723 | 1.30e-02 | 4.33e-02 | 46 |
| GO:002176224 | Oral cavity | EOLP | substantia nigra development | 14/2218 | 44/18723 | 3.72e-04 | 3.38e-03 | 14 |
| GO:003090123 | Oral cavity | EOLP | midbrain development | 20/2218 | 90/18723 | 3.81e-03 | 2.11e-02 | 20 |
| GO:004885717 | Oral cavity | EOLP | neural nucleus development | 15/2218 | 64/18723 | 6.83e-03 | 3.32e-02 | 15 |
| GO:002176232 | Oral cavity | NEOLP | substantia nigra development | 12/2005 | 44/18723 | 1.76e-03 | 1.21e-02 | 12 |
| GO:003090132 | Oral cavity | NEOLP | midbrain development | 19/2005 | 90/18723 | 2.81e-03 | 1.73e-02 | 19 |
| GO:003090119 | Skin | AK | midbrain development | 19/1910 | 90/18723 | 1.61e-03 | 1.15e-02 | 19 |
| GO:002176225 | Skin | cSCC | substantia nigra development | 27/4864 | 44/18723 | 7.90e-07 | 1.46e-05 | 27 |
| GO:0030901110 | Skin | cSCC | midbrain development | 45/4864 | 90/18723 | 8.81e-07 | 1.63e-05 | 45 |
| GO:004885719 | Skin | cSCC | neural nucleus development | 28/4864 | 64/18723 | 1.52e-03 | 9.52e-03 | 28 |
| GO:0021762112 | Thyroid | PTC | substantia nigra development | 31/5968 | 44/18723 | 1.70e-07 | 3.19e-06 | 31 |
| GO:0030901111 | Thyroid | PTC | midbrain development | 48/5968 | 90/18723 | 1.95e-05 | 1.99e-04 | 48 |
| GO:0048857110 | Thyroid | PTC | neural nucleus development | 34/5968 | 64/18723 | 3.38e-04 | 2.33e-03 | 34 |
| Page: 1 2 |
| Pathway ID | Tissue | Disease Stage | Description | Gene Ratio | Bg Ratio | pvalue | p.adjust | qvalue | Count |
| hsa05170210 | Esophagus | ESCC | Human immunodeficiency virus 1 infection | 147/4205 | 212/8465 | 3.37e-09 | 3.53e-08 | 1.81e-08 | 147 |
| hsa05167211 | Esophagus | ESCC | Kaposi sarcoma-associated herpesvirus infection | 136/4205 | 194/8465 | 4.28e-09 | 4.22e-08 | 2.16e-08 | 136 |
| hsa05163210 | Esophagus | ESCC | Human cytomegalovirus infection | 148/4205 | 225/8465 | 5.73e-07 | 4.00e-06 | 2.05e-06 | 148 |
| hsa049268 | Esophagus | ESCC | Relaxin signaling pathway | 81/4205 | 129/8465 | 1.72e-03 | 5.09e-03 | 2.61e-03 | 81 |
| hsa041517 | Esophagus | ESCC | PI3K-Akt signaling pathway | 197/4205 | 354/8465 | 1.24e-02 | 2.83e-02 | 1.45e-02 | 197 |
| hsa0517038 | Esophagus | ESCC | Human immunodeficiency virus 1 infection | 147/4205 | 212/8465 | 3.37e-09 | 3.53e-08 | 1.81e-08 | 147 |
| hsa0516738 | Esophagus | ESCC | Kaposi sarcoma-associated herpesvirus infection | 136/4205 | 194/8465 | 4.28e-09 | 4.22e-08 | 2.16e-08 | 136 |
| hsa0516338 | Esophagus | ESCC | Human cytomegalovirus infection | 148/4205 | 225/8465 | 5.73e-07 | 4.00e-06 | 2.05e-06 | 148 |
| hsa0492616 | Esophagus | ESCC | Relaxin signaling pathway | 81/4205 | 129/8465 | 1.72e-03 | 5.09e-03 | 2.61e-03 | 81 |
| hsa0415114 | Esophagus | ESCC | PI3K-Akt signaling pathway | 197/4205 | 354/8465 | 1.24e-02 | 2.83e-02 | 1.45e-02 | 197 |
| hsa051709 | Liver | HCC | Human immunodeficiency virus 1 infection | 125/4020 | 212/8465 | 4.51e-04 | 1.94e-03 | 1.08e-03 | 125 |
| hsa0516322 | Liver | HCC | Human cytomegalovirus infection | 131/4020 | 225/8465 | 6.86e-04 | 2.77e-03 | 1.54e-03 | 131 |
| hsa0516721 | Liver | HCC | Kaposi sarcoma-associated herpesvirus infection | 111/4020 | 194/8465 | 3.78e-03 | 1.16e-02 | 6.45e-03 | 111 |
| hsa049262 | Liver | HCC | Relaxin signaling pathway | 75/4020 | 129/8465 | 9.33e-03 | 2.46e-02 | 1.37e-02 | 75 |
| hsa0517012 | Liver | HCC | Human immunodeficiency virus 1 infection | 125/4020 | 212/8465 | 4.51e-04 | 1.94e-03 | 1.08e-03 | 125 |
| hsa0516332 | Liver | HCC | Human cytomegalovirus infection | 131/4020 | 225/8465 | 6.86e-04 | 2.77e-03 | 1.54e-03 | 131 |
| hsa0516731 | Liver | HCC | Kaposi sarcoma-associated herpesvirus infection | 111/4020 | 194/8465 | 3.78e-03 | 1.16e-02 | 6.45e-03 | 111 |
| hsa0492611 | Liver | HCC | Relaxin signaling pathway | 75/4020 | 129/8465 | 9.33e-03 | 2.46e-02 | 1.37e-02 | 75 |
| hsa0516729 | Oral cavity | OSCC | Kaposi sarcoma-associated herpesvirus infection | 125/3704 | 194/8465 | 3.67e-09 | 3.84e-08 | 1.96e-08 | 125 |
| hsa0517027 | Oral cavity | OSCC | Human immunodeficiency virus 1 infection | 133/3704 | 212/8465 | 1.42e-08 | 1.40e-07 | 7.12e-08 | 133 |
| Page: 1 2 3 |
Top |
Cell-cell communication analysis |
| Identification of potential cell-cell interactions between two cell types and their ligand-receptor pairs for different disease states |
| Ligand | Receptor | LRpair | Pathway | Tissue | Disease Stage |
| Page: 1 |
Top |
Single-cell gene regulatory network inference analysis |
| Find out the significant the regulons (TFs) and the target genes of each regulon across cell types for different disease states |
| TF | Cell Type | Tissue | Disease Stage | Target Gene | RSS | Regulon Activity |
| ∗The dot plots of a searched regulon are shown for all cell subpopulations in each disease state of each tissue based on the regulon specific score inferred using pySCENIC and by calculating the average expression. |
| Page: 1 |
Top |
Somatic mutation of malignant transformation related genes |
| Annotation of somatic variants for genes involved in malignant transformation |
| Hugo Symbol | Variant Class | Variant Classification | dbSNP RS | HGVSc | HGVSp | HGVSp Short | SWISSPROT | BIOTYPE | SIFT | PolyPhen | Tumor Sample Barcode | Tissue | Histology | Sex | Age | Stage | Therapy Types | Drugs | Outcome |
| GNB4 | SNV | Missense_Mutation | c.184C>A | p.His62Asn | p.H62N | Q9HAV0 | protein_coding | tolerated(0.1) | probably_damaging(0.968) | TCGA-BH-A0C1-01 | Breast | breast invasive carcinoma | Female | <65 | III/IV | Chemotherapy | adriamycin | PD | |
| GNB4 | SNV | Missense_Mutation | c.183G>A | p.Met61Ile | p.M61I | Q9HAV0 | protein_coding | tolerated(0.06) | probably_damaging(0.995) | TCGA-BH-A0C1-01 | Breast | breast invasive carcinoma | Female | <65 | III/IV | Chemotherapy | adriamycin | PD | |
| GNB4 | insertion | Nonsense_Mutation | novel | c.302_303insAAATTTACTGCACAAAATTCAAACTCATGAAAAATAAAGC | p.Met101IlefsTer13 | p.M101Ifs*13 | Q9HAV0 | protein_coding | TCGA-BH-A0H7-01 | Breast | breast invasive carcinoma | Female | >=65 | III/IV | Chemotherapy | doxorubicin | SD | ||
| GNB4 | SNV | Missense_Mutation | c.166N>A | p.Ala56Thr | p.A56T | Q9HAV0 | protein_coding | deleterious(0.01) | possibly_damaging(0.879) | TCGA-A6-2680-01 | Colorectum | colon adenocarcinoma | Female | >=65 | I/II | Unknown | Unknown | SD | |
| GNB4 | SNV | Missense_Mutation | c.770N>T | p.Ala257Val | p.A257V | Q9HAV0 | protein_coding | deleterious(0) | benign(0.405) | TCGA-A6-2686-01 | Colorectum | colon adenocarcinoma | Female | >=65 | I/II | Unknown | Unknown | SD | |
| GNB4 | SNV | Missense_Mutation | c.887N>C | p.Val296Ala | p.V296A | Q9HAV0 | protein_coding | tolerated(0.09) | possibly_damaging(0.809) | TCGA-A6-6780-01 | Colorectum | colon adenocarcinoma | Male | >=65 | I/II | Unknown | Unknown | SD | |
| GNB4 | SNV | Missense_Mutation | c.352N>A | p.Asp118Asn | p.D118N | Q9HAV0 | protein_coding | deleterious(0) | probably_damaging(1) | TCGA-AA-A00N-01 | Colorectum | colon adenocarcinoma | Male | >=65 | I/II | Unknown | Unknown | PD | |
| GNB4 | SNV | Missense_Mutation | c.742N>A | p.Ala248Thr | p.A248T | Q9HAV0 | protein_coding | tolerated(0.07) | probably_damaging(0.972) | TCGA-AM-5821-01 | Colorectum | colon adenocarcinoma | Female | >=65 | I/II | Unknown | Unknown | SD | |
| GNB4 | SNV | Missense_Mutation | rs864622729 | c.196G>A | p.Asp66Asn | p.D66N | Q9HAV0 | protein_coding | deleterious(0.02) | probably_damaging(0.941) | TCGA-AY-A71X-01 | Colorectum | colon adenocarcinoma | Female | <65 | I/II | Unknown | Unknown | SD |
| GNB4 | SNV | Missense_Mutation | rs755914601 | c.137N>A | p.Arg46Gln | p.R46Q | Q9HAV0 | protein_coding | deleterious(0) | possibly_damaging(0.722) | TCGA-AZ-4315-01 | Colorectum | colon adenocarcinoma | Male | <65 | I/II | Unknown | Unknown | SD |
| Page: 1 2 3 4 5 |
Top |
Related drugs of malignant transformation related genes |
| Identification of chemicals and drugs interact with genes involved in malignant transfromation |
| (DGIdb 4.0) |
| Entrez ID | Symbol | Category | Interaction Types | Drug Claim Name | Drug Name | PMIDs |
| Page: 1 |

Copyright 2023-Present -The University of Texas Health Science Center at Houston |