
|
|||||
|
 | |
| |
| |
| |
| |
| |
|
Gene: GNB1L |
Gene summary for GNB1L |
| Gene information | Species | Human | Gene symbol | GNB1L | Gene ID | 54584 |
| Gene name | G protein subunit beta 1 like | |
| Gene Alias | DGCRK3 | |
| Cytomap | 22q11.21 | |
| Gene Type | protein-coding | GO ID | GO:0007154 | UniProtAcc | Q9BYB4 |
Top |
Malignant transformation analysis |
| Identification of the aberrant gene expression in precancerous and cancerous lesions by comparing the gene expression of stem-like cells in diseased tissues with normal stem cells |
| Entrez ID | Symbol | Replicates | Species | Organ | Tissue | Adj P-value | Log2FC | Malignancy |
| 54584 | GNB1L | HTA11_2951_2000001011 | Human | Colorectum | AD | 6.35e-06 | 3.30e-01 | 0.0216 |
| 54584 | GNB1L | HTA11_1938_2000001011 | Human | Colorectum | AD | 5.72e-03 | 1.95e-01 | -0.0811 |
| 54584 | GNB1L | HTA11_3361_2000001011 | Human | Colorectum | AD | 1.48e-07 | 2.61e-01 | -0.1207 |
| 54584 | GNB1L | HTA11_83_2000001011 | Human | Colorectum | SER | 3.24e-05 | 2.88e-01 | -0.1526 |
| 54584 | GNB1L | HTA11_696_2000001011 | Human | Colorectum | AD | 4.57e-11 | 3.12e-01 | -0.1464 |
| 54584 | GNB1L | HTA11_866_2000001011 | Human | Colorectum | AD | 1.01e-08 | 2.53e-01 | -0.1001 |
| 54584 | GNB1L | HTA11_1391_2000001011 | Human | Colorectum | AD | 1.30e-10 | 3.29e-01 | -0.059 |
| 54584 | GNB1L | HTA11_866_3004761011 | Human | Colorectum | AD | 2.13e-11 | 3.02e-01 | 0.096 |
| 54584 | GNB1L | HTA11_4255_2000001011 | Human | Colorectum | SER | 1.73e-07 | 5.03e-01 | 0.0446 |
| 54584 | GNB1L | HTA11_8622_2000001021 | Human | Colorectum | SER | 9.25e-04 | 2.68e-01 | 0.0528 |
| 54584 | GNB1L | HTA11_7663_2000001011 | Human | Colorectum | SER | 2.76e-03 | 4.40e-01 | 0.0131 |
| 54584 | GNB1L | HTA11_10711_2000001011 | Human | Colorectum | AD | 2.18e-04 | 2.08e-01 | 0.0338 |
| 54584 | GNB1L | HTA11_7696_3000711011 | Human | Colorectum | AD | 3.12e-03 | 1.36e-01 | 0.0674 |
| 54584 | GNB1L | HTA11_6818_2000001011 | Human | Colorectum | AD | 8.56e-04 | 2.67e-01 | 0.0112 |
| 54584 | GNB1L | HTA11_6818_2000001021 | Human | Colorectum | AD | 7.24e-07 | 2.85e-01 | 0.0588 |
| 54584 | GNB1L | HTA11_99999970781_79442 | Human | Colorectum | MSS | 4.37e-12 | 2.95e-01 | 0.294 |
| 54584 | GNB1L | HTA11_99999965062_69753 | Human | Colorectum | MSI-H | 3.61e-09 | 8.29e-01 | 0.3487 |
| 54584 | GNB1L | HTA11_99999971662_82457 | Human | Colorectum | MSS | 1.13e-25 | 6.71e-01 | 0.3859 |
| 54584 | GNB1L | HTA11_99999973899_84307 | Human | Colorectum | MSS | 6.00e-03 | 2.50e-01 | 0.2585 |
| 54584 | GNB1L | LZE7T | Human | Esophagus | ESCC | 1.62e-04 | 1.67e-01 | 0.0667 |
| Page: 1 2 3 4 5 |
| Tissue | Expression Dynamics | Abbreviation |
| Colorectum (GSE201348) | 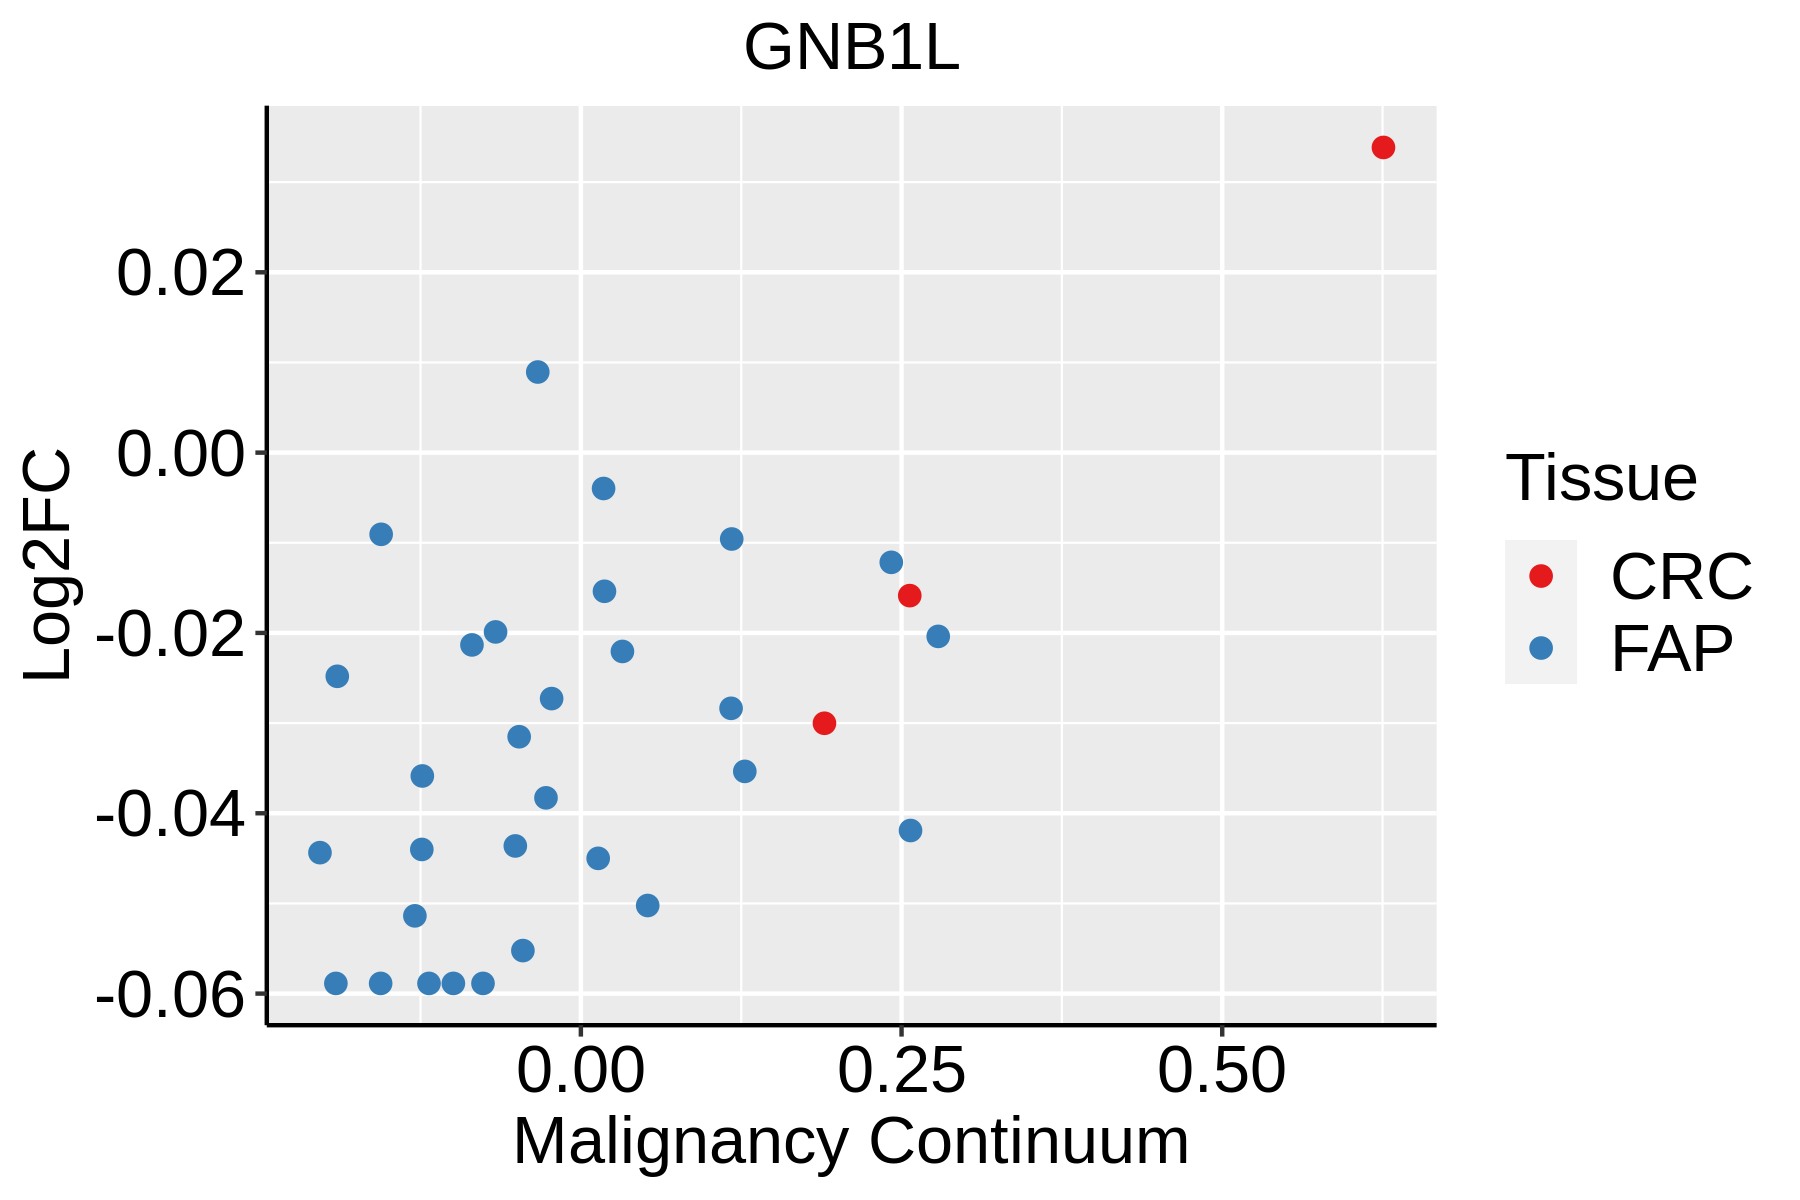 | FAP: Familial adenomatous polyposis |
| CRC: Colorectal cancer | ||
| Colorectum (HTA11) |  | AD: Adenomas |
| SER: Sessile serrated lesions | ||
| MSI-H: Microsatellite-high colorectal cancer | ||
| MSS: Microsatellite stable colorectal cancer | ||
| Esophagus | 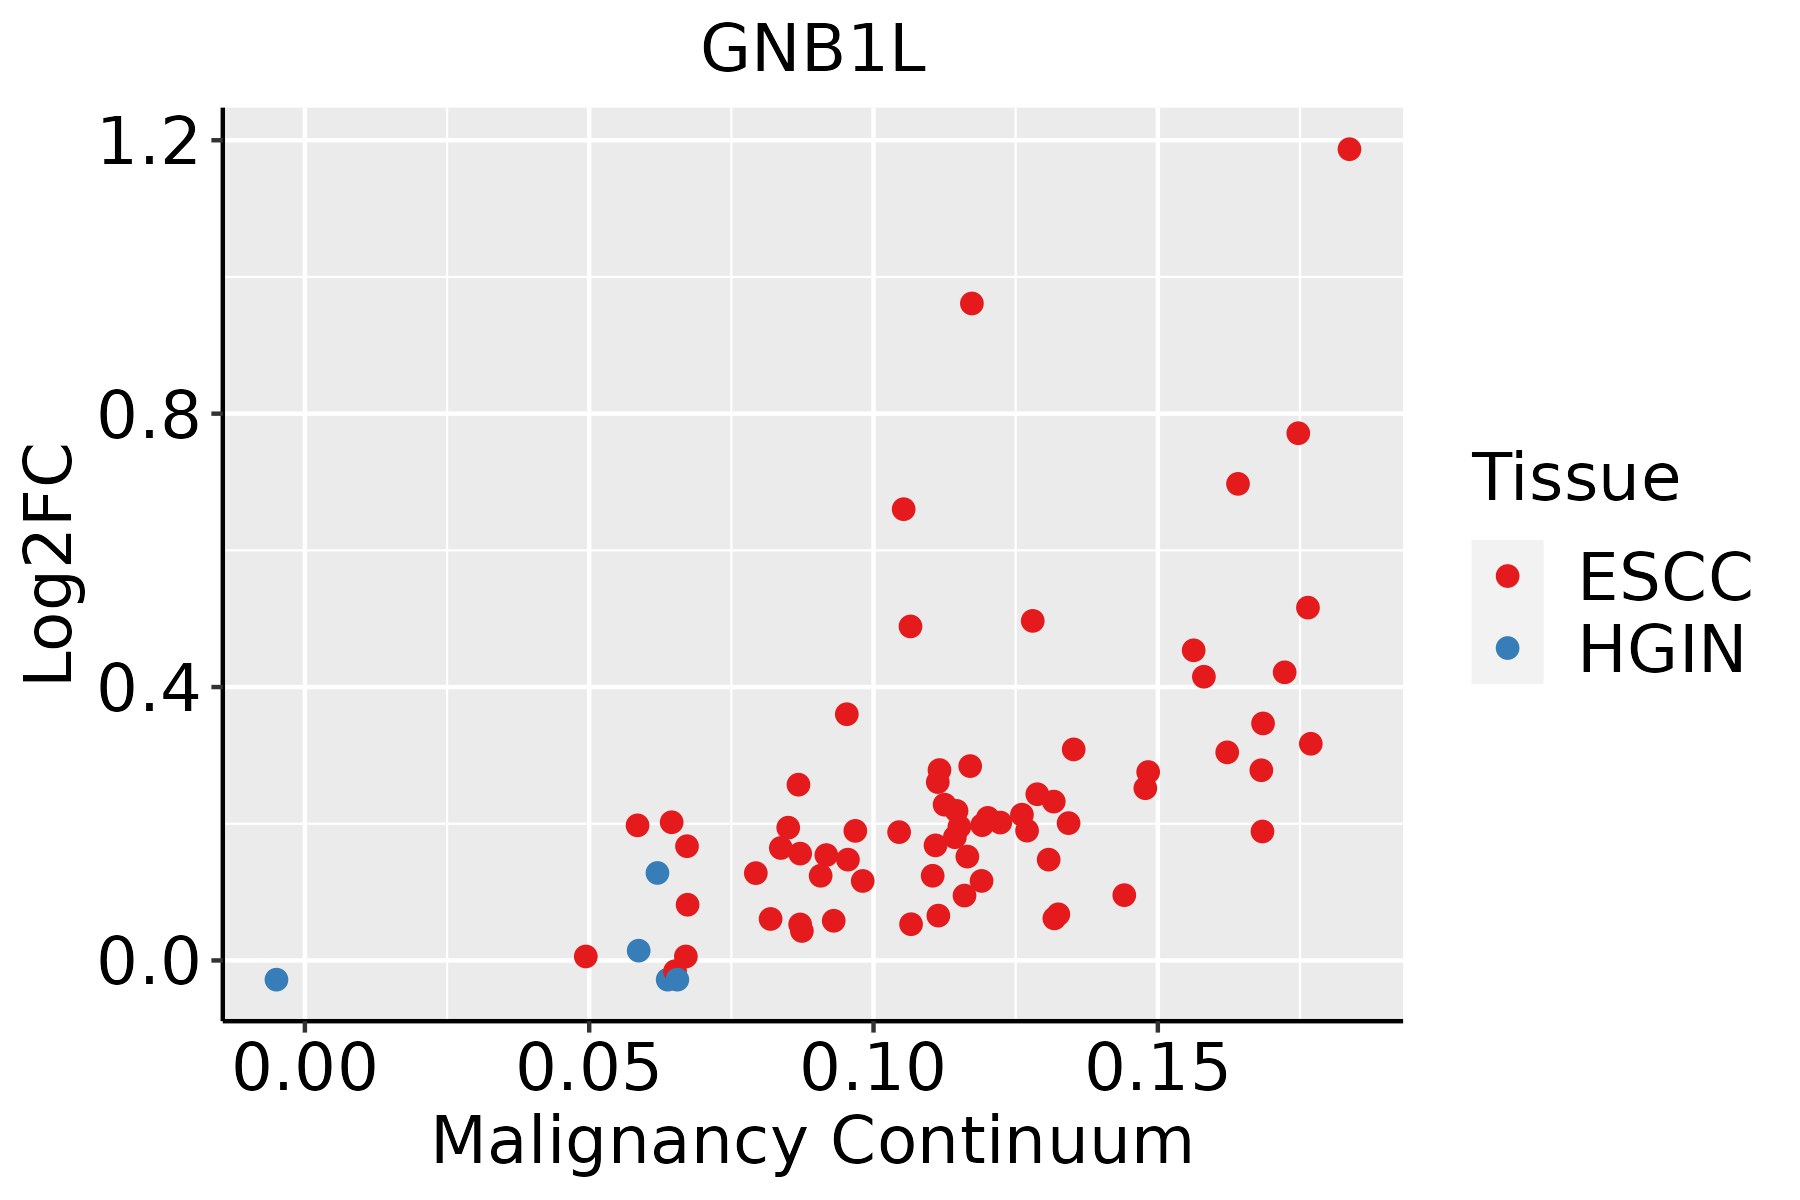 | ESCC: Esophageal squamous cell carcinoma |
| HGIN: High-grade intraepithelial neoplasias | ||
| LGIN: Low-grade intraepithelial neoplasias | ||
| Oral Cavity | 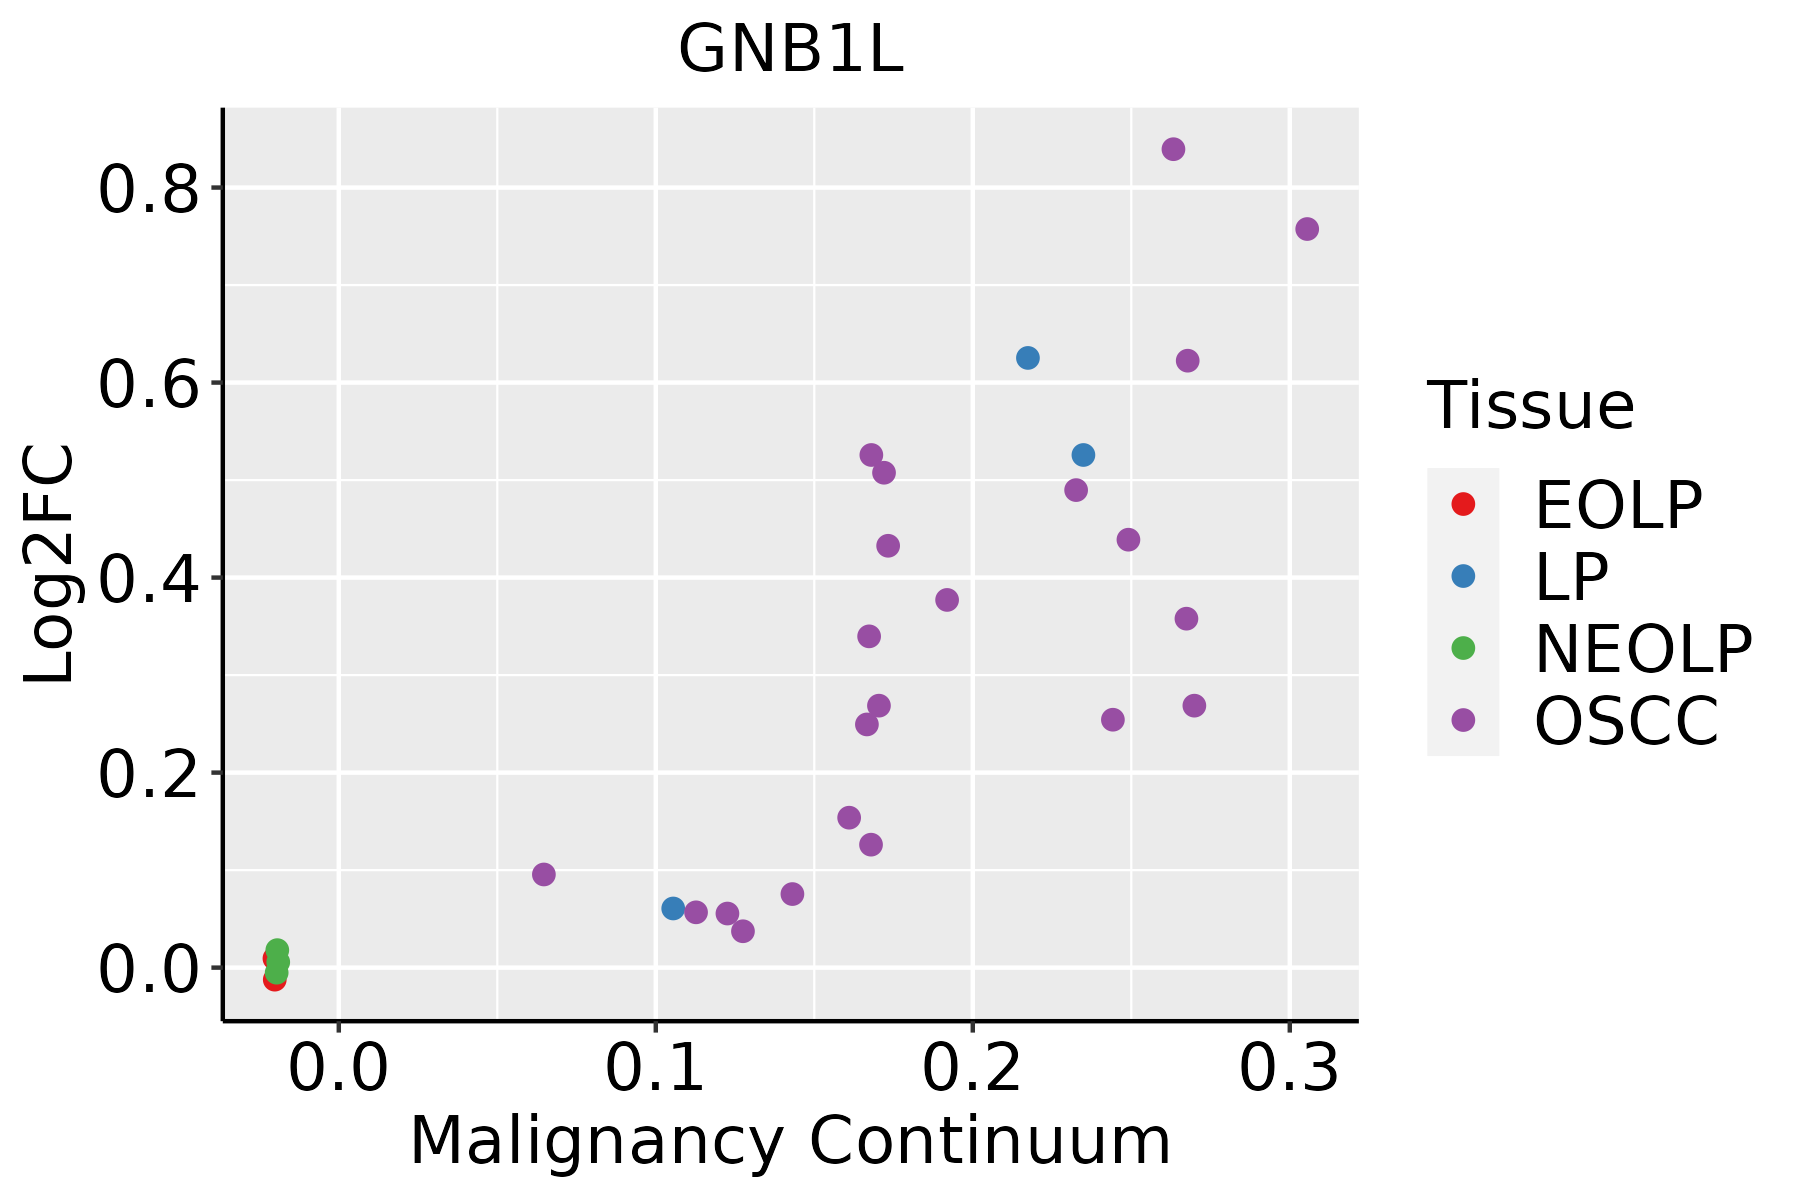 | EOLP: Erosive Oral lichen planus |
| LP: leukoplakia | ||
| NEOLP: Non-erosive oral lichen planus | ||
| OSCC: Oral squamous cell carcinoma |
| ∗log2FC in expression of this searched gene in stem-like cells from each diseased tissue sample relative to stem-like cells in normal samples in each tissue plotted against the malignancy continuum. Samples are colored based on if they are from different disease stage. |
Top |
Malignant transformation related pathway analysis |
| Find out the enriched GO biological processes and KEGG pathways involved in transition from healthy to precancer to cancer |
| Tissue | Disease Stage | Enriched GO biological Processes |
| Colorectum | AD |  |
| Colorectum | SER |  |
| Colorectum | MSS |  |
| Colorectum | MSI-H |  |
| Colorectum | FAP |  |
| ∗Top 15 enriched GO BP terms are showed in the bar plot of each disease state in each tissue. Each row represents a significant GO biological process which is colored according to the -log10(p.adjust). |
| Page: 1 2 3 4 5 6 7 8 9 |
| GO ID | Tissue | Disease Stage | Description | Gene Ratio | Bg Ratio | pvalue | p.adjust | Count |
| Page: 1 |
| Pathway ID | Tissue | Disease Stage | Description | Gene Ratio | Bg Ratio | pvalue | p.adjust | qvalue | Count |
| Page: 1 |
Top |
Cell-cell communication analysis |
| Identification of potential cell-cell interactions between two cell types and their ligand-receptor pairs for different disease states |
| Ligand | Receptor | LRpair | Pathway | Tissue | Disease Stage |
| Page: 1 |
Top |
Single-cell gene regulatory network inference analysis |
| Find out the significant the regulons (TFs) and the target genes of each regulon across cell types for different disease states |
| TF | Cell Type | Tissue | Disease Stage | Target Gene | RSS | Regulon Activity |
| ∗The dot plots of a searched regulon are shown for all cell subpopulations in each disease state of each tissue based on the regulon specific score inferred using pySCENIC and by calculating the average expression. |
| Page: 1 |
Top |
Somatic mutation of malignant transformation related genes |
| Annotation of somatic variants for genes involved in malignant transformation |
| Hugo Symbol | Variant Class | Variant Classification | dbSNP RS | HGVSc | HGVSp | HGVSp Short | SWISSPROT | BIOTYPE | SIFT | PolyPhen | Tumor Sample Barcode | Tissue | Histology | Sex | Age | Stage | Therapy Types | Drugs | Outcome |
| GNB1L | SNV | Missense_Mutation | c.62N>T | p.Ser21Leu | p.S21L | Q9BYB4 | protein_coding | deleterious(0.02) | benign(0.438) | TCGA-AC-A23H-01 | Breast | breast invasive carcinoma | Female | >=65 | I/II | Unknown | Unknown | PD | |
| GNB1L | insertion | In_Frame_Ins | novel | c.419_420insCCTCATGAGAGCGAGACCGGATGGGCCTGTGCA | p.Val140_Gln141insLeuMetArgAlaArgProAspGlyProValHis | p.V140_Q141insLMRARPDGPVH | Q9BYB4 | protein_coding | TCGA-BH-A0H7-01 | Breast | breast invasive carcinoma | Female | >=65 | III/IV | Chemotherapy | doxorubicin | SD | ||
| GNB1L | SNV | Missense_Mutation | novel | c.890N>T | p.Ala297Val | p.A297V | Q9BYB4 | protein_coding | tolerated(0.15) | benign(0.006) | TCGA-2W-A8YY-01 | Cervix | cervical & endocervical cancer | Female | <65 | I/II | Chemotherapy | cisplatin | CR |
| GNB1L | SNV | Missense_Mutation | novel | c.547N>A | p.Ala183Thr | p.A183T | Q9BYB4 | protein_coding | deleterious(0.03) | possibly_damaging(0.878) | TCGA-VS-A9V2-01 | Cervix | cervical & endocervical cancer | Female | <65 | I/II | Unknown | Unknown | SD |
| GNB1L | SNV | Missense_Mutation | rs371832244 | c.737N>A | p.Arg246His | p.R246H | Q9BYB4 | protein_coding | tolerated(0.59) | benign(0.018) | TCGA-A6-3809-01 | Colorectum | colon adenocarcinoma | Female | >=65 | I/II | Unknown | Unknown | SD |
| GNB1L | SNV | Missense_Mutation | rs751815278 | c.379N>T | p.Arg127Cys | p.R127C | Q9BYB4 | protein_coding | tolerated(0.11) | benign(0.001) | TCGA-A6-6140-01 | Colorectum | colon adenocarcinoma | Male | <65 | I/II | Chemotherapy | oxaliplatin | SD |
| GNB1L | SNV | Missense_Mutation | rs572852392 | c.532C>T | p.Arg178Cys | p.R178C | Q9BYB4 | protein_coding | tolerated(0.1) | benign(0.003) | TCGA-AA-3833-01 | Colorectum | colon adenocarcinoma | Female | <65 | I/II | Unknown | Unknown | SD |
| GNB1L | SNV | Missense_Mutation | novel | c.258N>T | p.Gln86His | p.Q86H | Q9BYB4 | protein_coding | tolerated(0.09) | benign(0.168) | TCGA-AA-3877-01 | Colorectum | colon adenocarcinoma | Female | >=65 | I/II | Unknown | Unknown | SD |
| GNB1L | SNV | Missense_Mutation | rs765685532 | c.227N>T | p.Thr76Met | p.T76M | Q9BYB4 | protein_coding | tolerated(0.13) | benign(0.02) | TCGA-AA-3966-01 | Colorectum | colon adenocarcinoma | Female | >=65 | I/II | Unknown | Unknown | SD |
| GNB1L | SNV | Missense_Mutation | rs781497461 | c.203G>A | p.Gly68Asp | p.G68D | Q9BYB4 | protein_coding | deleterious(0) | probably_damaging(0.991) | TCGA-AA-3984-01 | Colorectum | colon adenocarcinoma | Female | <65 | I/II | Unknown | Unknown | SD |
| Page: 1 2 3 4 5 |
Top |
Related drugs of malignant transformation related genes |
| Identification of chemicals and drugs interact with genes involved in malignant transfromation |
| (DGIdb 4.0) |
| Entrez ID | Symbol | Category | Interaction Types | Drug Claim Name | Drug Name | PMIDs |
| Page: 1 |

Copyright 2023-Present -The University of Texas Health Science Center at Houston |