
|
|||||
|
 | |
| |
| |
| |
| |
| |
|
Gene: GNB1 |
Gene summary for GNB1 |
| Gene information | Species | Human | Gene symbol | GNB1 | Gene ID | 2782 |
| Gene name | G protein subunit beta 1 | |
| Gene Alias | MDS | |
| Cytomap | 1p36.33 | |
| Gene Type | protein-coding | GO ID | GO:0001654 | UniProtAcc | B3KVK2 |
Top |
Malignant transformation analysis |
| Identification of the aberrant gene expression in precancerous and cancerous lesions by comparing the gene expression of stem-like cells in diseased tissues with normal stem cells |
| Entrez ID | Symbol | Replicates | Species | Organ | Tissue | Adj P-value | Log2FC | Malignancy |
| 2782 | GNB1 | CA_HPV_1 | Human | Cervix | CC | 4.38e-05 | 4.17e-02 | 0.0264 |
| 2782 | GNB1 | CCI_1 | Human | Cervix | CC | 7.19e-09 | 8.60e-01 | 0.528 |
| 2782 | GNB1 | CCI_2 | Human | Cervix | CC | 3.76e-10 | 1.40e+00 | 0.5249 |
| 2782 | GNB1 | CCI_3 | Human | Cervix | CC | 5.07e-22 | 1.29e+00 | 0.516 |
| 2782 | GNB1 | HTA11_2487_2000001011 | Human | Colorectum | SER | 1.06e-03 | 5.82e-01 | -0.1808 |
| 2782 | GNB1 | HTA11_1938_2000001011 | Human | Colorectum | AD | 4.37e-05 | 5.78e-01 | -0.0811 |
| 2782 | GNB1 | HTA11_347_2000001011 | Human | Colorectum | AD | 1.30e-13 | 6.90e-01 | -0.1954 |
| 2782 | GNB1 | HTA11_411_2000001011 | Human | Colorectum | SER | 6.45e-07 | 9.30e-01 | -0.2602 |
| 2782 | GNB1 | HTA11_696_2000001011 | Human | Colorectum | AD | 5.12e-04 | 4.57e-01 | -0.1464 |
| 2782 | GNB1 | HTA11_1391_2000001011 | Human | Colorectum | AD | 9.13e-07 | 7.40e-01 | -0.059 |
| 2782 | GNB1 | HTA11_99999965062_69753 | Human | Colorectum | MSI-H | 1.05e-10 | 1.06e+00 | 0.3487 |
| 2782 | GNB1 | HTA11_99999971662_82457 | Human | Colorectum | MSS | 1.46e-04 | 6.52e-01 | 0.3859 |
| 2782 | GNB1 | F007 | Human | Colorectum | FAP | 9.00e-06 | -4.33e-01 | 0.1176 |
| 2782 | GNB1 | A002-C-010 | Human | Colorectum | FAP | 1.28e-06 | -2.85e-01 | 0.242 |
| 2782 | GNB1 | A001-C-207 | Human | Colorectum | FAP | 3.57e-04 | -2.39e-01 | 0.1278 |
| 2782 | GNB1 | A015-C-203 | Human | Colorectum | FAP | 1.23e-32 | -4.03e-01 | -0.1294 |
| 2782 | GNB1 | A015-C-204 | Human | Colorectum | FAP | 1.92e-06 | -3.27e-01 | -0.0228 |
| 2782 | GNB1 | A014-C-040 | Human | Colorectum | FAP | 1.45e-05 | -3.76e-01 | -0.1184 |
| 2782 | GNB1 | A002-C-201 | Human | Colorectum | FAP | 9.74e-16 | -3.00e-01 | 0.0324 |
| 2782 | GNB1 | A002-C-203 | Human | Colorectum | FAP | 1.71e-07 | -2.53e-01 | 0.2786 |
| Page: 1 2 3 4 5 6 7 8 9 10 |
| Tissue | Expression Dynamics | Abbreviation |
| Cervix |  | CC: Cervix cancer |
| HSIL_HPV: HPV-infected high-grade squamous intraepithelial lesions | ||
| N_HPV: HPV-infected normal cervix | ||
| Colorectum (GSE201348) |  | FAP: Familial adenomatous polyposis |
| CRC: Colorectal cancer | ||
| Colorectum (HTA11) |  | AD: Adenomas |
| SER: Sessile serrated lesions | ||
| MSI-H: Microsatellite-high colorectal cancer | ||
| MSS: Microsatellite stable colorectal cancer | ||
| Esophagus | 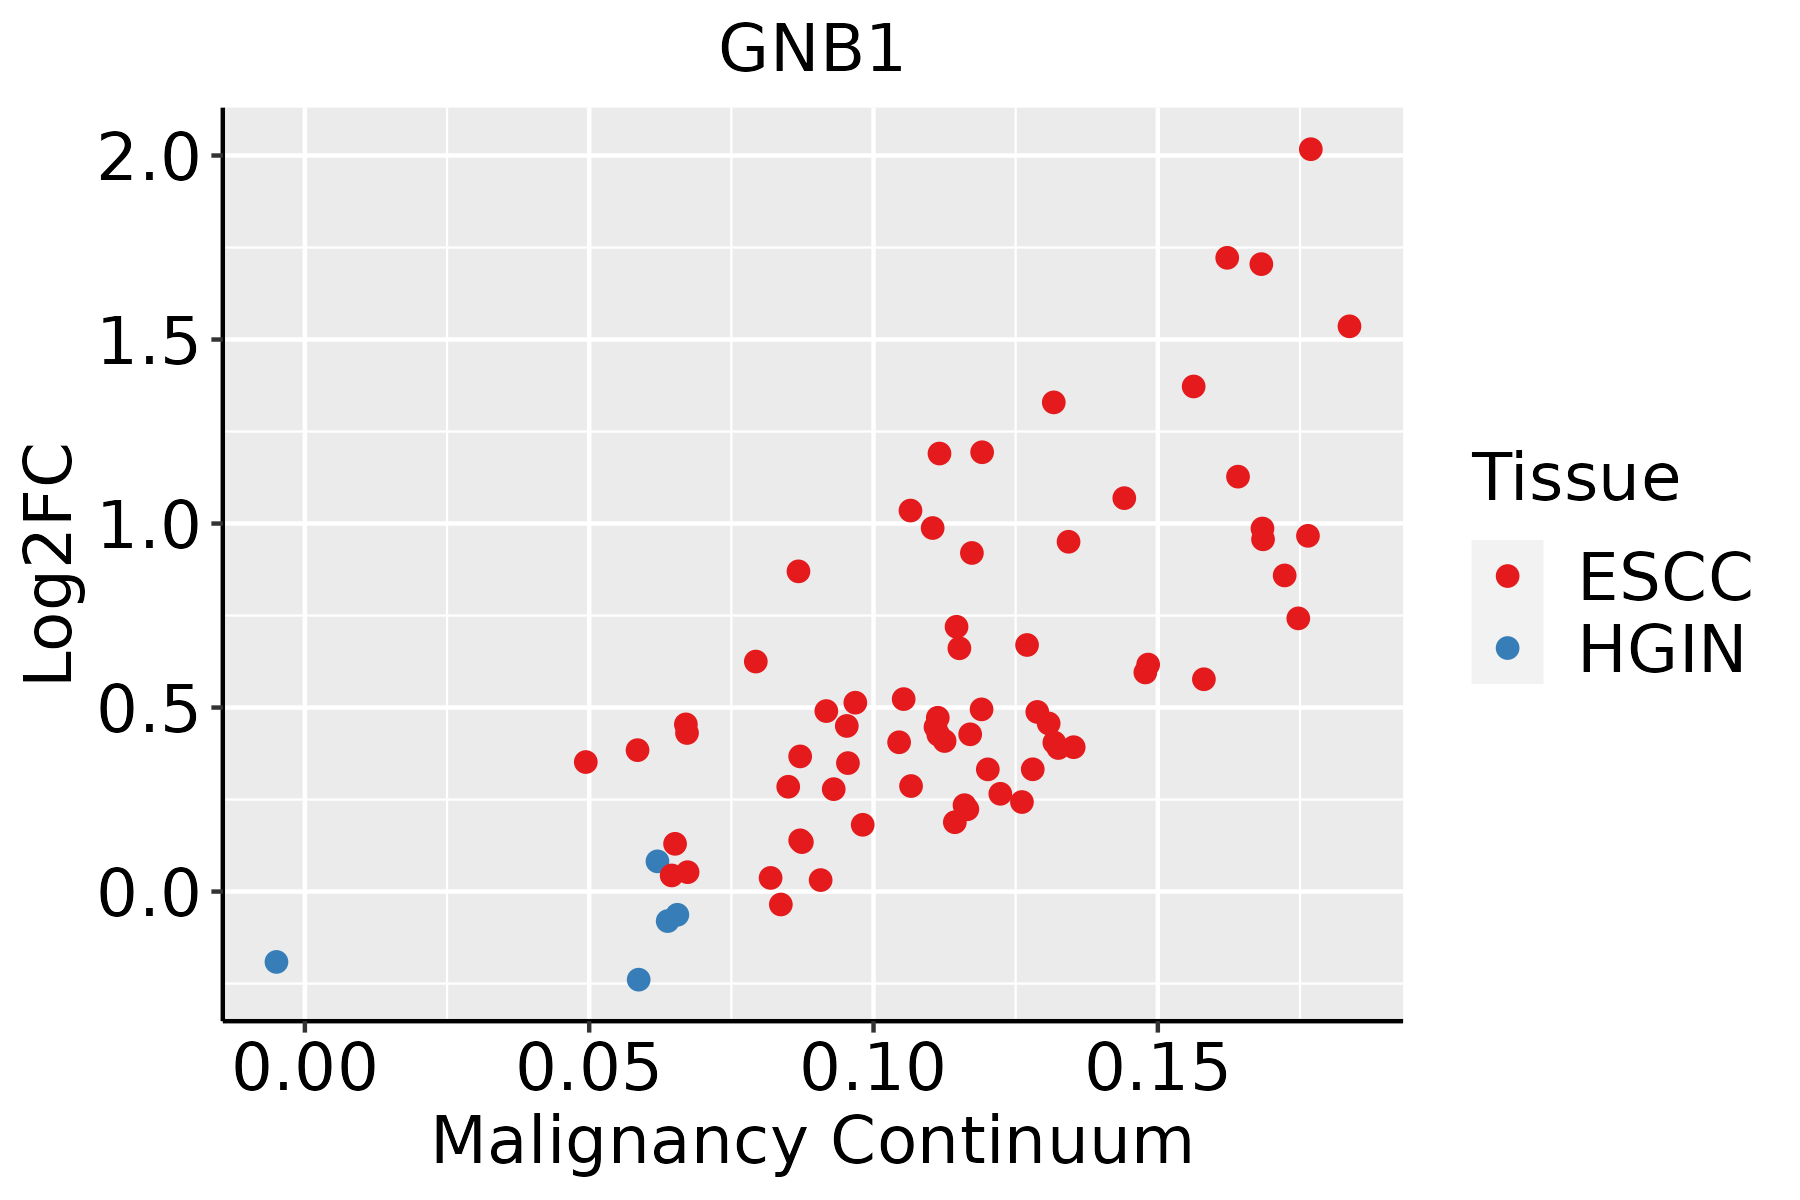 | ESCC: Esophageal squamous cell carcinoma |
| HGIN: High-grade intraepithelial neoplasias | ||
| LGIN: Low-grade intraepithelial neoplasias | ||
| Liver |  | HCC: Hepatocellular carcinoma |
| NAFLD: Non-alcoholic fatty liver disease | ||
| Oral Cavity |  | EOLP: Erosive Oral lichen planus |
| LP: leukoplakia | ||
| NEOLP: Non-erosive oral lichen planus | ||
| OSCC: Oral squamous cell carcinoma | ||
| Prostate | 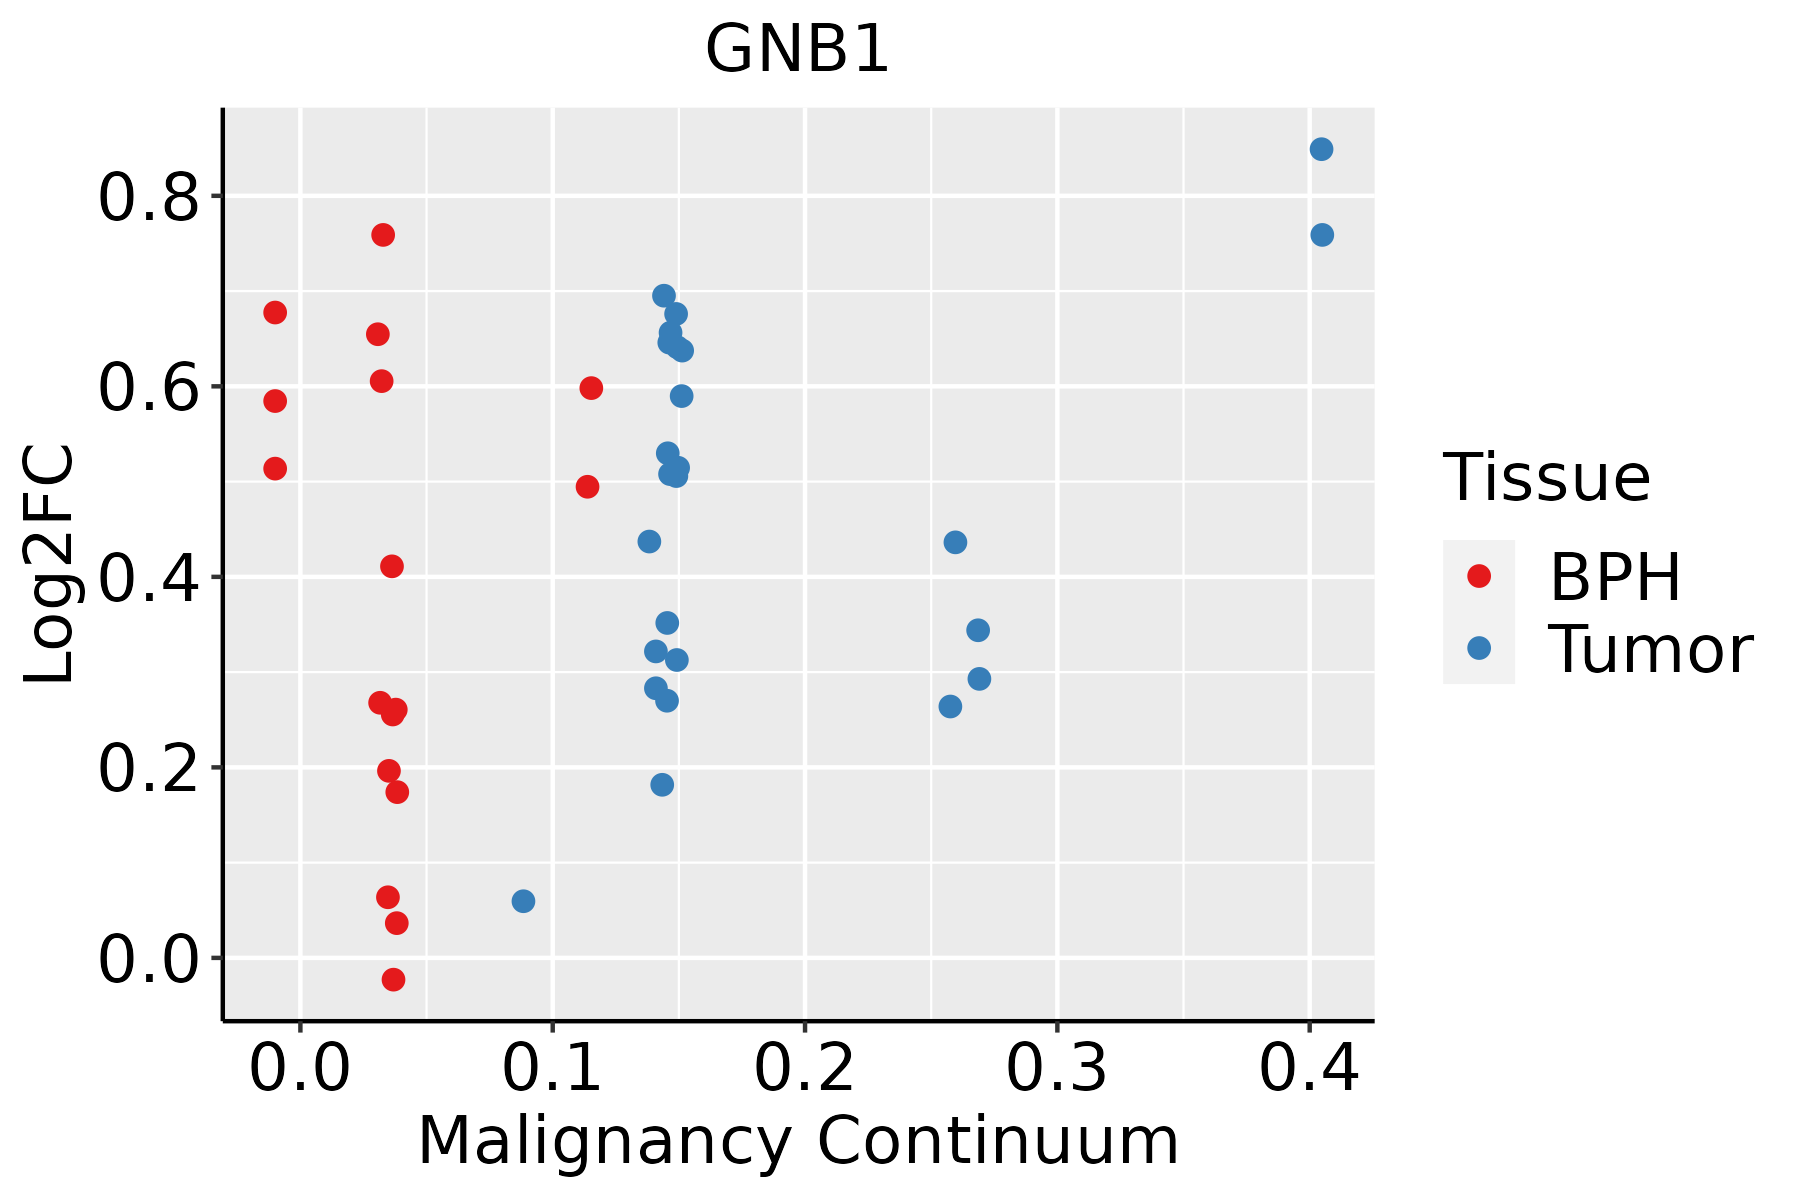 | BPH: Benign Prostatic Hyperplasia |
| Skin | 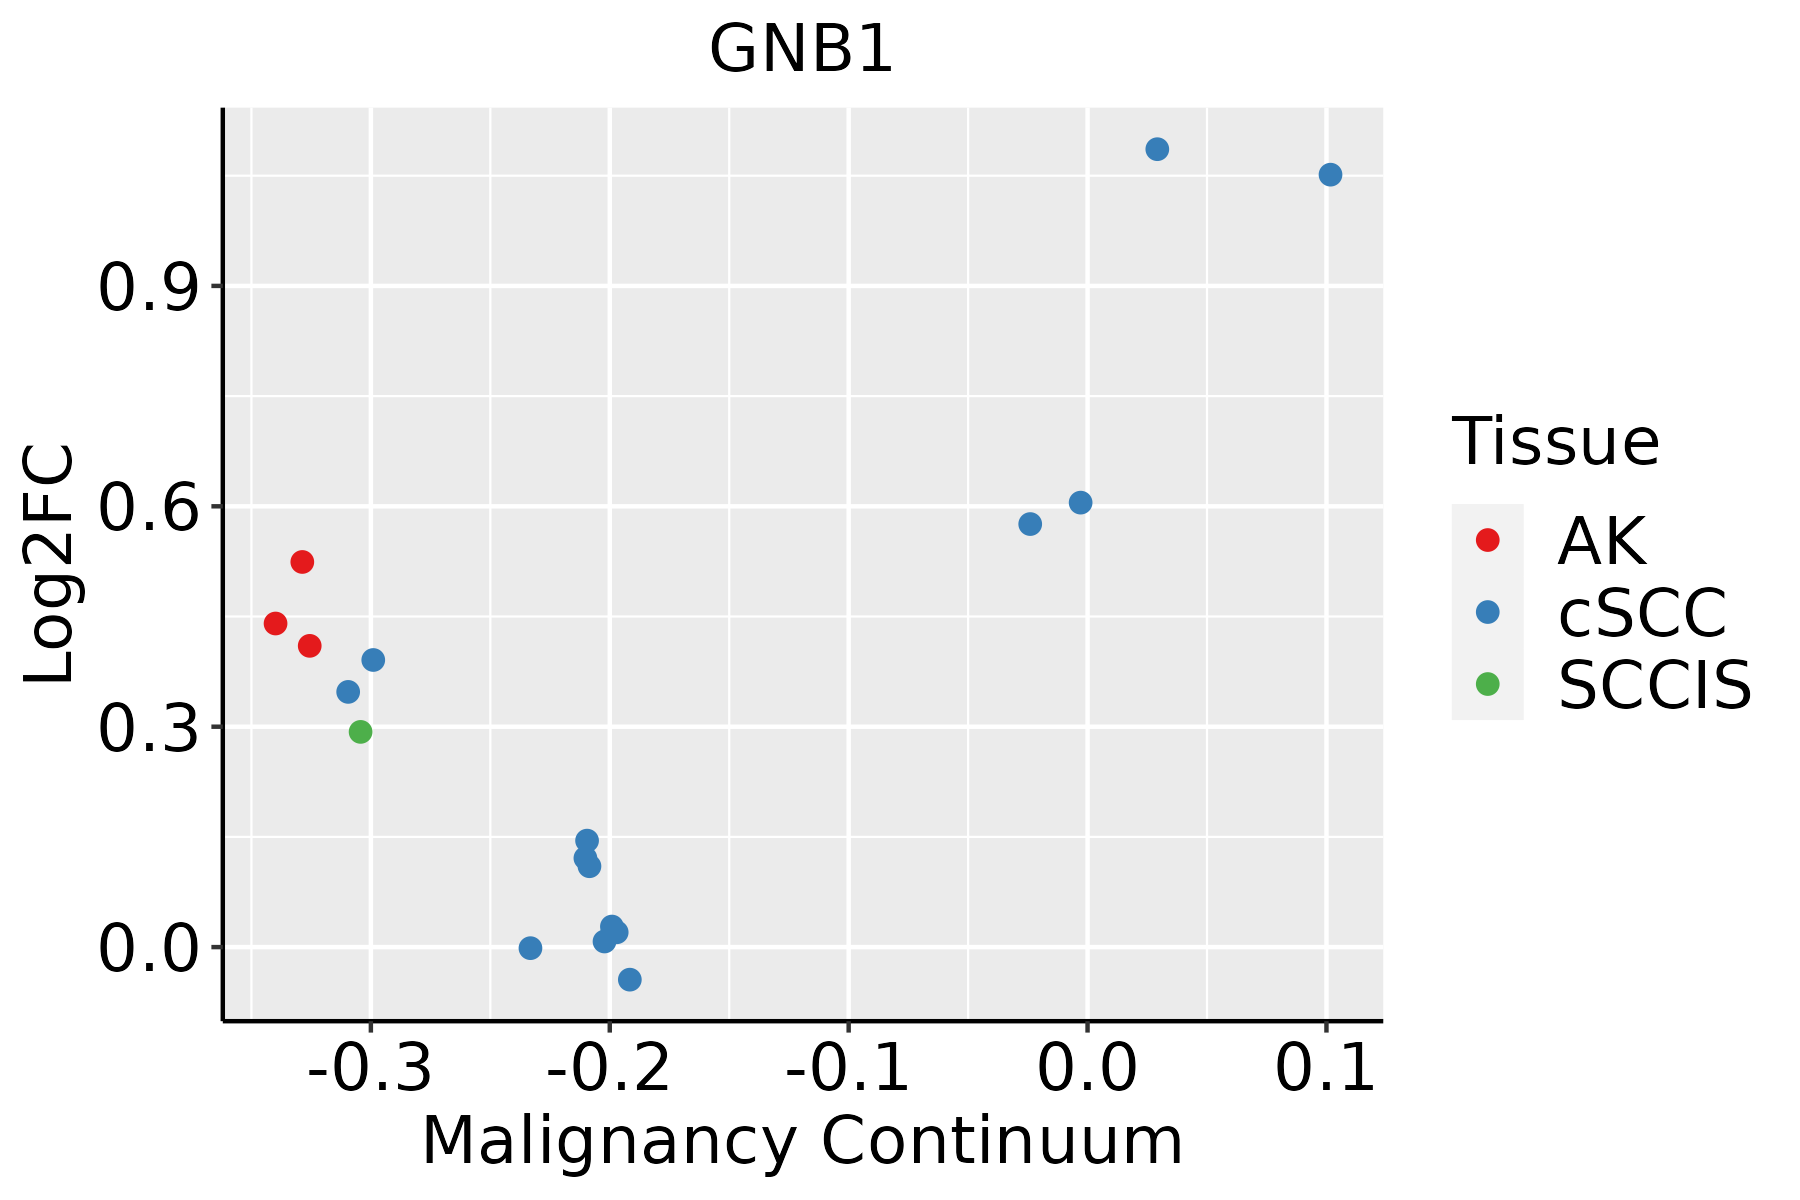 | AK: Actinic keratosis |
| cSCC: Cutaneous squamous cell carcinoma | ||
| SCCIS:squamous cell carcinoma in situ | ||
| Thyroid | 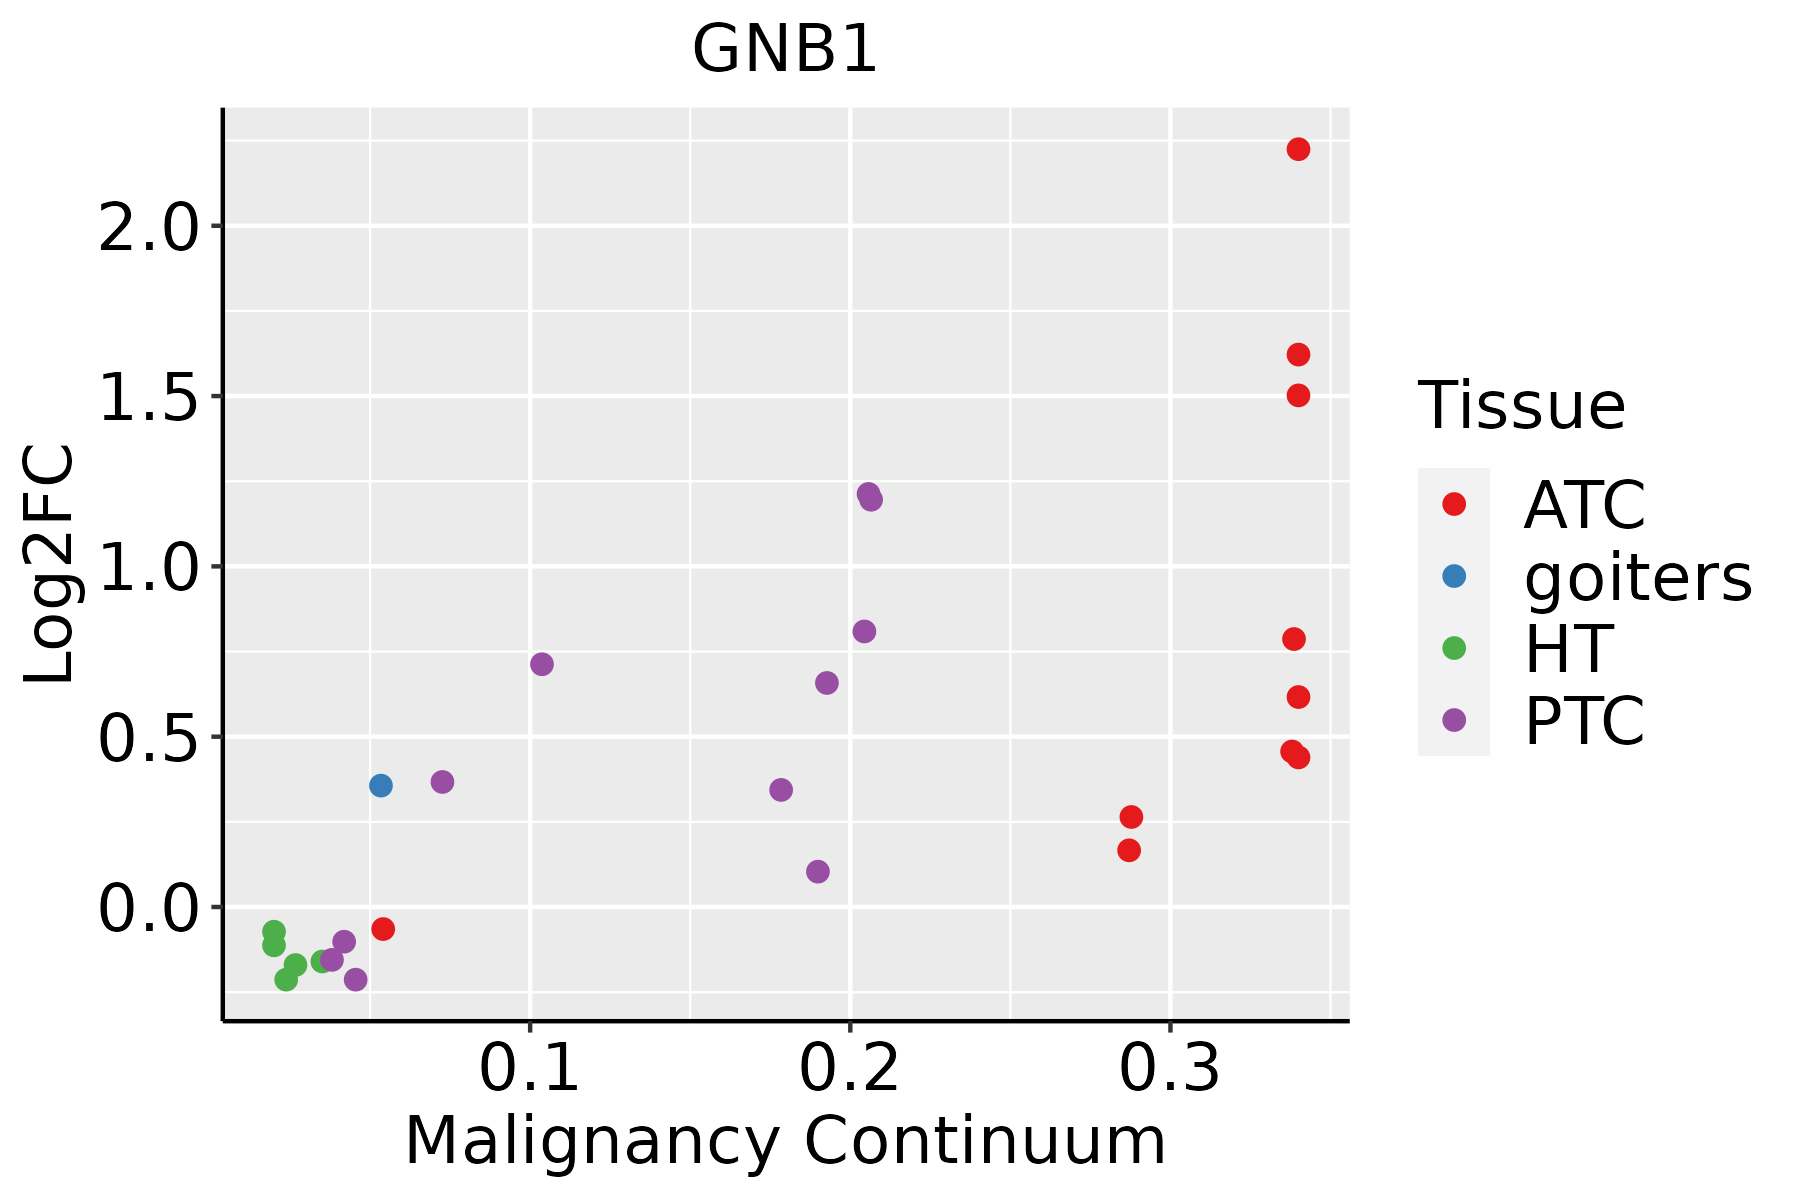 | ATC: Anaplastic thyroid cancer |
| HT: Hashimoto's thyroiditis | ||
| PTC: Papillary thyroid cancer |
| ∗log2FC in expression of this searched gene in stem-like cells from each diseased tissue sample relative to stem-like cells in normal samples in each tissue plotted against the malignancy continuum. Samples are colored based on if they are from different disease stage. |
Top |
Malignant transformation related pathway analysis |
| Find out the enriched GO biological processes and KEGG pathways involved in transition from healthy to precancer to cancer |
| Tissue | Disease Stage | Enriched GO biological Processes |
| Colorectum | AD |  |
| Colorectum | SER |  |
| Colorectum | MSS |  |
| Colorectum | MSI-H |  |
| Colorectum | FAP |  |
| ∗Top 15 enriched GO BP terms are showed in the bar plot of each disease state in each tissue. Each row represents a significant GO biological process which is colored according to the -log10(p.adjust). |
| Page: 1 2 3 4 5 6 7 8 9 |
| GO ID | Tissue | Disease Stage | Description | Gene Ratio | Bg Ratio | pvalue | p.adjust | Count |
| GO:00072656 | Cervix | CC | Ras protein signal transduction | 79/2311 | 337/18723 | 9.49e-09 | 7.77e-07 | 79 |
| GO:190165410 | Cervix | CC | response to ketone | 45/2311 | 194/18723 | 1.83e-05 | 3.44e-04 | 45 |
| GO:000166610 | Cervix | CC | response to hypoxia | 61/2311 | 307/18723 | 1.04e-04 | 1.34e-03 | 61 |
| GO:007048210 | Cervix | CC | response to oxygen levels | 67/2311 | 347/18723 | 1.21e-04 | 1.51e-03 | 67 |
| GO:003629310 | Cervix | CC | response to decreased oxygen levels | 62/2311 | 322/18723 | 2.29e-04 | 2.57e-03 | 62 |
| GO:00714539 | Cervix | CC | cellular response to oxygen levels | 38/2311 | 177/18723 | 4.23e-04 | 4.27e-03 | 38 |
| GO:00362949 | Cervix | CC | cellular response to decreased oxygen levels | 35/2311 | 161/18723 | 5.49e-04 | 5.29e-03 | 35 |
| GO:00714566 | Cervix | CC | cellular response to hypoxia | 33/2311 | 151/18723 | 7.06e-04 | 6.41e-03 | 33 |
| GO:00973059 | Cervix | CC | response to alcohol | 46/2311 | 253/18723 | 4.40e-03 | 2.69e-02 | 46 |
| GO:0150063 | Cervix | CC | visual system development | 63/2311 | 375/18723 | 6.58e-03 | 3.65e-02 | 63 |
| GO:0001654 | Cervix | CC | eye development | 62/2311 | 371/18723 | 7.83e-03 | 4.13e-02 | 62 |
| GO:0048880 | Cervix | CC | sensory system development | 63/2311 | 381/18723 | 9.29e-03 | 4.66e-02 | 63 |
| GO:1905144 | Cervix | CC | response to acetylcholine | 9/2311 | 31/18723 | 1.04e-02 | 4.97e-02 | 9 |
| GO:1905145 | Cervix | CC | cellular response to acetylcholine | 9/2311 | 31/18723 | 1.04e-02 | 4.97e-02 | 9 |
| GO:0007265 | Colorectum | AD | Ras protein signal transduction | 104/3918 | 337/18723 | 1.01e-05 | 2.35e-04 | 104 |
| GO:0070482 | Colorectum | AD | response to oxygen levels | 99/3918 | 347/18723 | 4.29e-04 | 4.82e-03 | 99 |
| GO:0071453 | Colorectum | AD | cellular response to oxygen levels | 55/3918 | 177/18723 | 9.48e-04 | 8.96e-03 | 55 |
| GO:1901654 | Colorectum | AD | response to ketone | 59/3918 | 194/18723 | 1.14e-03 | 1.04e-02 | 59 |
| GO:0001666 | Colorectum | AD | response to hypoxia | 86/3918 | 307/18723 | 1.77e-03 | 1.46e-02 | 86 |
| GO:0036293 | Colorectum | AD | response to decreased oxygen levels | 88/3918 | 322/18723 | 3.42e-03 | 2.49e-02 | 88 |
| Page: 1 2 3 4 5 6 7 8 9 10 |
| Pathway ID | Tissue | Disease Stage | Description | Gene Ratio | Bg Ratio | pvalue | p.adjust | qvalue | Count |
| hsa0516720 | Cervix | CC | Kaposi sarcoma-associated herpesvirus infection | 60/1267 | 194/8465 | 9.74e-09 | 1.58e-07 | 9.33e-08 | 60 |
| hsa0516318 | Cervix | CC | Human cytomegalovirus infection | 65/1267 | 225/8465 | 4.59e-08 | 6.47e-07 | 3.83e-07 | 65 |
| hsa0472318 | Cervix | CC | Retrograde endocannabinoid signaling | 42/1267 | 148/8465 | 1.79e-05 | 1.42e-04 | 8.40e-05 | 42 |
| hsa0517016 | Cervix | CC | Human immunodeficiency virus 1 infection | 55/1267 | 212/8465 | 1.80e-05 | 1.42e-04 | 8.40e-05 | 55 |
| hsa040142 | Cervix | CC | Ras signaling pathway | 51/1267 | 236/8465 | 3.55e-03 | 1.34e-02 | 7.91e-03 | 51 |
| hsa04062 | Cervix | CC | Chemokine signaling pathway | 43/1267 | 192/8465 | 3.60e-03 | 1.34e-02 | 7.91e-03 | 43 |
| hsa049265 | Cervix | CC | Relaxin signaling pathway | 30/1267 | 129/8465 | 7.92e-03 | 2.56e-02 | 1.51e-02 | 30 |
| hsa05167110 | Cervix | CC | Kaposi sarcoma-associated herpesvirus infection | 60/1267 | 194/8465 | 9.74e-09 | 1.58e-07 | 9.33e-08 | 60 |
| hsa0516319 | Cervix | CC | Human cytomegalovirus infection | 65/1267 | 225/8465 | 4.59e-08 | 6.47e-07 | 3.83e-07 | 65 |
| hsa0472319 | Cervix | CC | Retrograde endocannabinoid signaling | 42/1267 | 148/8465 | 1.79e-05 | 1.42e-04 | 8.40e-05 | 42 |
| hsa0517017 | Cervix | CC | Human immunodeficiency virus 1 infection | 55/1267 | 212/8465 | 1.80e-05 | 1.42e-04 | 8.40e-05 | 55 |
| hsa0401411 | Cervix | CC | Ras signaling pathway | 51/1267 | 236/8465 | 3.55e-03 | 1.34e-02 | 7.91e-03 | 51 |
| hsa040621 | Cervix | CC | Chemokine signaling pathway | 43/1267 | 192/8465 | 3.60e-03 | 1.34e-02 | 7.91e-03 | 43 |
| hsa0492613 | Cervix | CC | Relaxin signaling pathway | 30/1267 | 129/8465 | 7.92e-03 | 2.56e-02 | 1.51e-02 | 30 |
| hsa04723 | Colorectum | AD | Retrograde endocannabinoid signaling | 59/2092 | 148/8465 | 2.94e-05 | 2.73e-04 | 1.74e-04 | 59 |
| hsa05170 | Colorectum | AD | Human immunodeficiency virus 1 infection | 72/2092 | 212/8465 | 1.40e-03 | 8.46e-03 | 5.39e-03 | 72 |
| hsa05163 | Colorectum | AD | Human cytomegalovirus infection | 75/2092 | 225/8465 | 2.00e-03 | 1.10e-02 | 7.01e-03 | 75 |
| hsa04728 | Colorectum | AD | Dopaminergic synapse | 46/2092 | 132/8465 | 5.55e-03 | 2.48e-02 | 1.58e-02 | 46 |
| hsa047231 | Colorectum | AD | Retrograde endocannabinoid signaling | 59/2092 | 148/8465 | 2.94e-05 | 2.73e-04 | 1.74e-04 | 59 |
| hsa051701 | Colorectum | AD | Human immunodeficiency virus 1 infection | 72/2092 | 212/8465 | 1.40e-03 | 8.46e-03 | 5.39e-03 | 72 |
| Page: 1 2 3 4 5 6 7 8 |
Top |
Cell-cell communication analysis |
| Identification of potential cell-cell interactions between two cell types and their ligand-receptor pairs for different disease states |
| Ligand | Receptor | LRpair | Pathway | Tissue | Disease Stage |
| Page: 1 |
Top |
Single-cell gene regulatory network inference analysis |
| Find out the significant the regulons (TFs) and the target genes of each regulon across cell types for different disease states |
| TF | Cell Type | Tissue | Disease Stage | Target Gene | RSS | Regulon Activity |
| ∗The dot plots of a searched regulon are shown for all cell subpopulations in each disease state of each tissue based on the regulon specific score inferred using pySCENIC and by calculating the average expression. |
| Page: 1 |
Top |
Somatic mutation of malignant transformation related genes |
| Annotation of somatic variants for genes involved in malignant transformation |
| Hugo Symbol | Variant Class | Variant Classification | dbSNP RS | HGVSc | HGVSp | HGVSp Short | SWISSPROT | BIOTYPE | SIFT | PolyPhen | Tumor Sample Barcode | Tissue | Histology | Sex | Age | Stage | Therapy Types | Drugs | Outcome |
| GNB1 | SNV | Missense_Mutation | c.806N>C | p.Ile269Thr | p.I269T | P62873 | protein_coding | deleterious(0) | probably_damaging(0.984) | TCGA-BH-A0HN-01 | Breast | breast invasive carcinoma | Female | >=65 | I/II | Hormone Therapy | arimidex | SD | |
| GNB1 | insertion | Frame_Shift_Ins | novel | c.644_645insTTAC | p.Glu215AspfsTer15 | p.E215Dfs*15 | P62873 | protein_coding | TCGA-B6-A0IK-01 | Breast | breast invasive carcinoma | Female | <65 | III/IV | Unknown | Unknown | PD | ||
| GNB1 | SNV | Missense_Mutation | novel | c.283N>G | p.Leu95Val | p.L95V | P62873 | protein_coding | deleterious(0.01) | possibly_damaging(0.566) | TCGA-EA-A3Y4-01 | Cervix | cervical & endocervical cancer | Female | <65 | I/II | Unknown | Unknown | SD |
| GNB1 | SNV | Missense_Mutation | novel | c.208N>G | p.Leu70Val | p.L70V | P62873 | protein_coding | tolerated(0.12) | benign(0.061) | TCGA-VS-A94Z-01 | Cervix | cervical & endocervical cancer | Female | <65 | I/II | Chemotherapy | cisplatin | CR |
| GNB1 | SNV | Missense_Mutation | c.287G>A | p.Arg96His | p.R96H | P62873 | protein_coding | tolerated(0.06) | benign(0.117) | TCGA-A6-6781-01 | Colorectum | colon adenocarcinoma | Male | <65 | III/IV | Chemotherapy | oxaliplatin | SD | |
| GNB1 | SNV | Missense_Mutation | c.946N>G | p.Ser316Gly | p.S316G | P62873 | protein_coding | deleterious(0) | probably_damaging(0.991) | TCGA-AA-3845-01 | Colorectum | colon adenocarcinoma | Female | >=65 | I/II | Unknown | Unknown | PD | |
| GNB1 | SNV | Missense_Mutation | novel | c.1001N>T | p.Ser334Ile | p.S334I | P62873 | protein_coding | deleterious(0.05) | probably_damaging(0.919) | TCGA-AA-3966-01 | Colorectum | colon adenocarcinoma | Female | >=65 | I/II | Unknown | Unknown | SD |
| GNB1 | SNV | Missense_Mutation | novel | c.785N>C | p.Met262Thr | p.M262T | P62873 | protein_coding | tolerated(0.57) | benign(0.003) | TCGA-CA-6717-01 | Colorectum | colon adenocarcinoma | Male | <65 | I/II | Chemotherapy | oxaliplatin | CR |
| GNB1 | SNV | Missense_Mutation | c.688N>T | p.Asn230Tyr | p.N230Y | P62873 | protein_coding | deleterious(0) | possibly_damaging(0.857) | TCGA-EI-6882-01 | Colorectum | rectum adenocarcinoma | Male | <65 | I/II | Unknown | Unknown | SD | |
| GNB1 | SNV | Missense_Mutation | novel | c.514G>A | p.Glu172Lys | p.E172K | P62873 | protein_coding | deleterious(0.02) | probably_damaging(0.989) | TCGA-F5-6814-01 | Colorectum | rectum adenocarcinoma | Male | <65 | I/II | Unknown | Unknown | SD |
| Page: 1 2 3 4 |
Top |
Related drugs of malignant transformation related genes |
| Identification of chemicals and drugs interact with genes involved in malignant transfromation |
| (DGIdb 4.0) |
| Entrez ID | Symbol | Category | Interaction Types | Drug Claim Name | Drug Name | PMIDs |
| Page: 1 |

Copyright 2023-Present -The University of Texas Health Science Center at Houston |