
|
|||||
|
 | |
| |
| |
| |
| |
| |
|
Gene: GNAZ |
Gene summary for GNAZ |
| Gene information | Species | Human | Gene symbol | GNAZ | Gene ID | 2781 |
| Gene name | G protein subunit alpha z | |
| Gene Alias | gz-alpha | |
| Cytomap | 22q11.22-q11.23 | |
| Gene Type | protein-coding | GO ID | GO:0007154 | UniProtAcc | P19086 |
Top |
Malignant transformation analysis |
| Identification of the aberrant gene expression in precancerous and cancerous lesions by comparing the gene expression of stem-like cells in diseased tissues with normal stem cells |
| Entrez ID | Symbol | Replicates | Species | Organ | Tissue | Adj P-value | Log2FC | Malignancy |
| 2781 | GNAZ | HCC1_Meng | Human | Liver | HCC | 4.58e-11 | 3.26e-02 | 0.0246 |
| 2781 | GNAZ | HCC2 | Human | Liver | HCC | 1.30e-15 | 3.71e+00 | 0.5341 |
| 2781 | GNAZ | S014 | Human | Liver | HCC | 1.27e-04 | 1.74e-01 | 0.2254 |
| 2781 | GNAZ | S015 | Human | Liver | HCC | 7.35e-08 | 2.54e-01 | 0.2375 |
| 2781 | GNAZ | S016 | Human | Liver | HCC | 1.12e-03 | 1.19e-01 | 0.2243 |
| 2781 | GNAZ | S027 | Human | Liver | HCC | 2.78e-14 | 6.43e-01 | 0.2446 |
| 2781 | GNAZ | S028 | Human | Liver | HCC | 5.39e-21 | 5.67e-01 | 0.2503 |
| 2781 | GNAZ | S029 | Human | Liver | HCC | 8.23e-25 | 7.33e-01 | 0.2581 |
| Page: 1 |
| Tissue | Expression Dynamics | Abbreviation |
| Liver | 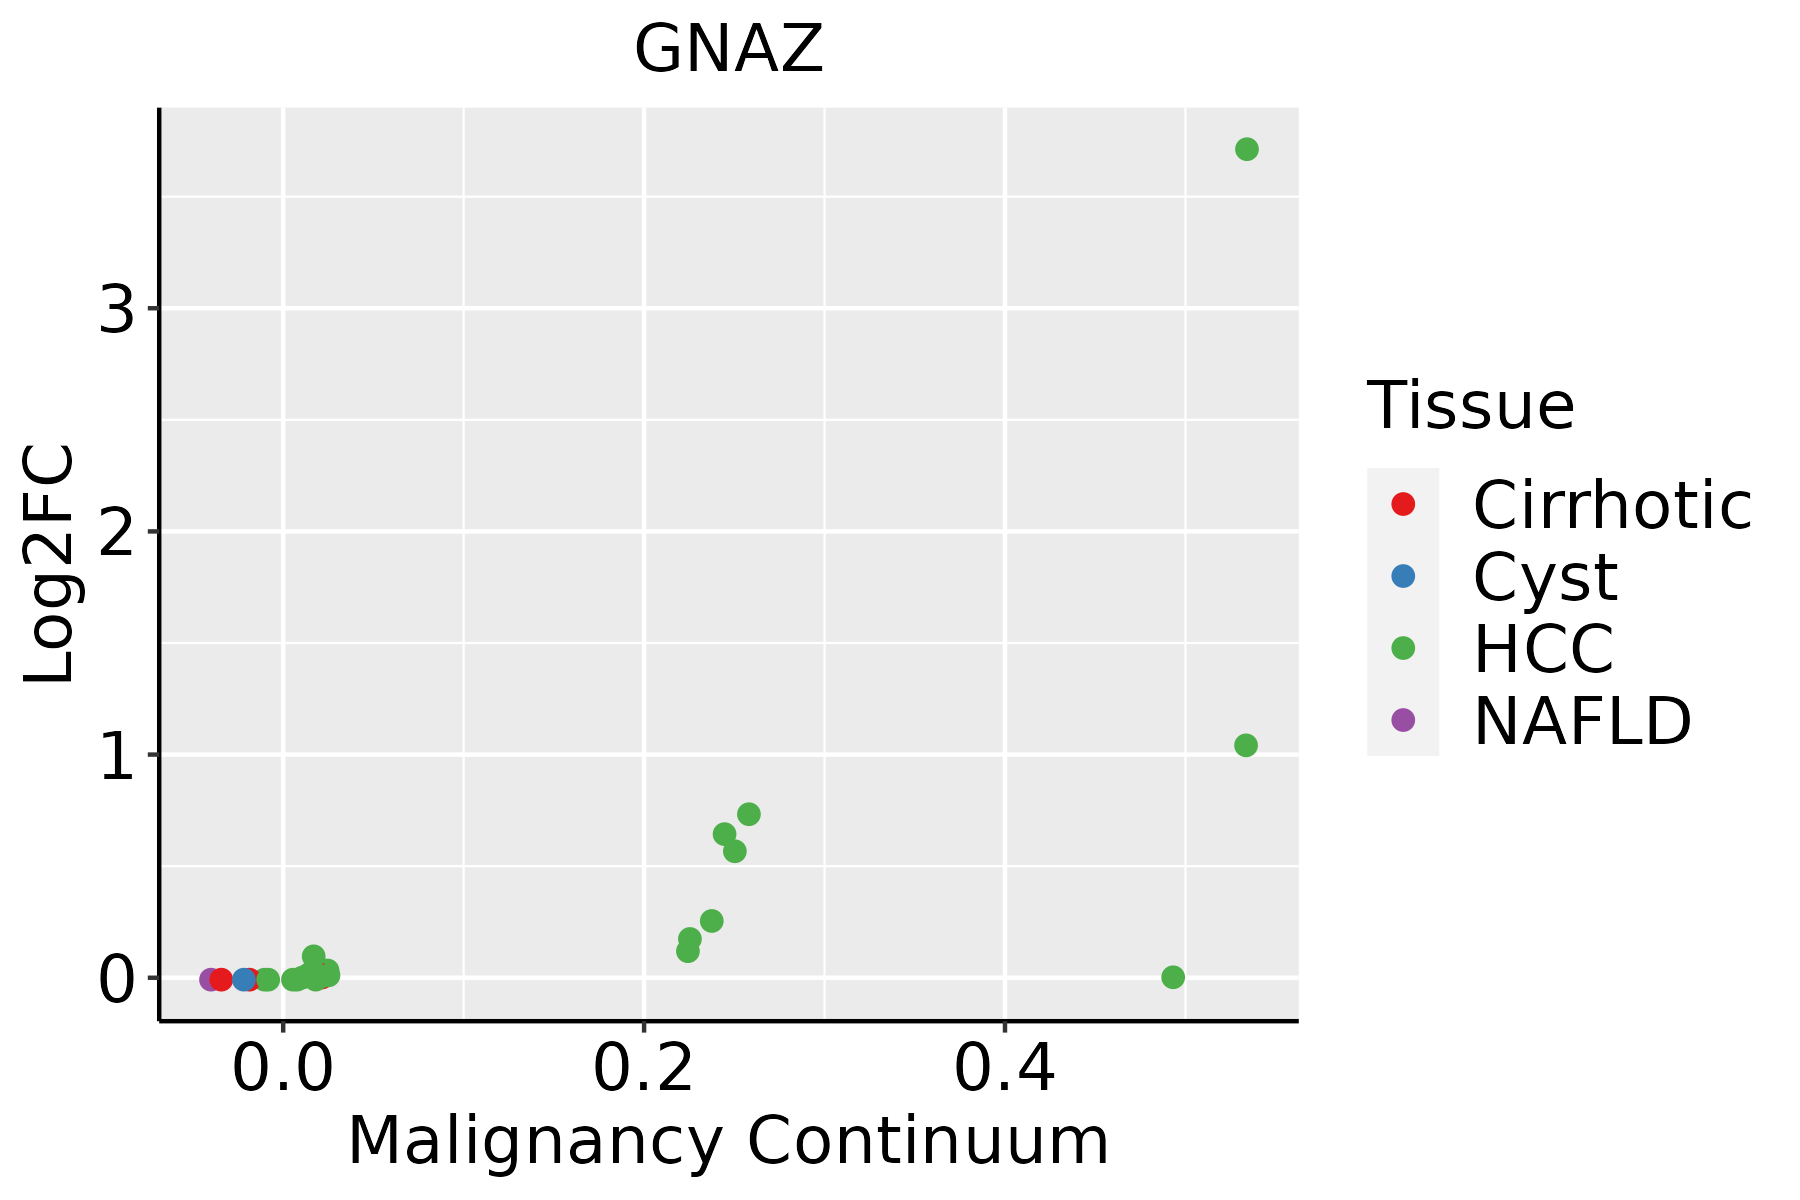 | HCC: Hepatocellular carcinoma |
| NAFLD: Non-alcoholic fatty liver disease |
| ∗log2FC in expression of this searched gene in stem-like cells from each diseased tissue sample relative to stem-like cells in normal samples in each tissue plotted against the malignancy continuum. Samples are colored based on if they are from different disease stage. |
Top |
Malignant transformation related pathway analysis |
| Find out the enriched GO biological processes and KEGG pathways involved in transition from healthy to precancer to cancer |
| Tissue | Disease Stage | Enriched GO biological Processes |
| Colorectum | AD |  |
| Colorectum | SER |  |
| Colorectum | MSS |  |
| Colorectum | MSI-H |  |
| Colorectum | FAP |  |
| ∗Top 15 enriched GO BP terms are showed in the bar plot of each disease state in each tissue. Each row represents a significant GO biological process which is colored according to the -log10(p.adjust). |
| Page: 1 2 3 4 5 6 7 8 9 |
| GO ID | Tissue | Disease Stage | Description | Gene Ratio | Bg Ratio | pvalue | p.adjust | Count |
| Page: 1 |
| Pathway ID | Tissue | Disease Stage | Description | Gene Ratio | Bg Ratio | pvalue | p.adjust | qvalue | Count |
| Page: 1 |
Top |
Cell-cell communication analysis |
| Identification of potential cell-cell interactions between two cell types and their ligand-receptor pairs for different disease states |
| Ligand | Receptor | LRpair | Pathway | Tissue | Disease Stage |
| Page: 1 |
Top |
Single-cell gene regulatory network inference analysis |
| Find out the significant the regulons (TFs) and the target genes of each regulon across cell types for different disease states |
| TF | Cell Type | Tissue | Disease Stage | Target Gene | RSS | Regulon Activity |
| ∗The dot plots of a searched regulon are shown for all cell subpopulations in each disease state of each tissue based on the regulon specific score inferred using pySCENIC and by calculating the average expression. |
| Page: 1 |
Top |
Somatic mutation of malignant transformation related genes |
| Annotation of somatic variants for genes involved in malignant transformation |
| Hugo Symbol | Variant Class | Variant Classification | dbSNP RS | HGVSc | HGVSp | HGVSp Short | SWISSPROT | BIOTYPE | SIFT | PolyPhen | Tumor Sample Barcode | Tissue | Histology | Sex | Age | Stage | Therapy Types | Drugs | Outcome |
| GNAZ | SNV | Missense_Mutation | novel | c.97G>A | p.Glu33Lys | p.E33K | P19086 | protein_coding | deleterious(0.04) | benign(0) | TCGA-AN-A046-01 | Breast | breast invasive carcinoma | Female | >=65 | I/II | Unknown | Unknown | SD |
| GNAZ | SNV | Missense_Mutation | c.829N>C | p.Glu277Gln | p.E277Q | P19086 | protein_coding | tolerated(0.07) | probably_damaging(0.956) | TCGA-D8-A1JA-01 | Breast | breast invasive carcinoma | Female | <65 | III/IV | Chemotherapy | adriamycin | PD | |
| GNAZ | insertion | In_Frame_Ins | novel | c.366_367insCAAAGCTCAGAGGAAAAAGAA | p.Pro122_Glu123insGlnSerSerGluGluLysGlu | p.P122_E123insQSSEEKE | P19086 | protein_coding | TCGA-A8-A09N-01 | Breast | breast invasive carcinoma | Female | <65 | III/IV | Unknown | Unknown | SD | ||
| GNAZ | SNV | Missense_Mutation | novel | c.625N>T | p.Arg209Cys | p.R209C | P19086 | protein_coding | deleterious(0) | possibly_damaging(0.554) | TCGA-EA-A3HS-01 | Cervix | cervical & endocervical cancer | Female | <65 | I/II | Unknown | Unknown | SD |
| GNAZ | SNV | Missense_Mutation | c.746N>A | p.Arg249His | p.R249H | P19086 | protein_coding | tolerated(0.37) | benign(0.398) | TCGA-ZJ-A8QR-01 | Cervix | cervical & endocervical cancer | Female | <65 | I/II | Unknown | Unknown | SD | |
| GNAZ | SNV | Missense_Mutation | novel | c.808N>G | p.Asn270Asp | p.N270D | P19086 | protein_coding | deleterious(0) | probably_damaging(0.982) | TCGA-AA-3949-01 | Colorectum | colon adenocarcinoma | Female | >=65 | III/IV | Unknown | Unknown | SD |
| GNAZ | SNV | Missense_Mutation | c.340G>A | p.Ala114Thr | p.A114T | P19086 | protein_coding | tolerated(0.44) | benign(0.037) | TCGA-CK-6746-01 | Colorectum | colon adenocarcinoma | Female | >=65 | I/II | Unknown | Unknown | SD | |
| GNAZ | SNV | Missense_Mutation | novel | c.521N>G | p.Asp174Gly | p.D174G | P19086 | protein_coding | deleterious(0) | probably_damaging(0.969) | TCGA-D5-6536-01 | Colorectum | colon adenocarcinoma | Male | >=65 | I/II | Chemotherapy | 5-fu | SD |
| GNAZ | SNV | Missense_Mutation | c.494C>T | p.Ala165Val | p.A165V | P19086 | protein_coding | tolerated(0.21) | probably_damaging(0.918) | TCGA-G4-6320-01 | Colorectum | colon adenocarcinoma | Male | >=65 | III/IV | Chemotherapy | oxaliplatin | SD | |
| GNAZ | SNV | Missense_Mutation | c.173N>A | p.Ser58Asn | p.S58N | P19086 | protein_coding | tolerated(0.12) | benign(0.03) | TCGA-G4-6628-01 | Colorectum | colon adenocarcinoma | Male | >=65 | I/II | Unknown | Unknown | SD |
| Page: 1 2 3 4 5 6 7 8 9 |
Top |
Related drugs of malignant transformation related genes |
| Identification of chemicals and drugs interact with genes involved in malignant transfromation |
| (DGIdb 4.0) |
| Entrez ID | Symbol | Category | Interaction Types | Drug Claim Name | Drug Name | PMIDs |
| Page: 1 |

Copyright 2023-Present -The University of Texas Health Science Center at Houston |