| Tissue | Expression Dynamics | Abbreviation |
| Breast | 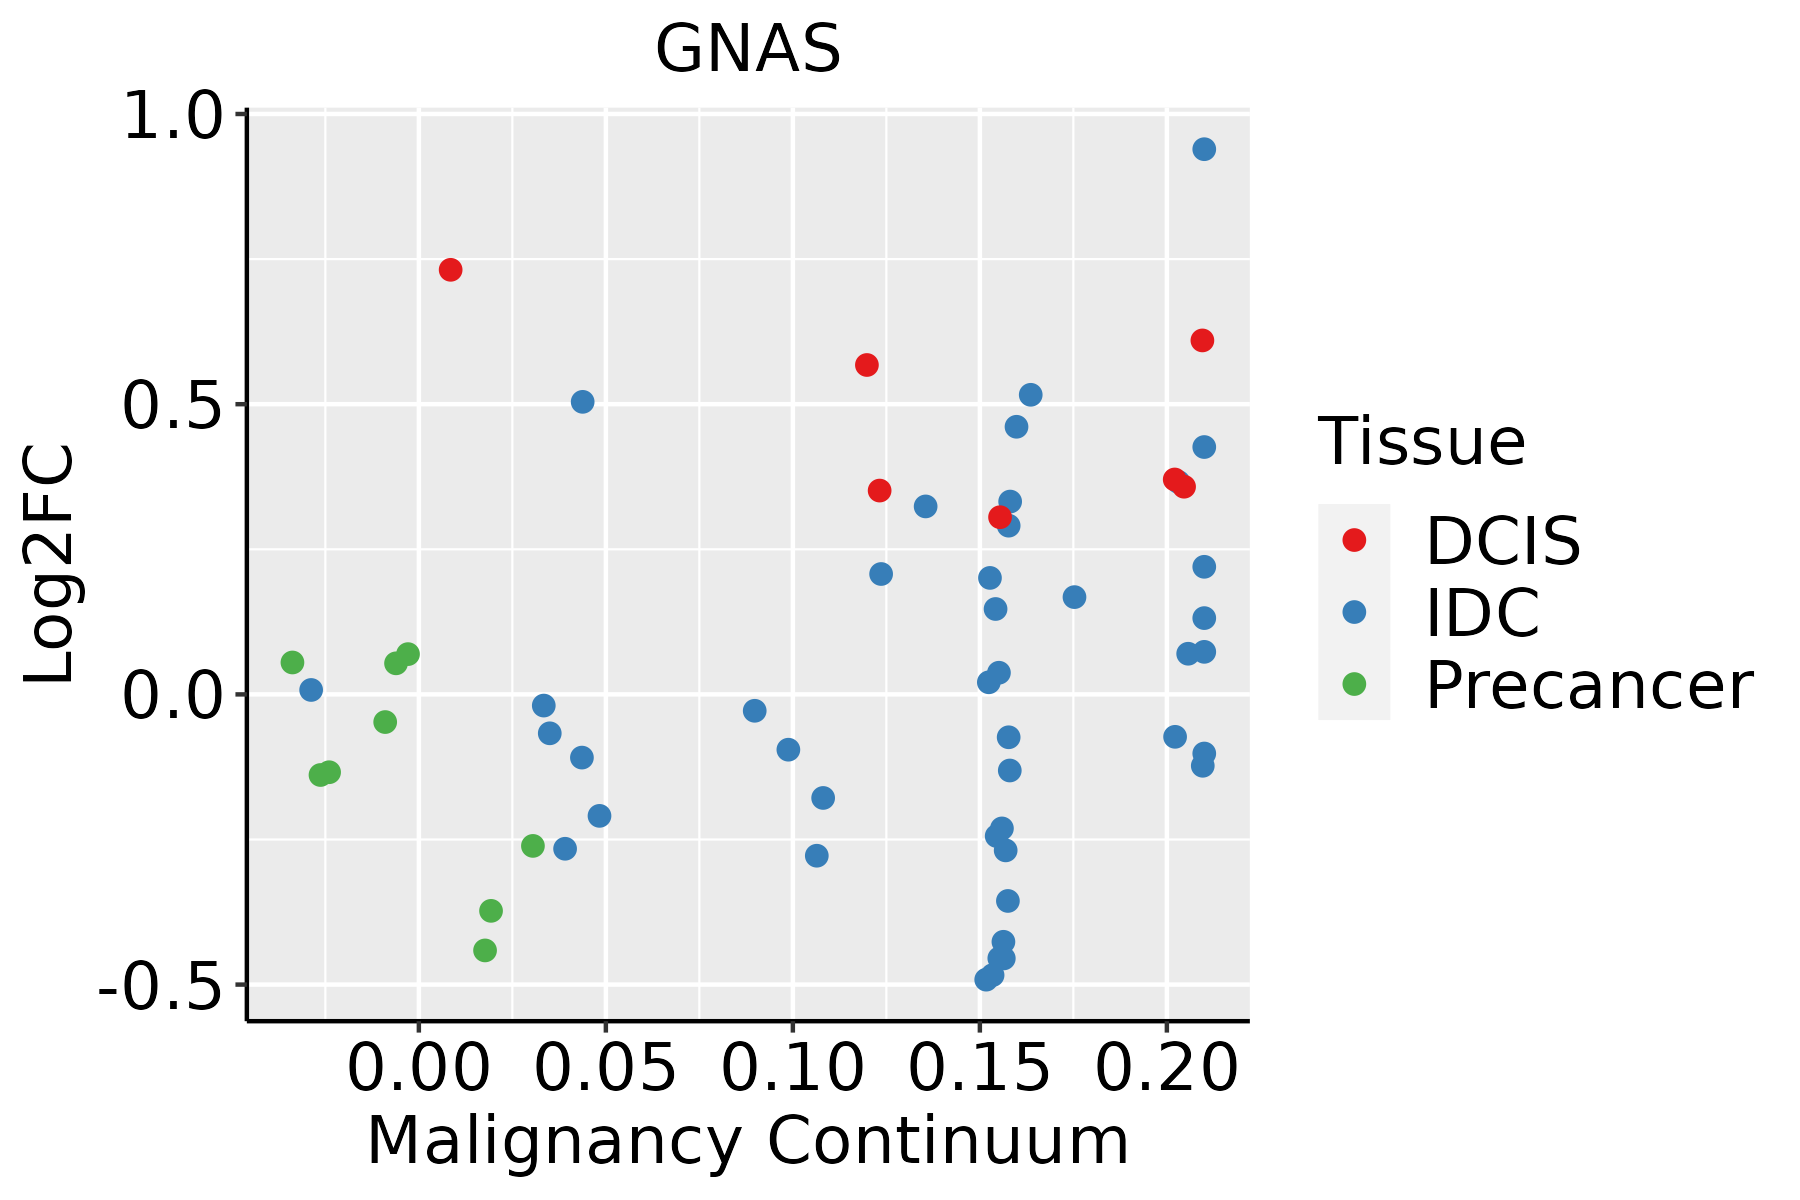 | IDC: Invasive ductal carcinoma |
| DCIS: Ductal carcinoma in situ |
| Precancer(BRCA1-mut): Precancerous lesion from BRCA1 mutation carriers |
| Cervix | 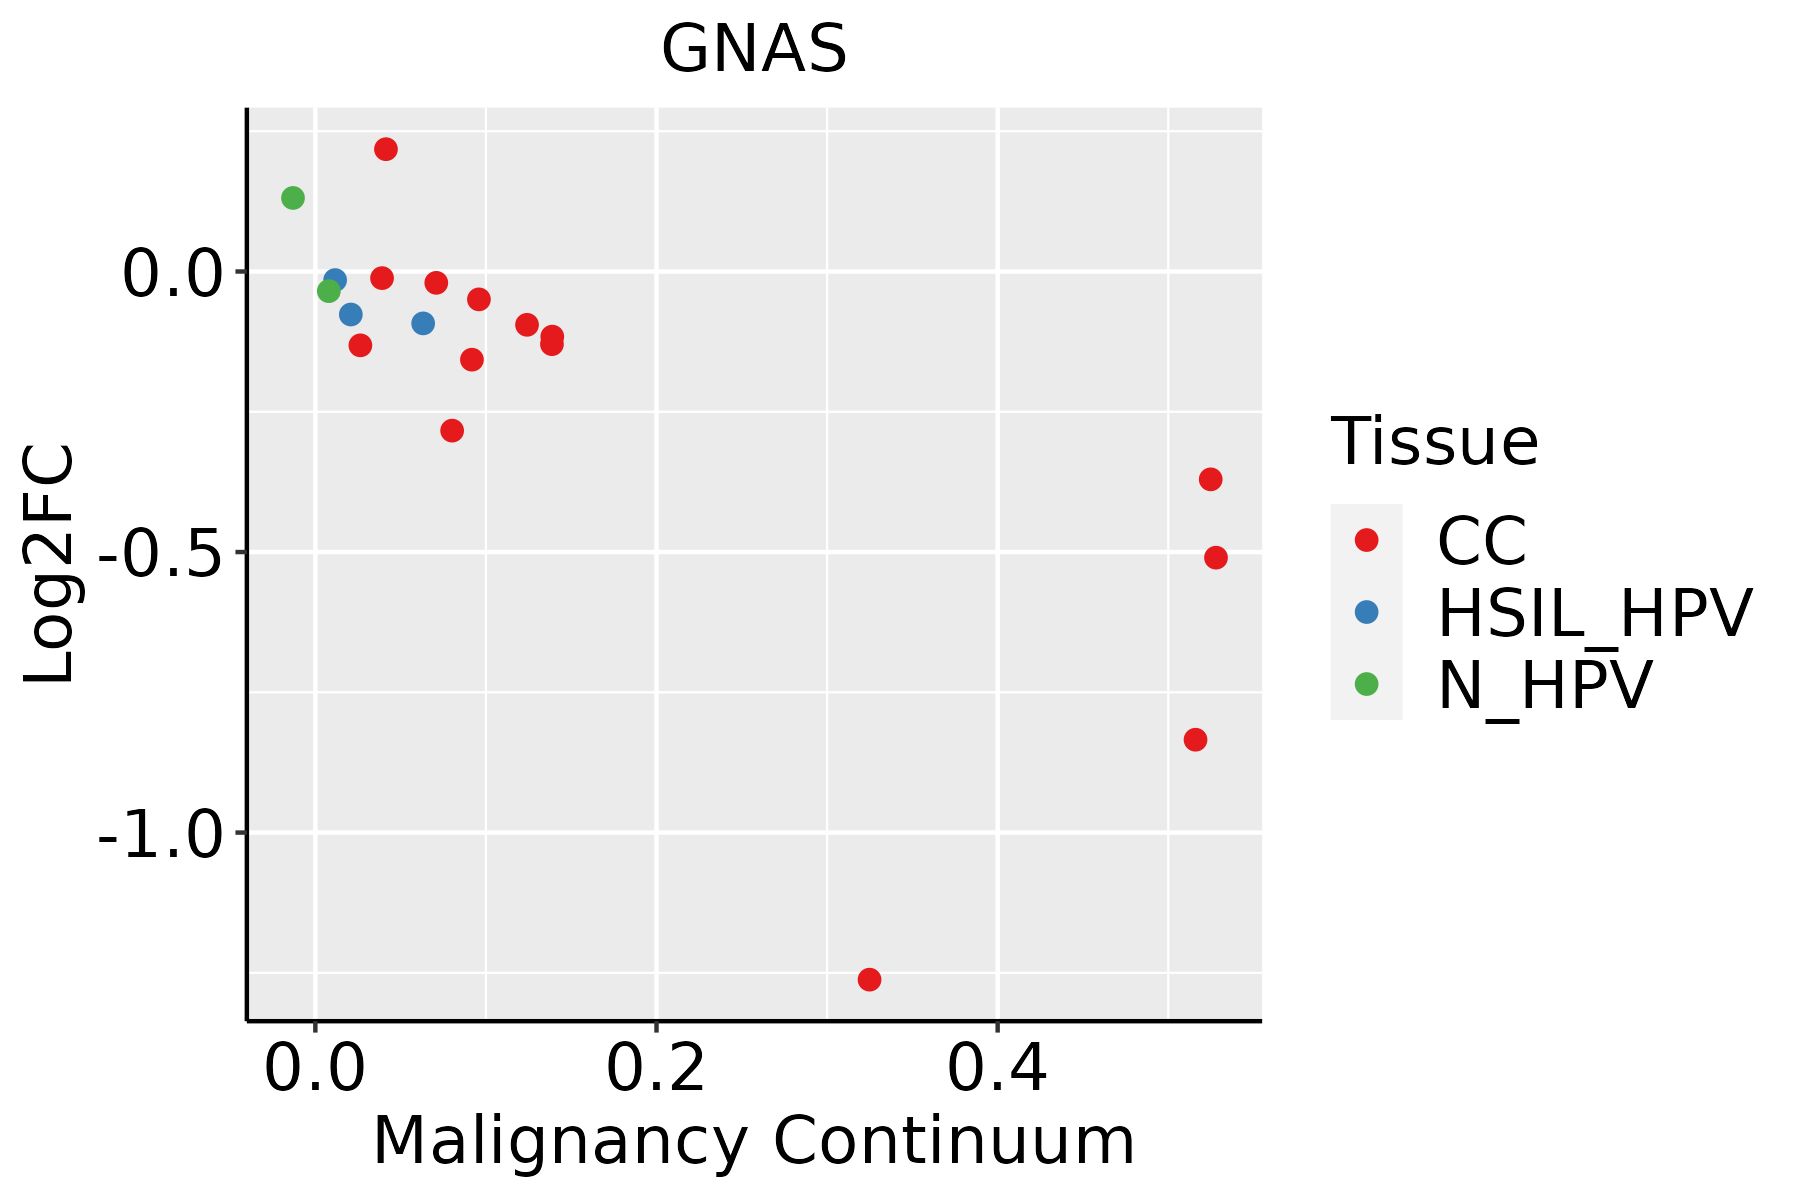 | CC: Cervix cancer |
| HSIL_HPV: HPV-infected high-grade squamous intraepithelial lesions |
| N_HPV: HPV-infected normal cervix |
| Colorectum (GSE201348) |  | FAP: Familial adenomatous polyposis |
| CRC: Colorectal cancer |
| Colorectum (HTA11) | 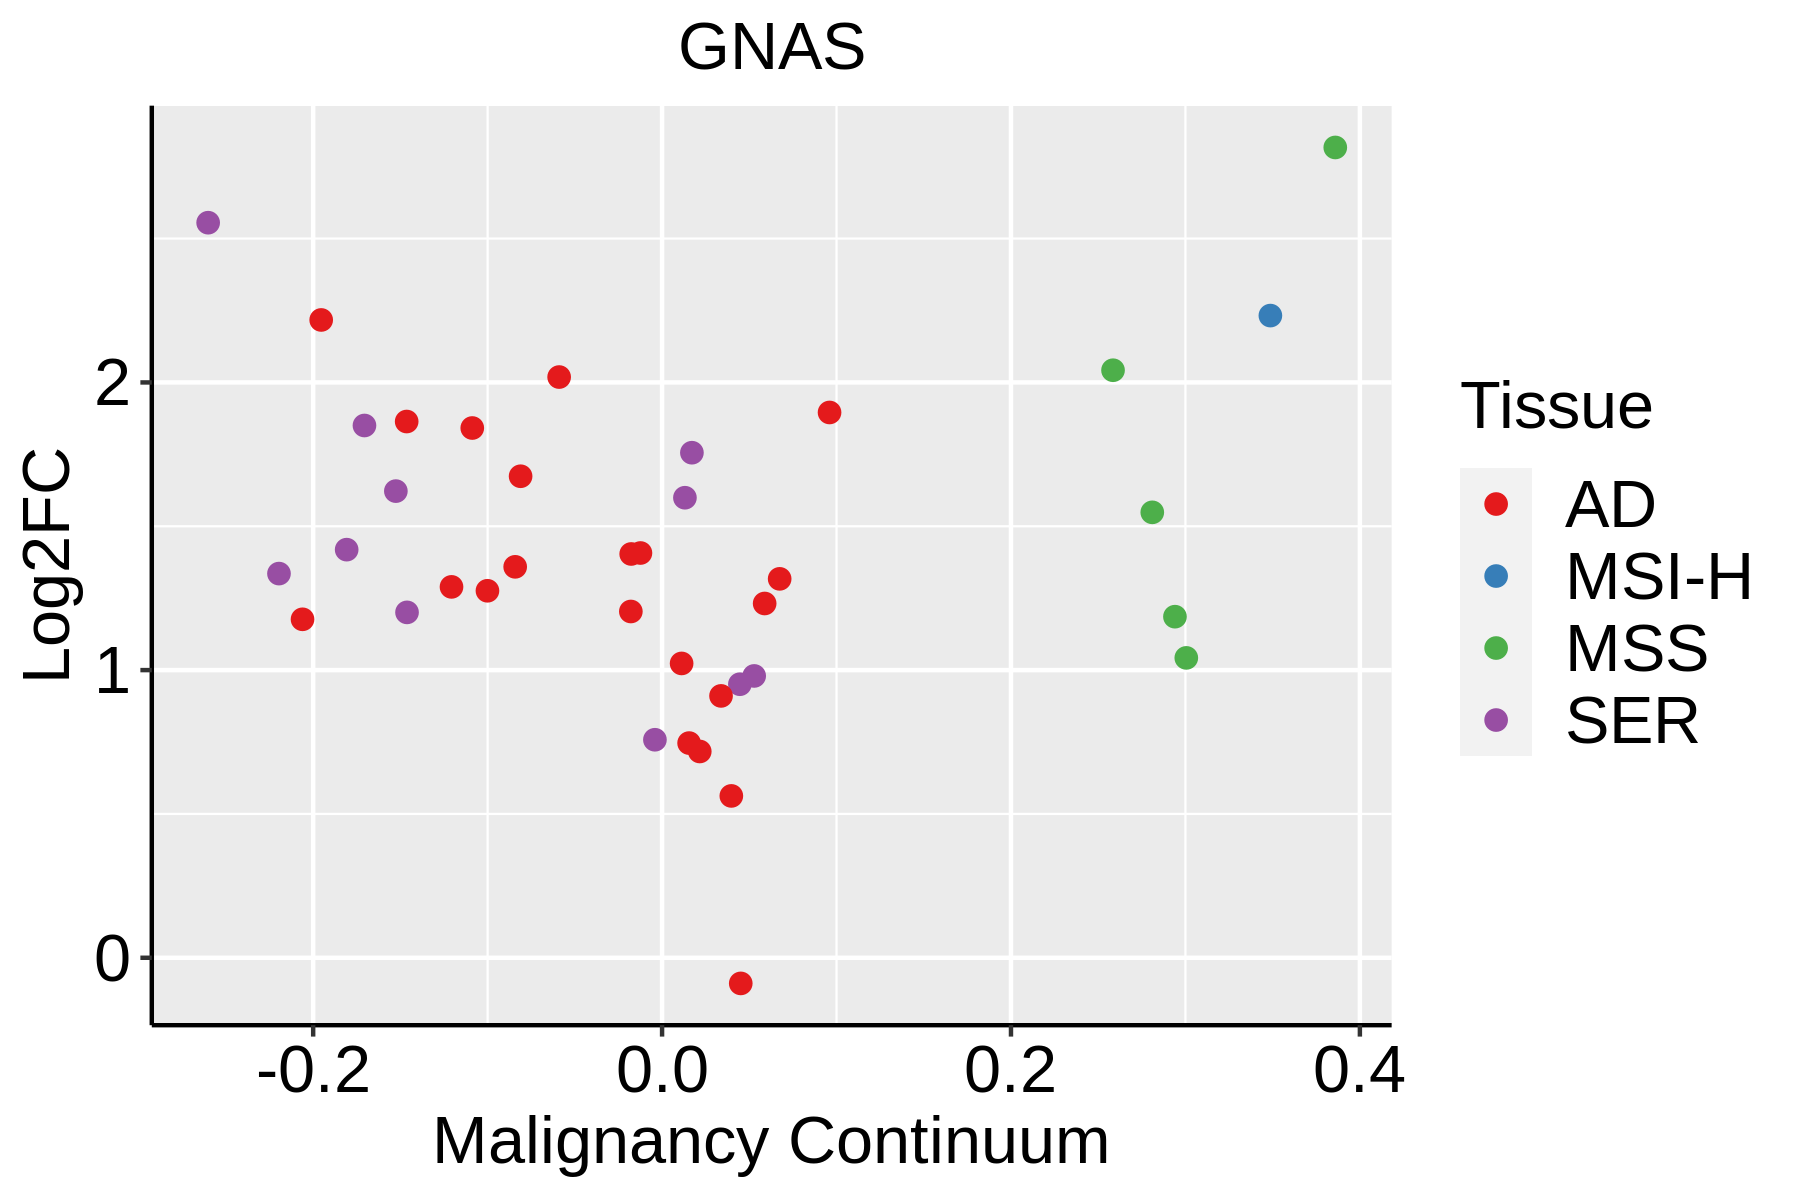 | AD: Adenomas |
| SER: Sessile serrated lesions |
| MSI-H: Microsatellite-high colorectal cancer |
| MSS: Microsatellite stable colorectal cancer |
| Endometrium |  | AEH: Atypical endometrial hyperplasia |
| EEC: Endometrioid Cancer |
| Esophagus | 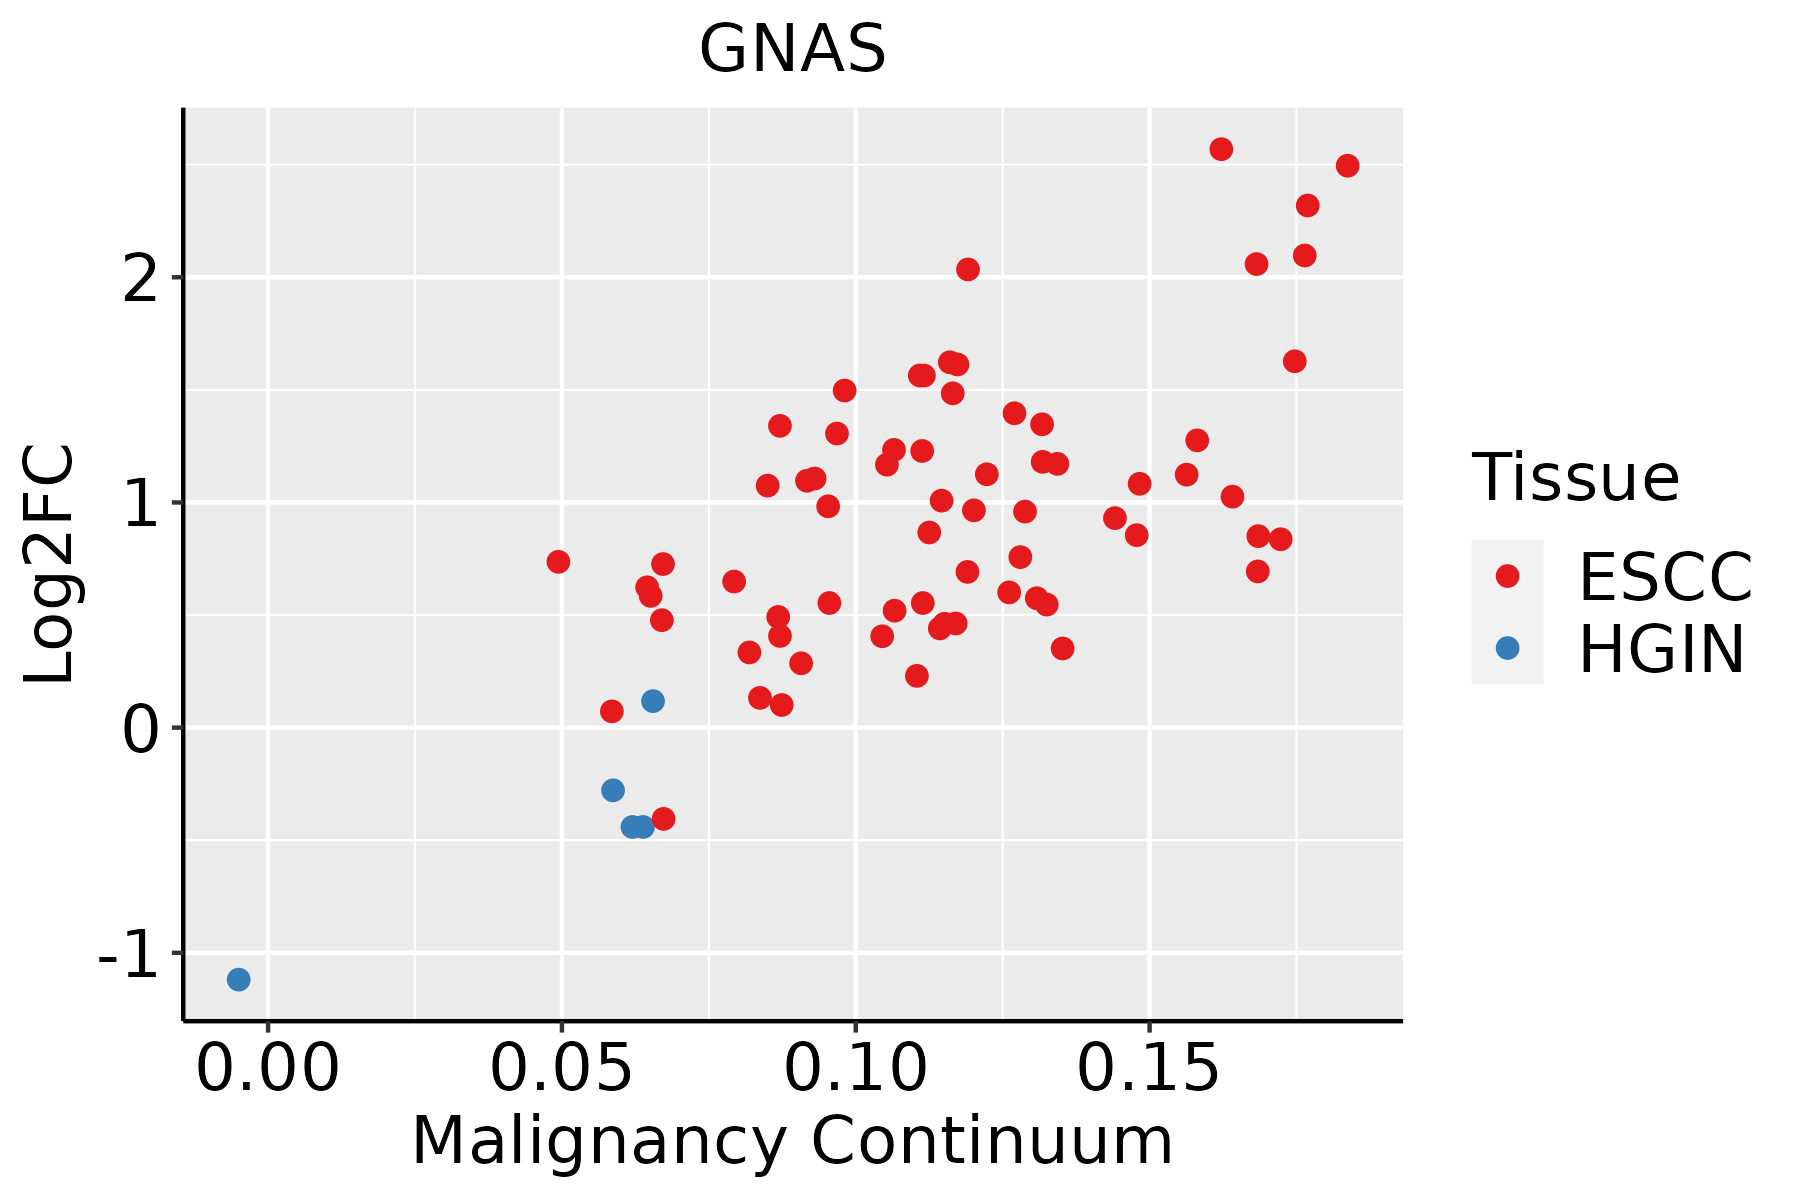 | ESCC: Esophageal squamous cell carcinoma |
| HGIN: High-grade intraepithelial neoplasias |
| LGIN: Low-grade intraepithelial neoplasias |
| GC |  | CAG: Chronic atrophic gastritis |
| CAG with IM: Chronic atrophic gastritis with intestinal metaplasia |
| CSG: Chronic superficial gastritis |
| GC: Gastric cancer |
| SIM: Severe intestinal metaplasia |
| WIM: Wild intestinal metaplasia |
| Liver | 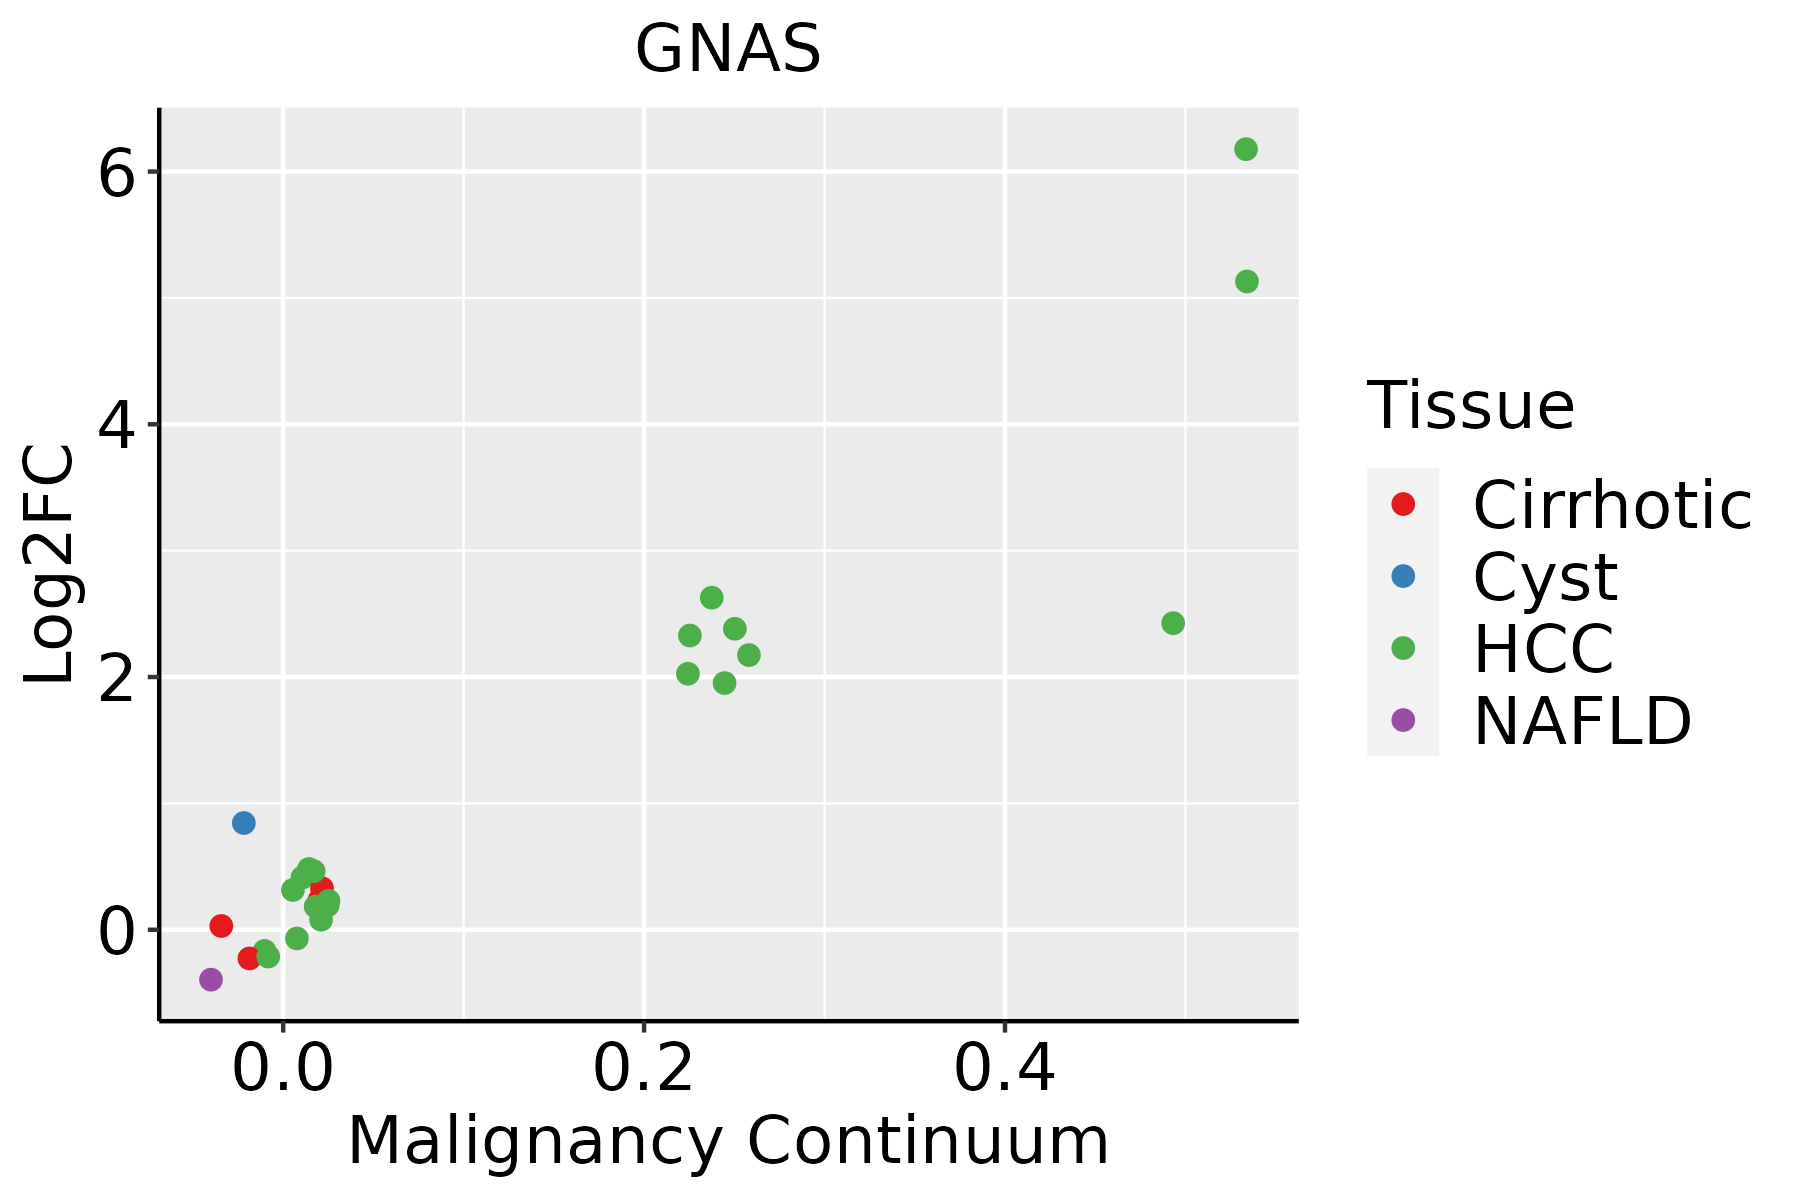 | HCC: Hepatocellular carcinoma |
| NAFLD: Non-alcoholic fatty liver disease |
| Lung |  | AAH: Atypical adenomatous hyperplasia |
| AIS: Adenocarcinoma in situ |
| IAC: Invasive lung adenocarcinoma |
| MIA: Minimally invasive adenocarcinoma |
| Oral Cavity | 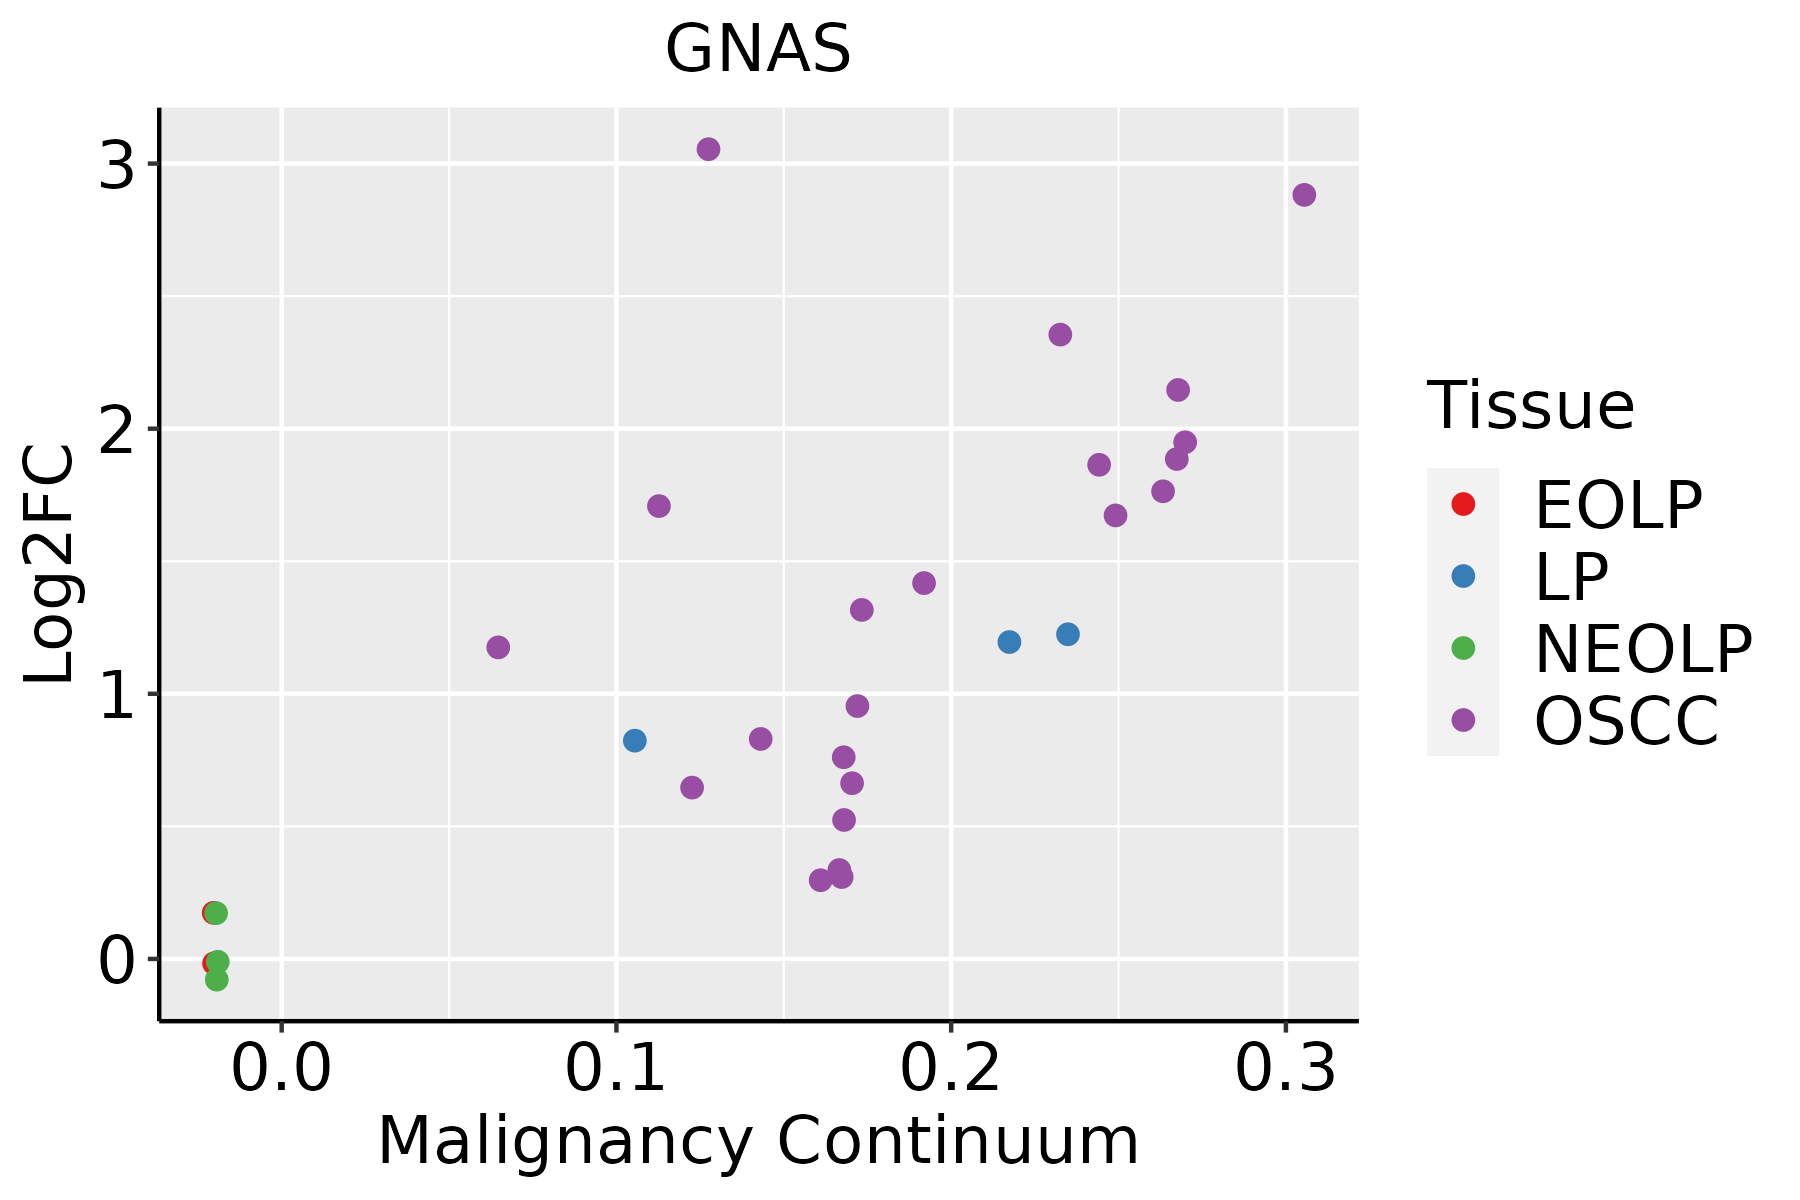 | EOLP: Erosive Oral lichen planus |
| LP: leukoplakia |
| NEOLP: Non-erosive oral lichen planus |
| OSCC: Oral squamous cell carcinoma |
| Prostate | 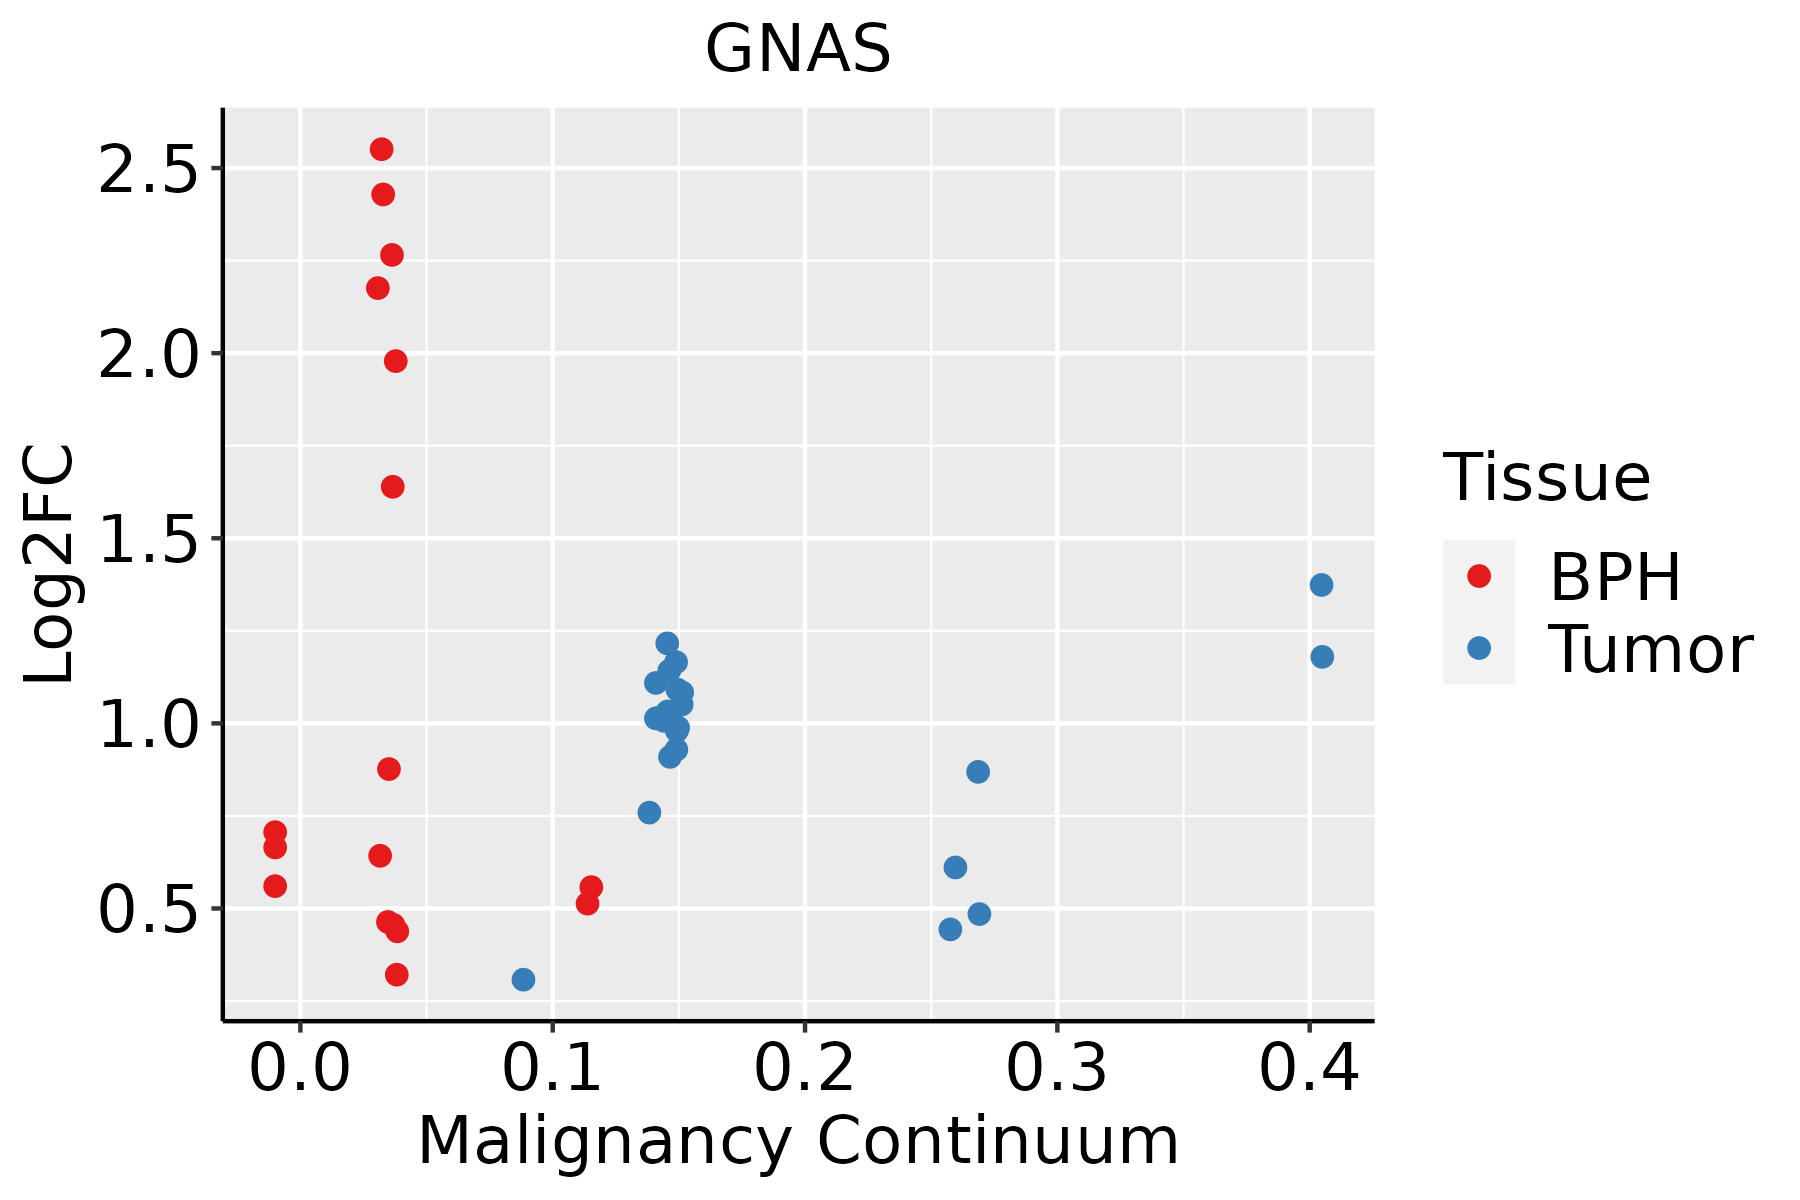 | BPH: Benign Prostatic Hyperplasia |
| Skin | 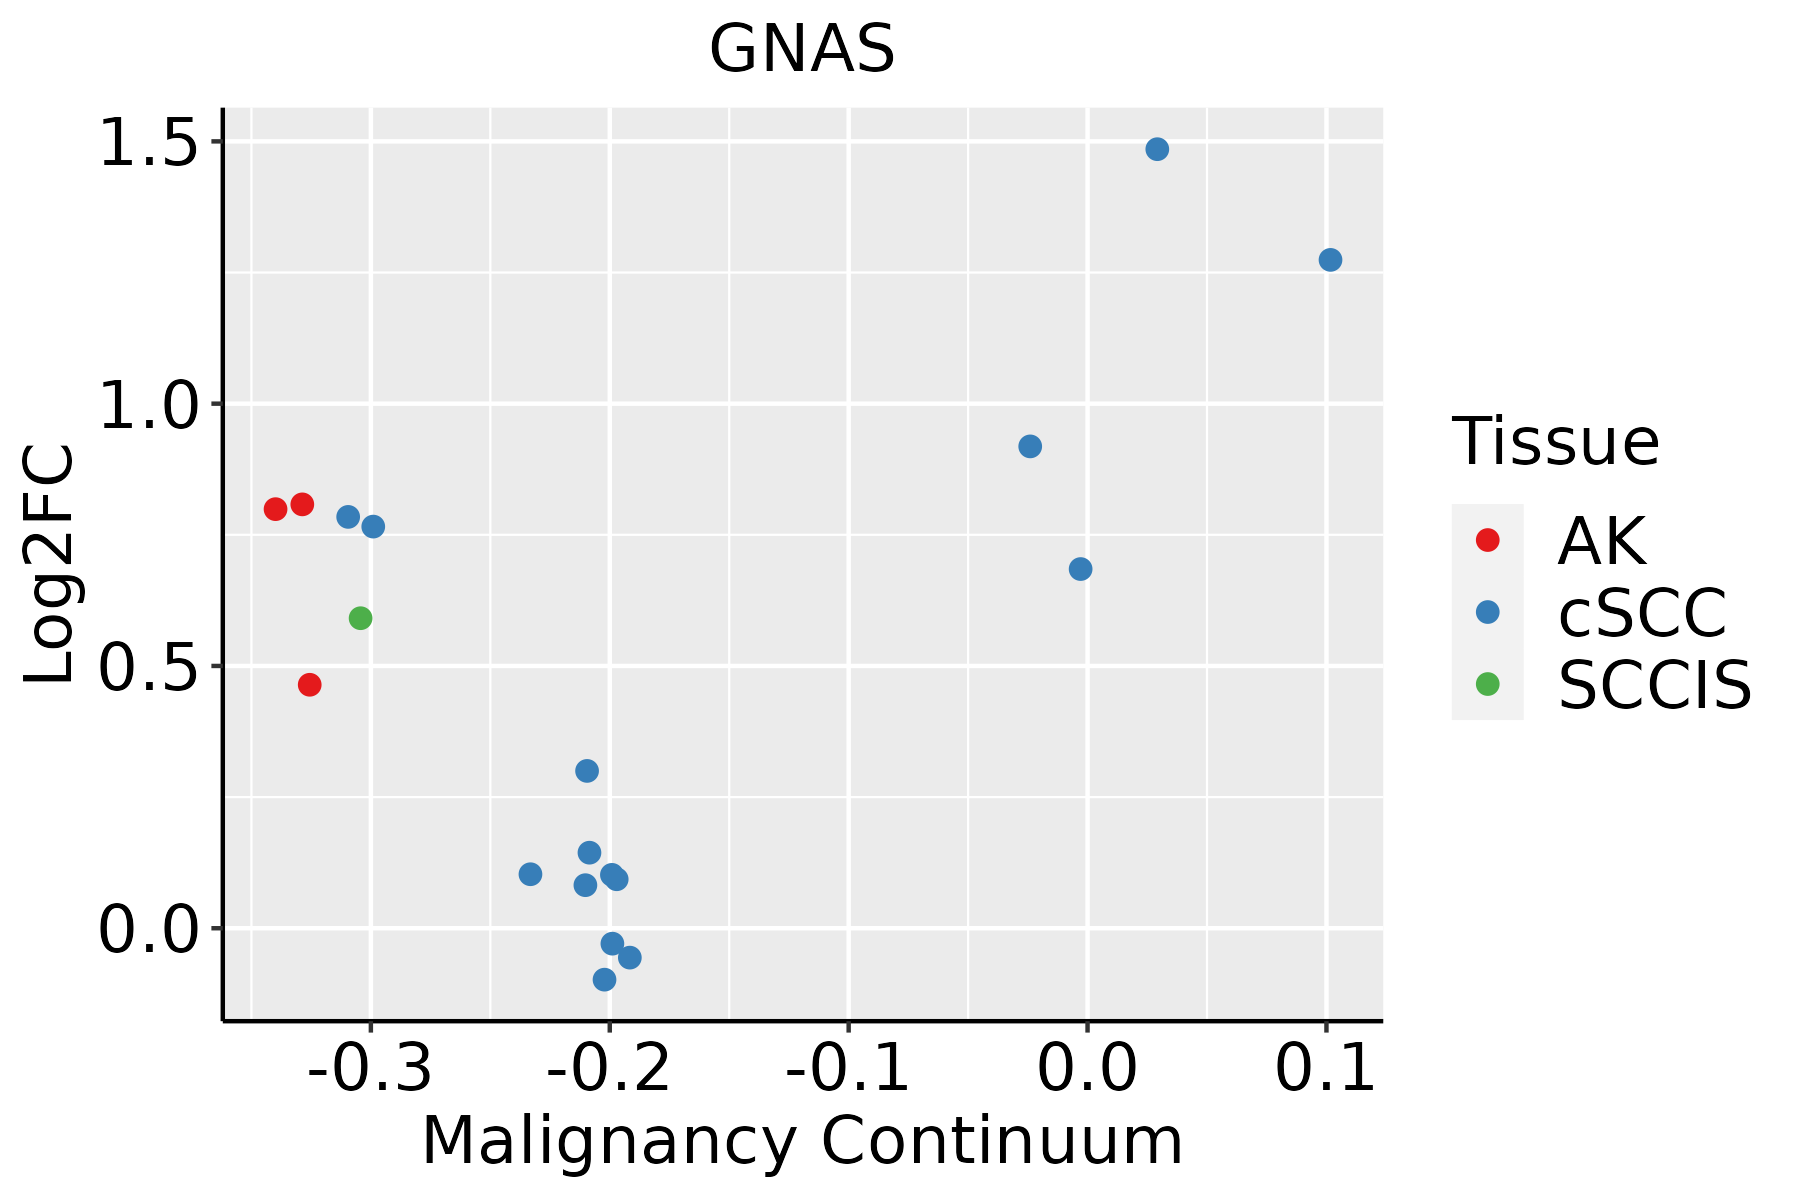 | AK: Actinic keratosis |
| cSCC: Cutaneous squamous cell carcinoma |
| SCCIS:squamous cell carcinoma in situ |
| Thyroid |  | ATC: Anaplastic thyroid cancer |
| HT: Hashimoto's thyroiditis |
| PTC: Papillary thyroid cancer |
| Pathway ID | Tissue | Disease Stage | Description | Gene Ratio | Bg Ratio | pvalue | p.adjust | qvalue | Count |
| hsa0501218 | Breast | Precancer | Parkinson disease | 99/684 | 266/8465 | 3.58e-42 | 5.65e-40 | 4.33e-40 | 99 |
| hsa0471418 | Breast | Precancer | Thermogenesis | 68/684 | 232/8465 | 4.40e-22 | 1.26e-20 | 9.69e-21 | 68 |
| hsa0491518 | Breast | Precancer | Estrogen signaling pathway | 28/684 | 138/8465 | 4.10e-06 | 5.39e-05 | 4.13e-05 | 28 |
| hsa05031 | Breast | Precancer | Amphetamine addiction | 14/684 | 69/8465 | 1.05e-03 | 7.35e-03 | 5.63e-03 | 14 |
| hsa0516316 | Breast | Precancer | Human cytomegalovirus infection | 32/684 | 225/8465 | 1.13e-03 | 7.57e-03 | 5.80e-03 | 32 |
| hsa0496110 | Breast | Precancer | Endocrine and other factor-regulated calcium reabsorption | 11/684 | 53/8465 | 2.92e-03 | 1.81e-02 | 1.39e-02 | 11 |
| hsa0501219 | Breast | Precancer | Parkinson disease | 99/684 | 266/8465 | 3.58e-42 | 5.65e-40 | 4.33e-40 | 99 |
| hsa0471419 | Breast | Precancer | Thermogenesis | 68/684 | 232/8465 | 4.40e-22 | 1.26e-20 | 9.69e-21 | 68 |
| hsa0491519 | Breast | Precancer | Estrogen signaling pathway | 28/684 | 138/8465 | 4.10e-06 | 5.39e-05 | 4.13e-05 | 28 |
| hsa050311 | Breast | Precancer | Amphetamine addiction | 14/684 | 69/8465 | 1.05e-03 | 7.35e-03 | 5.63e-03 | 14 |
| hsa0516317 | Breast | Precancer | Human cytomegalovirus infection | 32/684 | 225/8465 | 1.13e-03 | 7.57e-03 | 5.80e-03 | 32 |
| hsa0496111 | Breast | Precancer | Endocrine and other factor-regulated calcium reabsorption | 11/684 | 53/8465 | 2.92e-03 | 1.81e-02 | 1.39e-02 | 11 |
| hsa0501224 | Breast | IDC | Parkinson disease | 107/867 | 266/8465 | 2.57e-39 | 8.36e-37 | 6.26e-37 | 107 |
| hsa0471424 | Breast | IDC | Thermogenesis | 75/867 | 232/8465 | 8.41e-21 | 3.04e-19 | 2.27e-19 | 75 |
| hsa0491523 | Breast | IDC | Estrogen signaling pathway | 35/867 | 138/8465 | 2.55e-07 | 5.18e-06 | 3.88e-06 | 35 |
| hsa0511022 | Breast | IDC | Vibrio cholerae infection | 17/867 | 50/8465 | 4.82e-06 | 6.82e-05 | 5.10e-05 | 17 |
| hsa050312 | Breast | IDC | Amphetamine addiction | 18/867 | 69/8465 | 1.42e-04 | 1.36e-03 | 1.01e-03 | 18 |
| hsa0516324 | Breast | IDC | Human cytomegalovirus infection | 39/867 | 225/8465 | 6.66e-04 | 5.41e-03 | 4.05e-03 | 39 |
| hsa0497122 | Breast | IDC | Gastric acid secretion | 16/867 | 76/8465 | 3.80e-03 | 2.33e-02 | 1.74e-02 | 16 |
| hsa049704 | Breast | IDC | Salivary secretion | 18/867 | 93/8465 | 5.69e-03 | 3.13e-02 | 2.34e-02 | 18 |
| Hugo Symbol | Variant Class | Variant Classification | dbSNP RS | HGVSc | HGVSp | HGVSp Short | SWISSPROT | BIOTYPE | SIFT | PolyPhen | Tumor Sample Barcode | Tissue | Histology | Sex | Age | Stage | Therapy Types | Drugs | Outcome |
| GNAS | SNV | Missense_Mutation | rs11554273 | c.2530C>T | p.Arg844Cys | p.R844C | Q5JWF2 | protein_coding | deleterious(0.01) | probably_damaging(1) | TCGA-A8-A09T-01 | Breast | breast invasive carcinoma | Female | >=65 | I/II | Hormone Therapy | anastrozole | SD |
| GNAS | SNV | Missense_Mutation | | c.437N>A | p.Gly146Asp | p.G146D | Q5JWF2 | protein_coding | tolerated_low_confidence(0.09) | benign(0.003) | TCGA-A8-A09Z-01 | Breast | breast invasive carcinoma | Female | >=65 | I/II | Unknown | Unknown | SD |
| GNAS | SNV | Missense_Mutation | | c.964C>G | p.Pro322Ala | p.P322A | Q5JWF2 | protein_coding | tolerated_low_confidence(0.08) | benign(0.013) | TCGA-AC-A23H-01 | Breast | breast invasive carcinoma | Female | >=65 | I/II | Unknown | Unknown | PD |
| GNAS | SNV | Missense_Mutation | | c.3094N>T | p.Arg1032Cys | p.R1032C | Q5JWF2 | protein_coding | deleterious(0) | probably_damaging(0.999) | TCGA-AN-A046-01 | Breast | breast invasive carcinoma | Female | >=65 | I/II | Unknown | Unknown | SD |
| GNAS | SNV | Missense_Mutation | | c.2782A>G | p.Ile928Val | p.I928V | Q5JWF2 | protein_coding | deleterious(0.04) | probably_damaging(0.935) | TCGA-AR-A1AW-01 | Breast | breast invasive carcinoma | Female | >=65 | I/II | Chemotherapy | docetaxel | SD |
| GNAS | SNV | Missense_Mutation | | c.1004C>T | p.Pro335Leu | p.P335L | Q5JWF2 | protein_coding | deleterious_low_confidence(0.03) | benign(0.02) | TCGA-E2-A570-01 | Breast | breast invasive carcinoma | Female | <65 | I/II | Hormone Therapy | anastrozole | SD |
| GNAS | SNV | Missense_Mutation | | c.3057C>G | p.Phe1019Leu | p.F1019L | Q5JWF2 | protein_coding | deleterious(0.02) | probably_damaging(0.999) | TCGA-GM-A2D9-01 | Breast | breast invasive carcinoma | Female | >=65 | I/II | Hormone Therapy | arimidex | SD |
| GNAS | SNV | Missense_Mutation | | c.513G>C | p.Gln171His | p.Q171H | Q5JWF2 | protein_coding | deleterious_low_confidence(0.04) | benign(0.01) | TCGA-PE-A5DE-01 | Breast | breast invasive carcinoma | Female | <65 | I/II | Chemotherapy | taxotere | CR |
| GNAS | insertion | Frame_Shift_Ins | novel | c.2106_2107insA | p.Met703AsnfsTer7 | p.M703Nfs*7 | Q5JWF2 | protein_coding | | | TCGA-AN-A0FF-01 | Breast | breast invasive carcinoma | Female | <65 | I/II | Unknown | Unknown | SD |
| GNAS | insertion | Frame_Shift_Ins | novel | c.1827dupC | p.Asn610GlnfsTer15 | p.N610Qfs*15 | Q5JWF2 | protein_coding | | | TCGA-AO-A1KT-01 | Breast | breast invasive carcinoma | Female | >=65 | I/II | Chemotherapy | fluorouracil | SD |
| Entrez ID | Symbol | Category | Interaction Types | Drug Claim Name | Drug Name | PMIDs |
| 2778 | GNAS | DRUGGABLE GENOME, CLINICALLY ACTIONABLE, G PROTEIN COUPLED RECEPTOR, DRUG RESISTANCE, TRANSPORTER | | GARCINONE E | GARCINONE E | |
| 2778 | GNAS | DRUGGABLE GENOME, CLINICALLY ACTIONABLE, G PROTEIN COUPLED RECEPTOR, DRUG RESISTANCE, TRANSPORTER | | BAS 01152706 | CHEMBL2002487 | |
| 2778 | GNAS | DRUGGABLE GENOME, CLINICALLY ACTIONABLE, G PROTEIN COUPLED RECEPTOR, DRUG RESISTANCE, TRANSPORTER | | N-(3,4-DICHLOROPHENYL)BENZAMIDE | CHEMBL560296 | |
| 2778 | GNAS | DRUGGABLE GENOME, CLINICALLY ACTIONABLE, G PROTEIN COUPLED RECEPTOR, DRUG RESISTANCE, TRANSPORTER | | TETRAETHYLAMMONIUM CHLORIDE | TETRAETHYLAMMONIUM CHLORIDE | |
| 2778 | GNAS | DRUGGABLE GENOME, CLINICALLY ACTIONABLE, G PROTEIN COUPLED RECEPTOR, DRUG RESISTANCE, TRANSPORTER | | TCMDC-125620 | CHEMBL530291 | |
| 2778 | GNAS | DRUGGABLE GENOME, CLINICALLY ACTIONABLE, G PROTEIN COUPLED RECEPTOR, DRUG RESISTANCE, TRANSPORTER | | CISPLATIN | CISPLATIN | 19274060 |
| 2778 | GNAS | DRUGGABLE GENOME, CLINICALLY ACTIONABLE, G PROTEIN COUPLED RECEPTOR, DRUG RESISTANCE, TRANSPORTER | | TCMDC-124353 | CHEMBL529918 | |
| 2778 | GNAS | DRUGGABLE GENOME, CLINICALLY ACTIONABLE, G PROTEIN COUPLED RECEPTOR, DRUG RESISTANCE, TRANSPORTER | | FLUOROURACIL | FLUOROURACIL | 19274060 |
| 2778 | GNAS | DRUGGABLE GENOME, CLINICALLY ACTIONABLE, G PROTEIN COUPLED RECEPTOR, DRUG RESISTANCE, TRANSPORTER | | NICLOSAMIDE | NICLOSAMIDE | |
| 2778 | GNAS | DRUGGABLE GENOME, CLINICALLY ACTIONABLE, G PROTEIN COUPLED RECEPTOR, DRUG RESISTANCE, TRANSPORTER | | 9,10-PHENANTHRENEQUINONE | 9,10-PHENANTHRENEQUINONE | |


