
|
|||||
|
 | |
| |
| |
| |
| |
| |
|
Gene: GNAQ |
Gene summary for GNAQ |
| Gene information | Species | Human | Gene symbol | GNAQ | Gene ID | 2776 |
| Gene name | G protein subunit alpha q | |
| Gene Alias | CMC1 | |
| Cytomap | 9q21.2 | |
| Gene Type | protein-coding | GO ID | GO:0001508 | UniProtAcc | A0A024R240 |
Top |
Malignant transformation analysis |
| Identification of the aberrant gene expression in precancerous and cancerous lesions by comparing the gene expression of stem-like cells in diseased tissues with normal stem cells |
| Entrez ID | Symbol | Replicates | Species | Organ | Tissue | Adj P-value | Log2FC | Malignancy |
| 2776 | GNAQ | CCI_1 | Human | Cervix | CC | 2.09e-04 | 7.33e-01 | 0.528 |
| 2776 | GNAQ | CCI_2 | Human | Cervix | CC | 4.09e-09 | 1.21e+00 | 0.5249 |
| 2776 | GNAQ | CCI_3 | Human | Cervix | CC | 2.22e-14 | 1.21e+00 | 0.516 |
| 2776 | GNAQ | L1 | Human | Cervix | CC | 2.51e-02 | -2.87e-01 | 0.0802 |
| 2776 | GNAQ | HTA11_3410_2000001011 | Human | Colorectum | AD | 4.06e-31 | -7.37e-01 | 0.0155 |
| 2776 | GNAQ | HTA11_2951_2000001011 | Human | Colorectum | AD | 1.76e-03 | -5.83e-01 | 0.0216 |
| 2776 | GNAQ | HTA11_347_2000001011 | Human | Colorectum | AD | 1.08e-16 | 8.00e-01 | -0.1954 |
| 2776 | GNAQ | HTA11_411_2000001011 | Human | Colorectum | SER | 6.59e-18 | 8.84e-01 | -0.2602 |
| 2776 | GNAQ | HTA11_5216_2000001011 | Human | Colorectum | SER | 7.79e-05 | -4.20e-01 | -0.1462 |
| 2776 | GNAQ | HTA11_9341_2000001011 | Human | Colorectum | SER | 3.28e-03 | -4.91e-01 | -0.00410000000000005 |
| 2776 | GNAQ | HTA11_866_3004761011 | Human | Colorectum | AD | 4.47e-17 | -6.48e-01 | 0.096 |
| 2776 | GNAQ | HTA11_8622_2000001021 | Human | Colorectum | SER | 3.21e-08 | -5.34e-01 | 0.0528 |
| 2776 | GNAQ | HTA11_10711_2000001011 | Human | Colorectum | AD | 3.97e-03 | -4.47e-01 | 0.0338 |
| 2776 | GNAQ | HTA11_7696_3000711011 | Human | Colorectum | AD | 7.87e-24 | -5.96e-01 | 0.0674 |
| 2776 | GNAQ | HTA11_99999970781_79442 | Human | Colorectum | MSS | 5.94e-11 | -4.52e-01 | 0.294 |
| 2776 | GNAQ | HTA11_99999965062_69753 | Human | Colorectum | MSI-H | 2.38e-03 | 5.98e-01 | 0.3487 |
| 2776 | GNAQ | HTA11_99999971662_82457 | Human | Colorectum | MSS | 1.70e-28 | -7.57e-01 | 0.3859 |
| 2776 | GNAQ | HTA11_99999973899_84307 | Human | Colorectum | MSS | 4.66e-09 | -7.39e-01 | 0.2585 |
| 2776 | GNAQ | HTA11_99999974143_84620 | Human | Colorectum | MSS | 2.40e-64 | -1.03e+00 | 0.3005 |
| 2776 | GNAQ | F007 | Human | Colorectum | FAP | 1.19e-05 | -4.57e-01 | 0.1176 |
| Page: 1 2 3 4 5 6 7 8 9 |
| Tissue | Expression Dynamics | Abbreviation |
| Cervix | 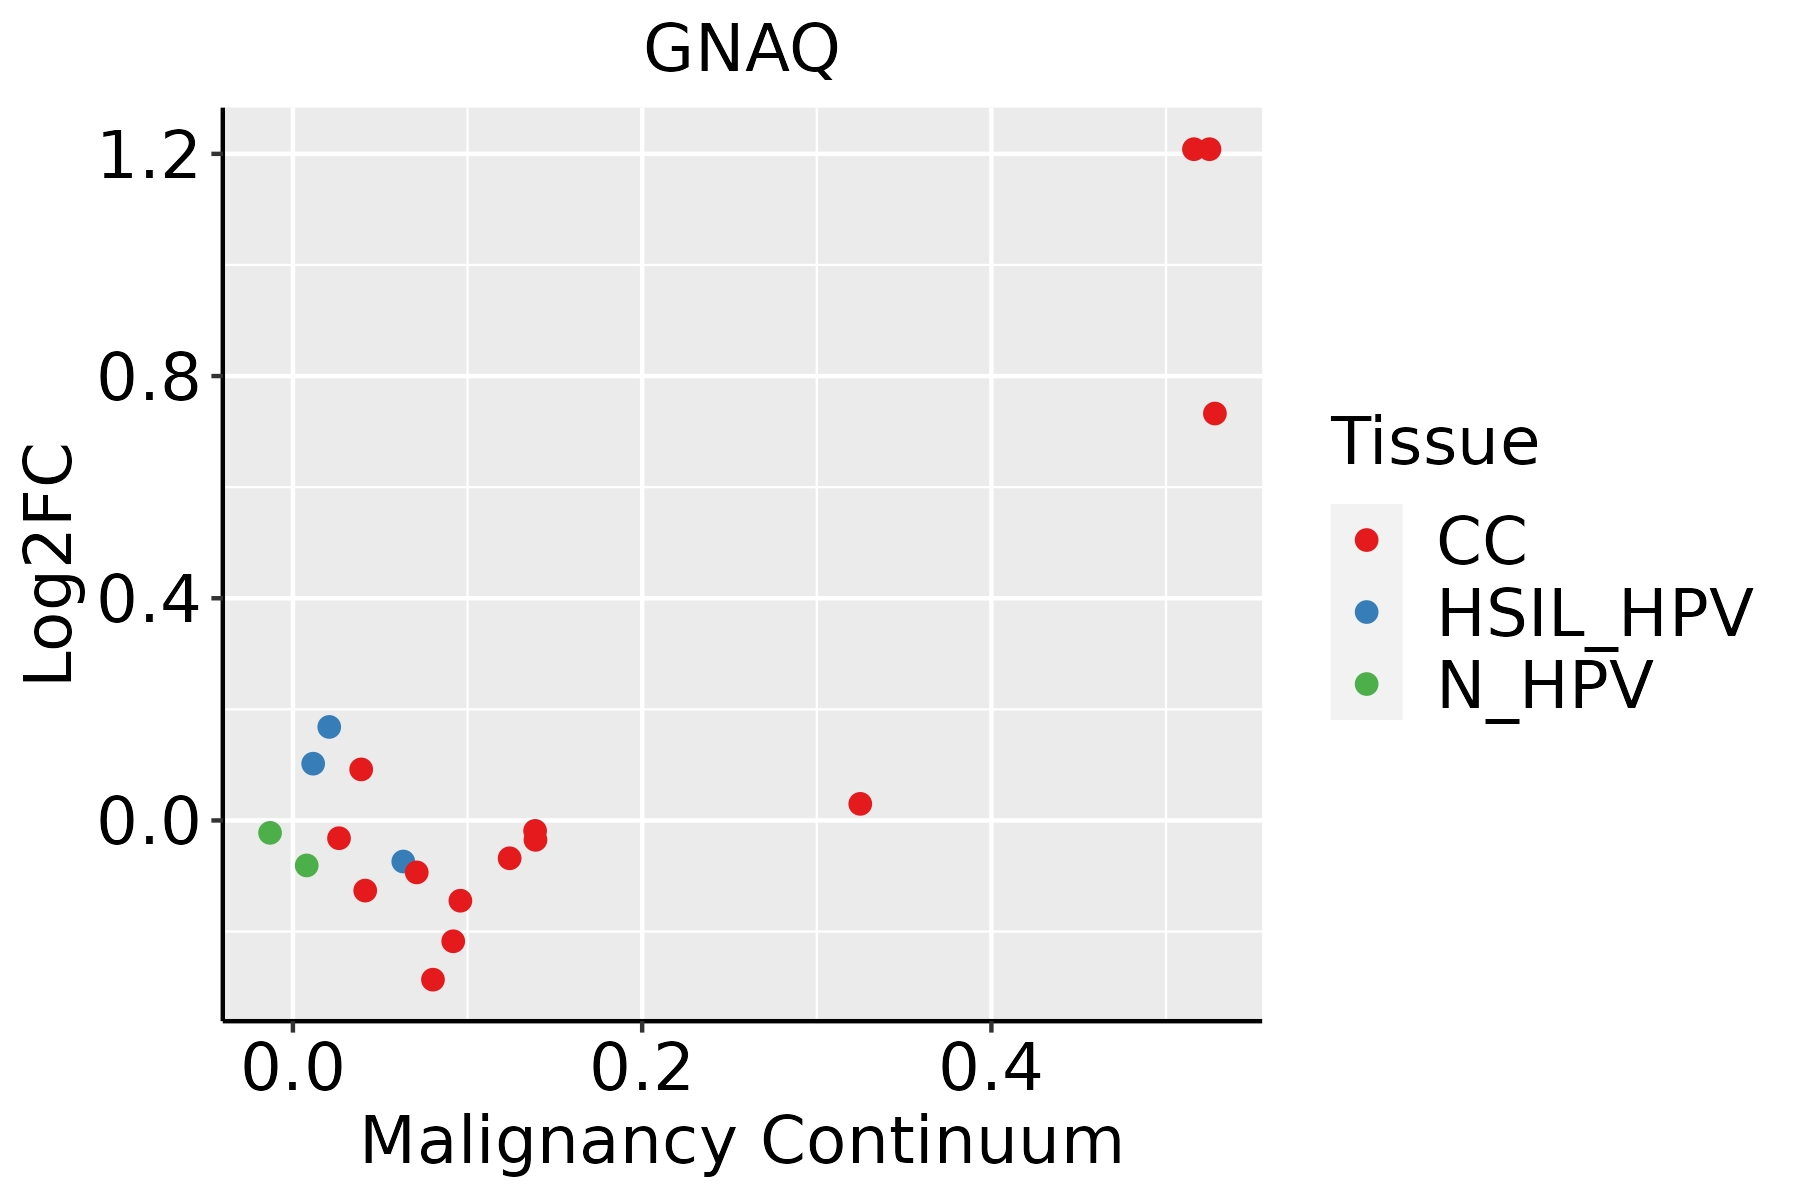 | CC: Cervix cancer |
| HSIL_HPV: HPV-infected high-grade squamous intraepithelial lesions | ||
| N_HPV: HPV-infected normal cervix | ||
| Colorectum (GSE201348) |  | FAP: Familial adenomatous polyposis |
| CRC: Colorectal cancer | ||
| Colorectum (HTA11) |  | AD: Adenomas |
| SER: Sessile serrated lesions | ||
| MSI-H: Microsatellite-high colorectal cancer | ||
| MSS: Microsatellite stable colorectal cancer | ||
| Endometrium | 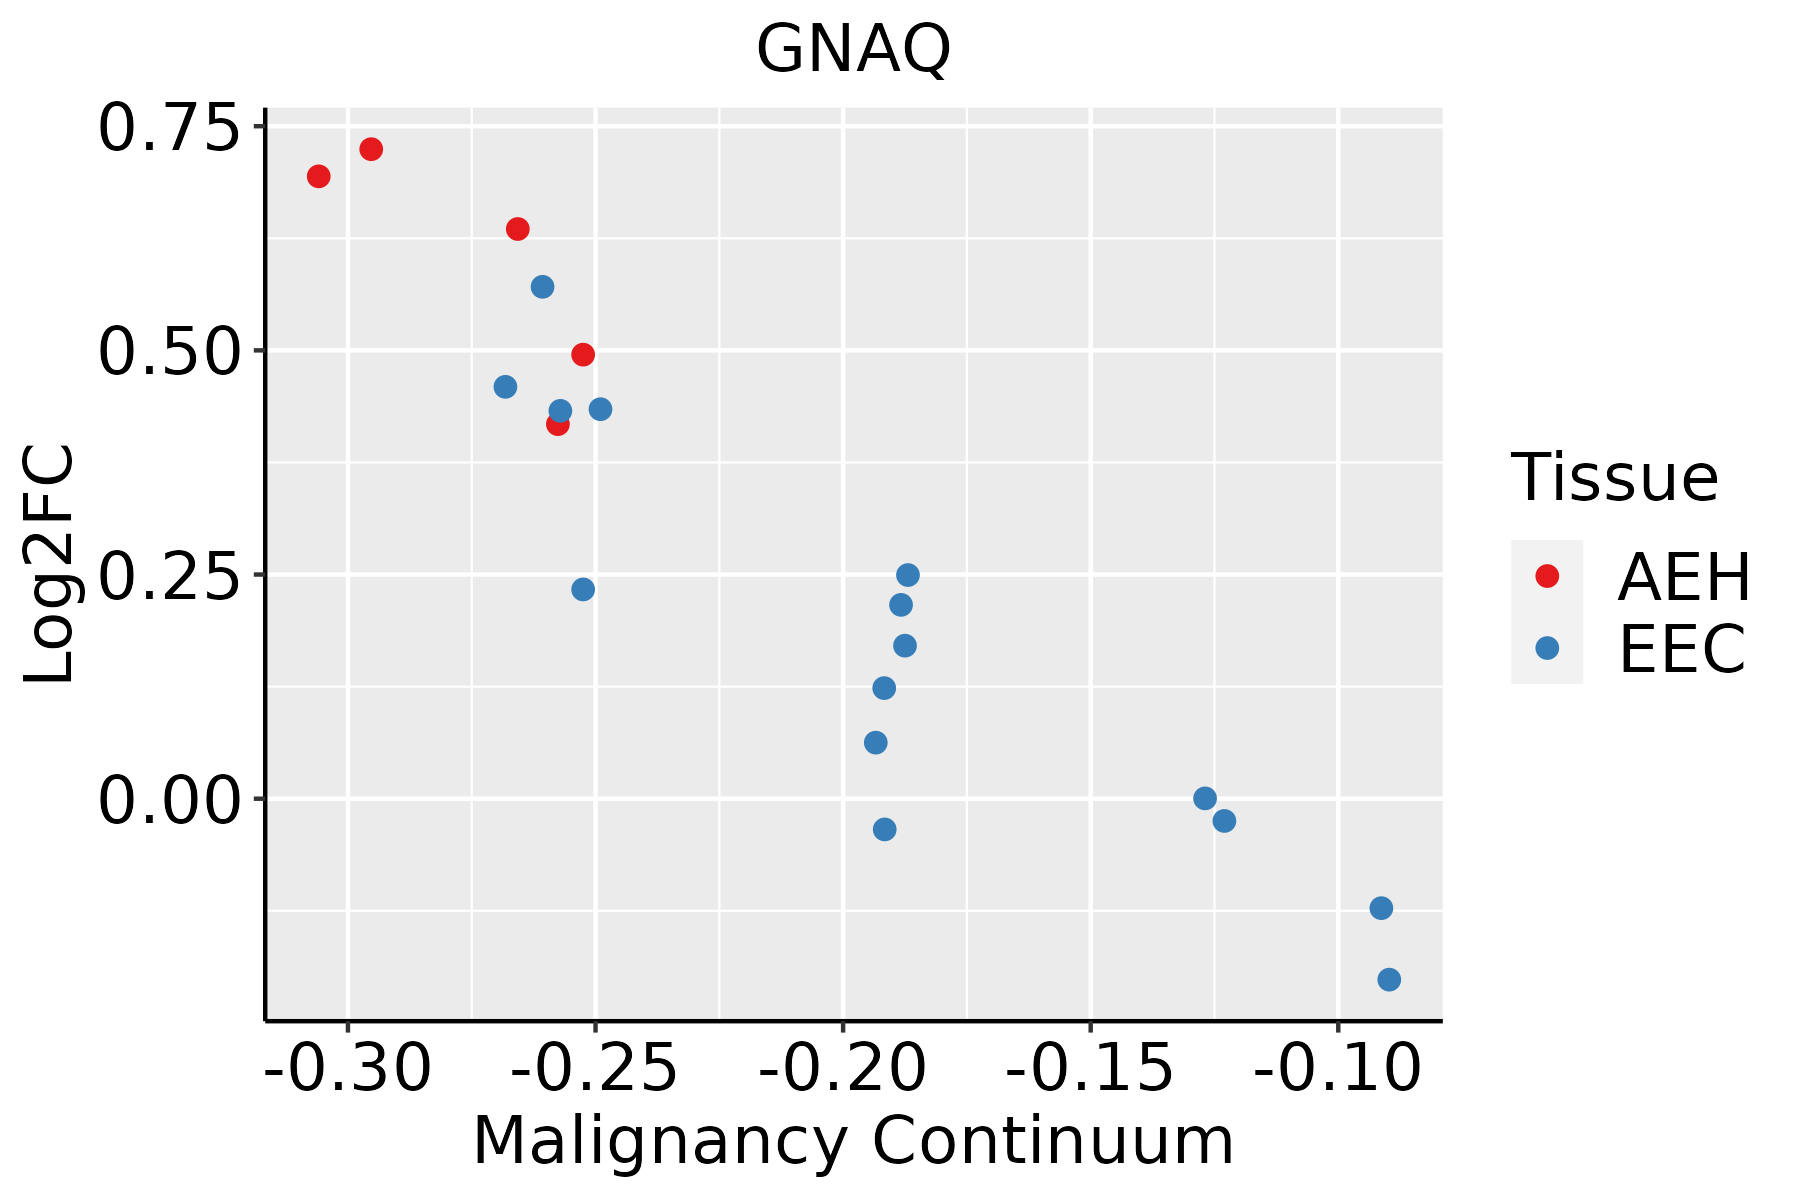 | AEH: Atypical endometrial hyperplasia |
| EEC: Endometrioid Cancer | ||
| GC | 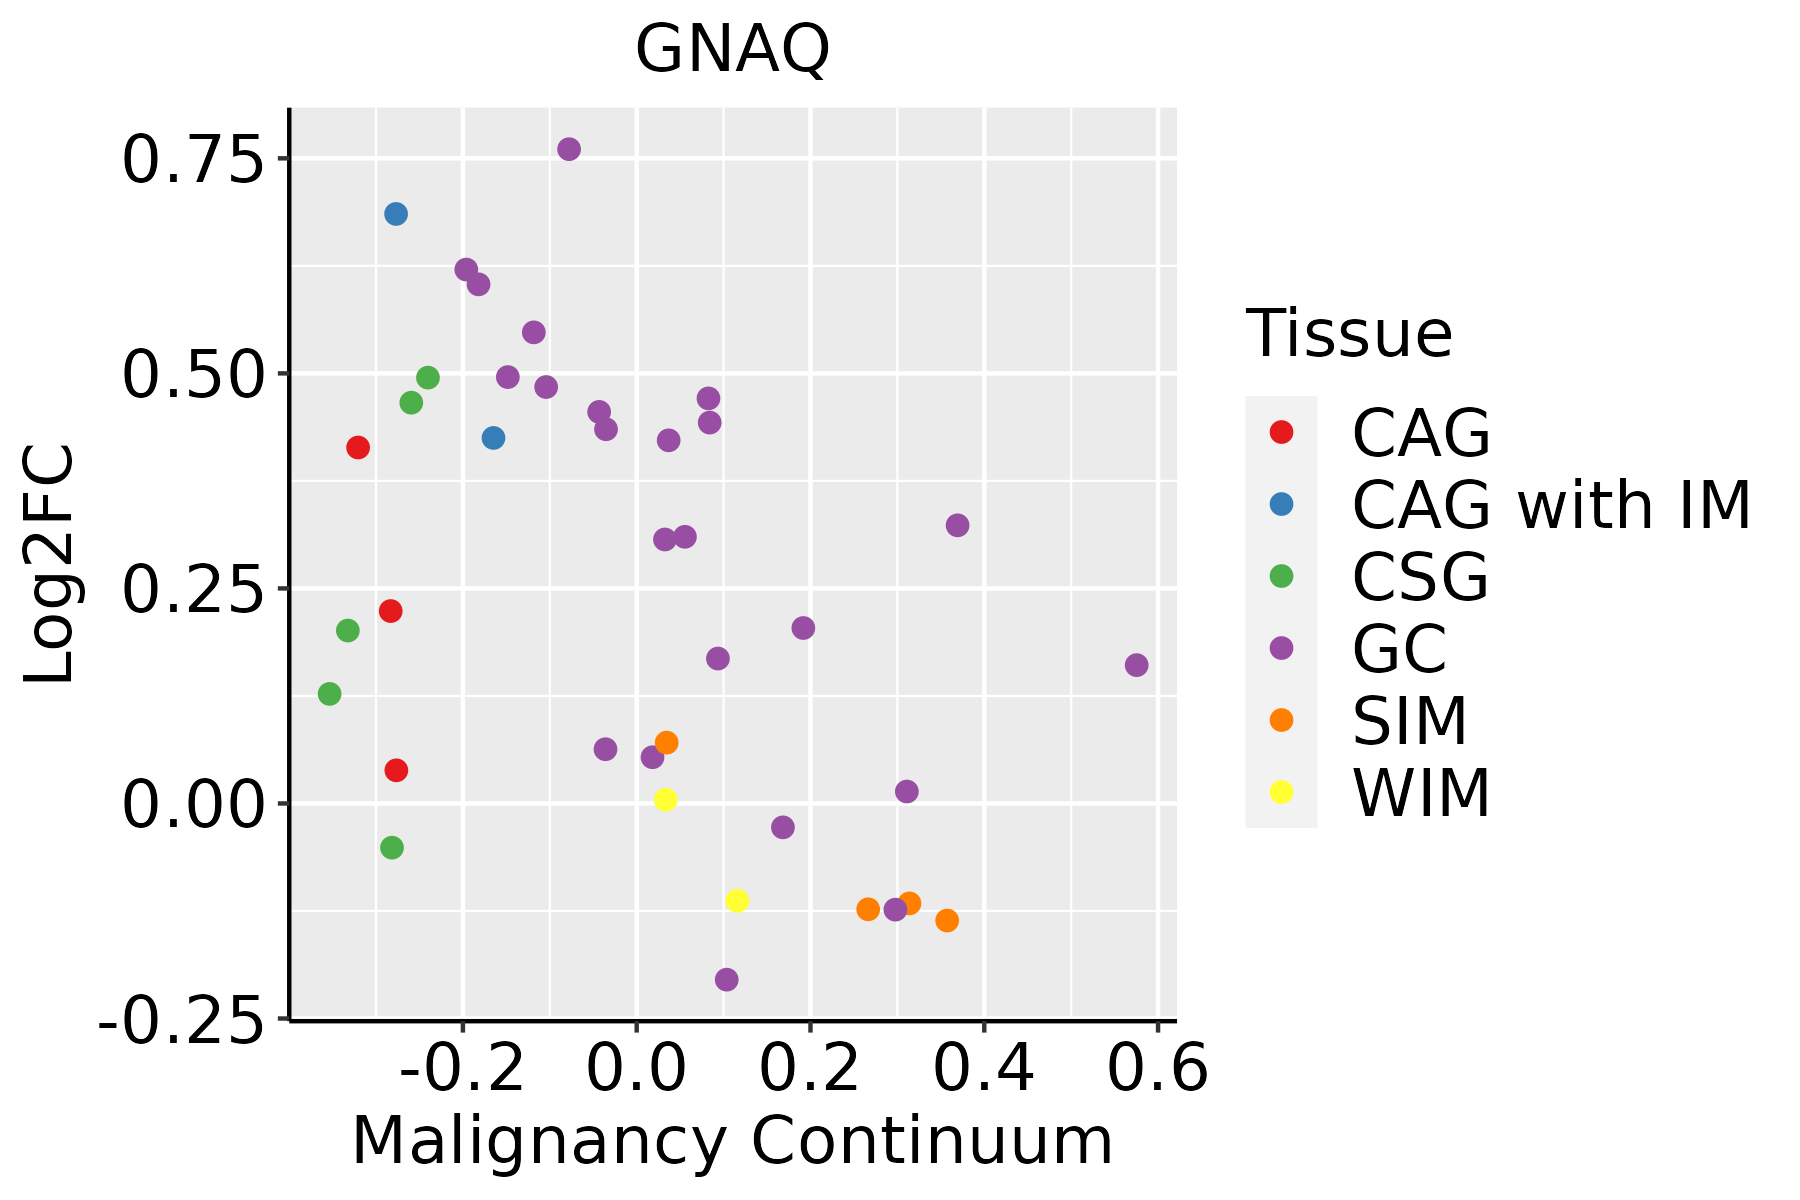 | CAG: Chronic atrophic gastritis |
| CAG with IM: Chronic atrophic gastritis with intestinal metaplasia | ||
| CSG: Chronic superficial gastritis | ||
| GC: Gastric cancer | ||
| SIM: Severe intestinal metaplasia | ||
| WIM: Wild intestinal metaplasia | ||
| Liver |  | HCC: Hepatocellular carcinoma |
| NAFLD: Non-alcoholic fatty liver disease | ||
| Lung |  | AAH: Atypical adenomatous hyperplasia |
| AIS: Adenocarcinoma in situ | ||
| IAC: Invasive lung adenocarcinoma | ||
| MIA: Minimally invasive adenocarcinoma | ||
| Oral Cavity | 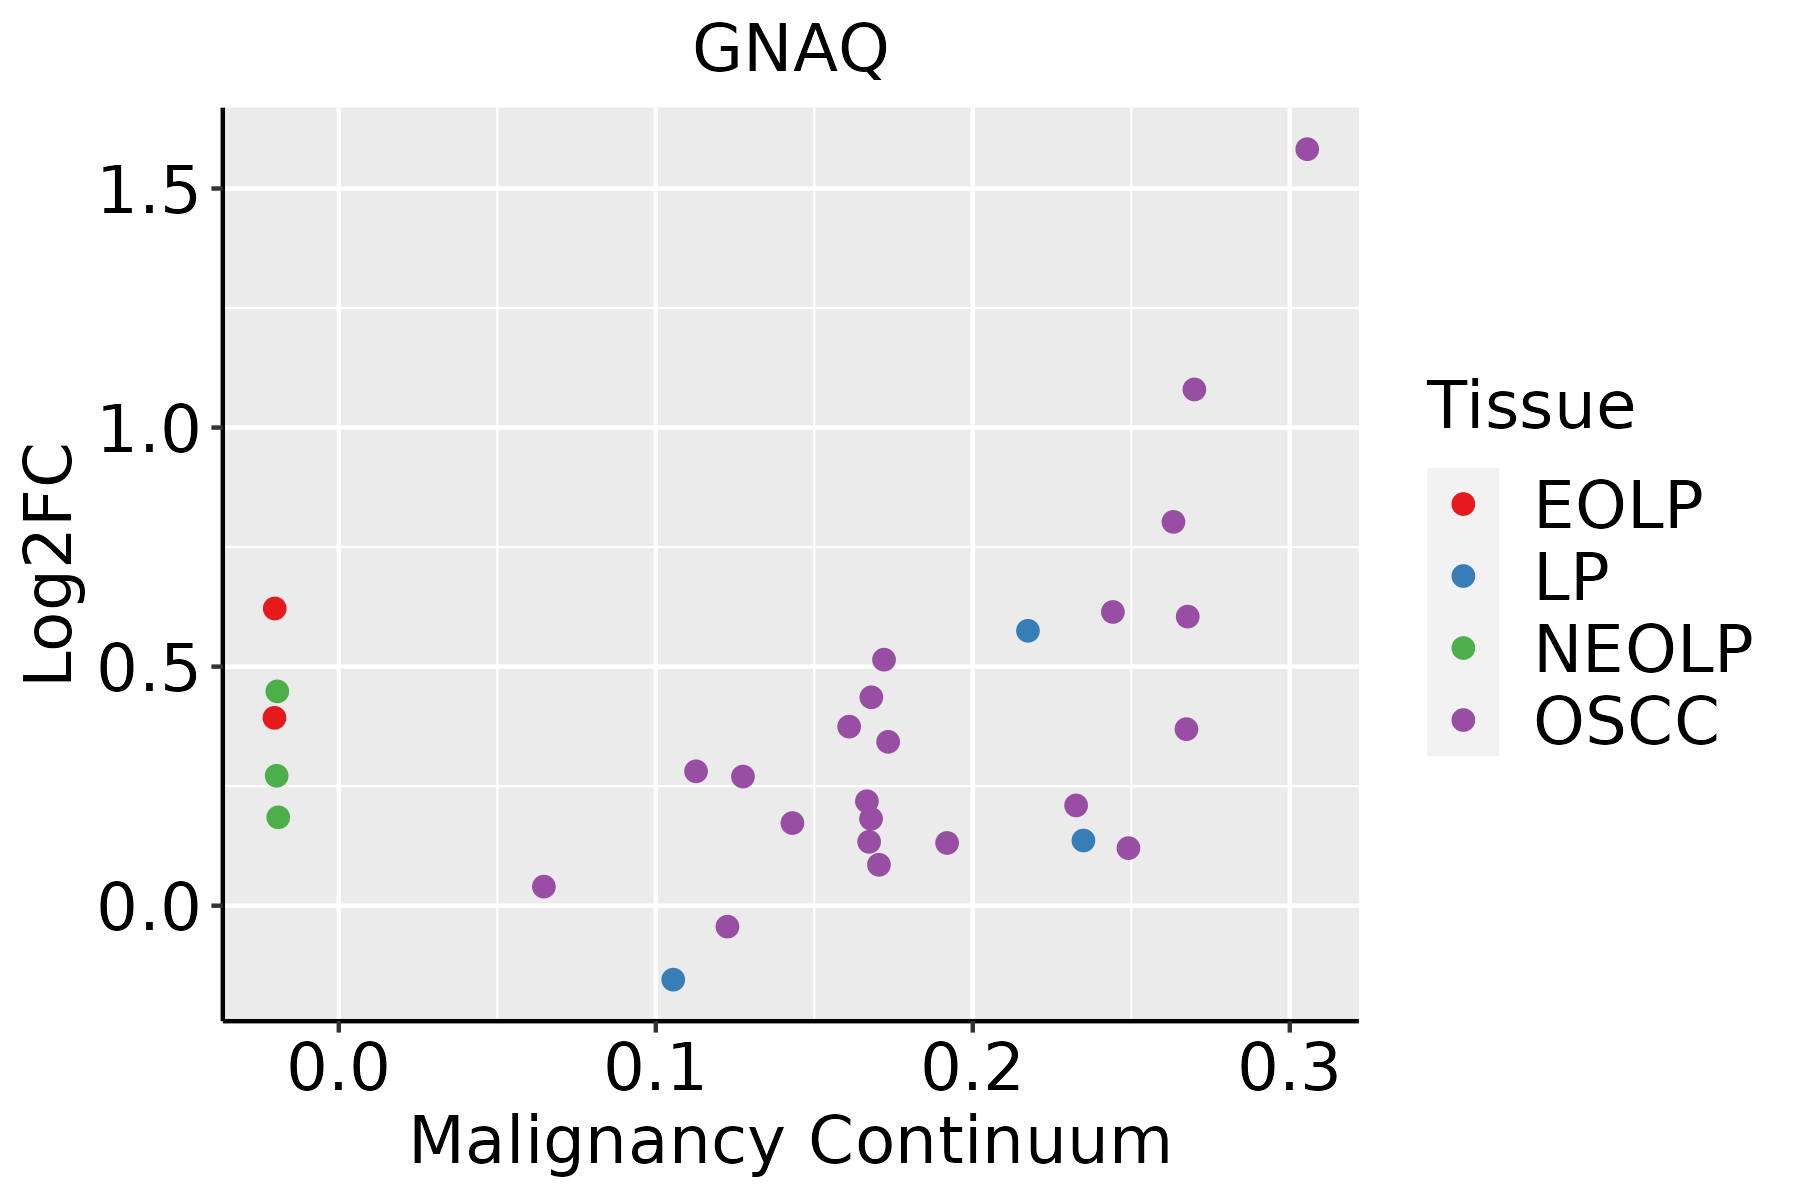 | EOLP: Erosive Oral lichen planus |
| LP: leukoplakia | ||
| NEOLP: Non-erosive oral lichen planus | ||
| OSCC: Oral squamous cell carcinoma | ||
| Prostate | 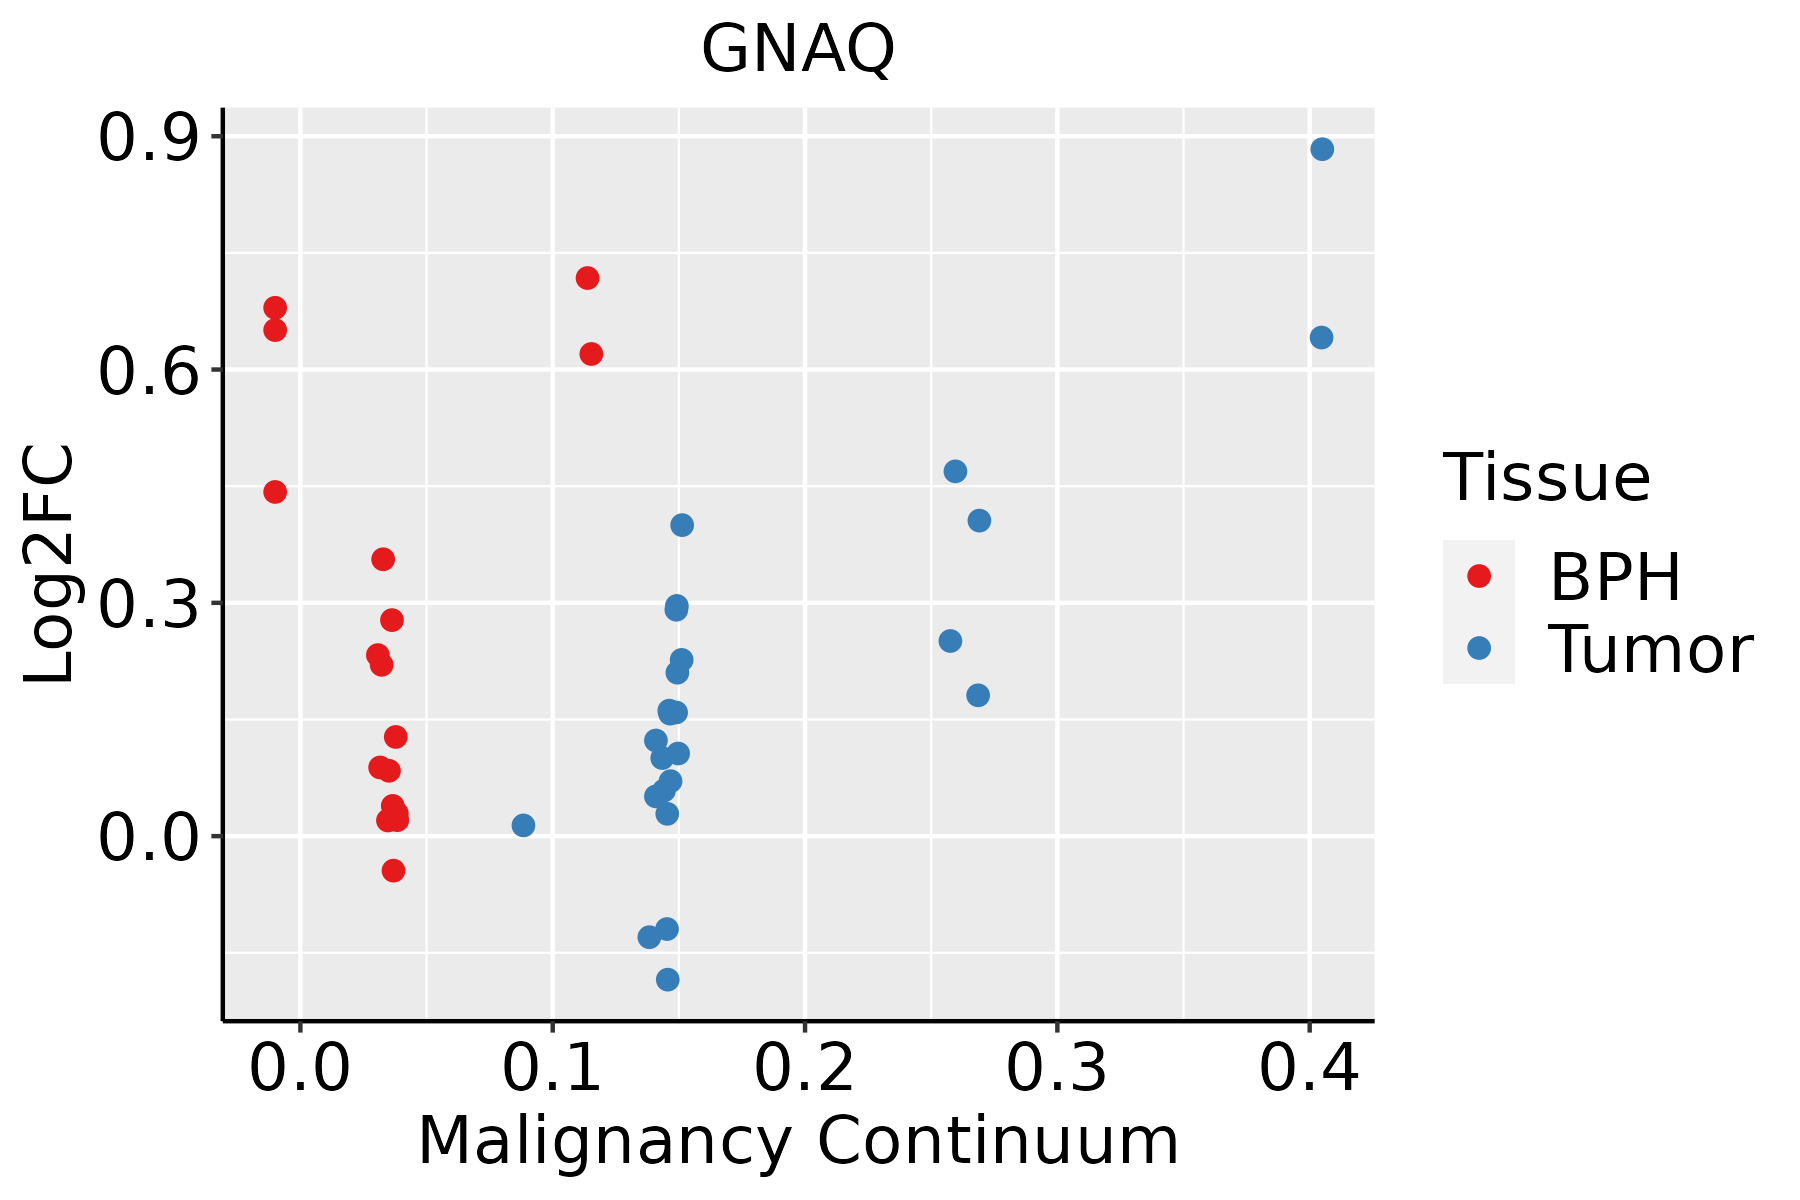 | BPH: Benign Prostatic Hyperplasia |
| Thyroid | 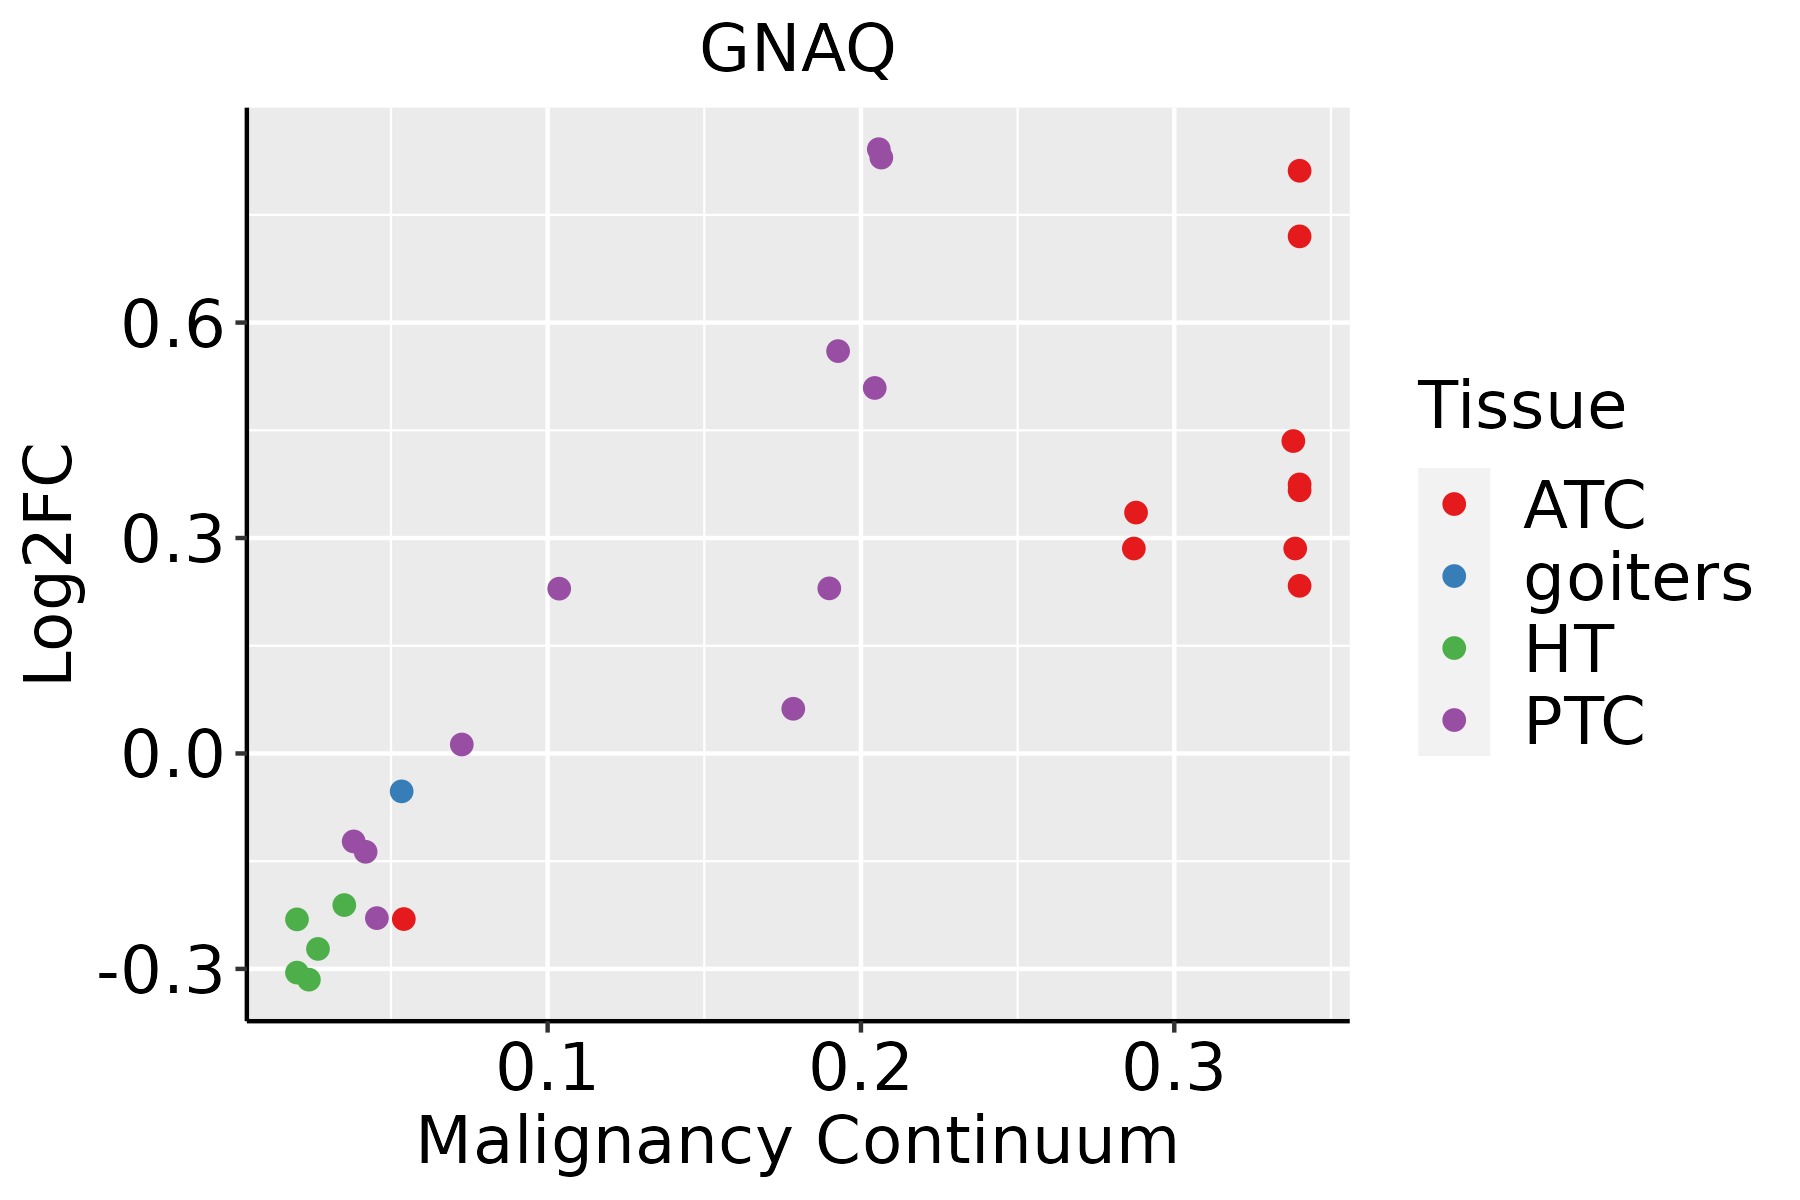 | ATC: Anaplastic thyroid cancer |
| HT: Hashimoto's thyroiditis | ||
| PTC: Papillary thyroid cancer |
| ∗log2FC in expression of this searched gene in stem-like cells from each diseased tissue sample relative to stem-like cells in normal samples in each tissue plotted against the malignancy continuum. Samples are colored based on if they are from different disease stage. |
Top |
Malignant transformation related pathway analysis |
| Find out the enriched GO biological processes and KEGG pathways involved in transition from healthy to precancer to cancer |
| Tissue | Disease Stage | Enriched GO biological Processes |
| Colorectum | AD |  |
| Colorectum | SER |  |
| Colorectum | MSS |  |
| Colorectum | MSI-H |  |
| Colorectum | FAP |  |
| ∗Top 15 enriched GO BP terms are showed in the bar plot of each disease state in each tissue. Each row represents a significant GO biological process which is colored according to the -log10(p.adjust). |
| Page: 1 2 3 4 5 6 7 8 9 |
| GO ID | Tissue | Disease Stage | Description | Gene Ratio | Bg Ratio | pvalue | p.adjust | Count |
| GO:004206010 | Cervix | CC | wound healing | 109/2311 | 422/18723 | 1.84e-14 | 1.57e-11 | 109 |
| GO:00160557 | Cervix | CC | Wnt signaling pathway | 98/2311 | 444/18723 | 4.82e-09 | 4.65e-07 | 98 |
| GO:01987387 | Cervix | CC | cell-cell signaling by wnt | 98/2311 | 446/18723 | 6.16e-09 | 5.58e-07 | 98 |
| GO:00301117 | Cervix | CC | regulation of Wnt signaling pathway | 76/2311 | 328/18723 | 3.05e-08 | 2.08e-06 | 76 |
| GO:00608287 | Cervix | CC | regulation of canonical Wnt signaling pathway | 58/2311 | 253/18723 | 1.83e-06 | 5.89e-05 | 58 |
| GO:00600707 | Cervix | CC | canonical Wnt signaling pathway | 66/2311 | 303/18723 | 2.47e-06 | 7.35e-05 | 66 |
| GO:005134810 | Cervix | CC | negative regulation of transferase activity | 60/2311 | 268/18723 | 2.77e-06 | 8.02e-05 | 60 |
| GO:00485118 | Cervix | CC | rhythmic process | 65/2311 | 298/18723 | 2.79e-06 | 8.04e-05 | 65 |
| GO:004593610 | Cervix | CC | negative regulation of phosphate metabolic process | 88/2311 | 441/18723 | 2.92e-06 | 8.27e-05 | 88 |
| GO:005087810 | Cervix | CC | regulation of body fluid levels | 78/2311 | 379/18723 | 3.20e-06 | 8.77e-05 | 78 |
| GO:001056310 | Cervix | CC | negative regulation of phosphorus metabolic process | 88/2311 | 442/18723 | 3.21e-06 | 8.77e-05 | 88 |
| GO:004232610 | Cervix | CC | negative regulation of phosphorylation | 77/2311 | 385/18723 | 1.09e-05 | 2.38e-04 | 77 |
| GO:003164710 | Cervix | CC | regulation of protein stability | 63/2311 | 298/18723 | 1.14e-05 | 2.45e-04 | 63 |
| GO:000193310 | Cervix | CC | negative regulation of protein phosphorylation | 69/2311 | 342/18723 | 2.29e-05 | 4.01e-04 | 69 |
| GO:00093149 | Cervix | CC | response to radiation | 86/2311 | 456/18723 | 3.50e-05 | 5.63e-04 | 86 |
| GO:000646910 | Cervix | CC | negative regulation of protein kinase activity | 47/2311 | 212/18723 | 4.13e-05 | 6.36e-04 | 47 |
| GO:005082110 | Cervix | CC | protein stabilization | 43/2311 | 191/18723 | 5.90e-05 | 8.54e-04 | 43 |
| GO:00076238 | Cervix | CC | circadian rhythm | 46/2311 | 210/18723 | 6.76e-05 | 9.60e-04 | 46 |
| GO:00336739 | Cervix | CC | negative regulation of kinase activity | 50/2311 | 237/18723 | 9.22e-05 | 1.21e-03 | 50 |
| GO:00508176 | Cervix | CC | coagulation | 45/2311 | 222/18723 | 5.08e-04 | 4.94e-03 | 45 |
| Page: 1 2 3 4 5 6 7 8 9 10 11 12 13 14 15 16 17 18 19 20 21 22 23 24 25 26 27 |
| Pathway ID | Tissue | Disease Stage | Description | Gene Ratio | Bg Ratio | pvalue | p.adjust | qvalue | Count |
| hsa0501018 | Cervix | CC | Alzheimer disease | 113/1267 | 384/8465 | 9.67e-14 | 3.92e-12 | 2.32e-12 | 113 |
| hsa0501618 | Cervix | CC | Huntington disease | 94/1267 | 306/8465 | 8.49e-13 | 3.06e-11 | 1.81e-11 | 94 |
| hsa0502218 | Cervix | CC | Pathways of neurodegeneration - multiple diseases | 128/1267 | 476/8465 | 2.87e-12 | 9.29e-11 | 5.50e-11 | 128 |
| hsa0516318 | Cervix | CC | Human cytomegalovirus infection | 65/1267 | 225/8465 | 4.59e-08 | 6.47e-07 | 3.83e-07 | 65 |
| hsa0491520 | Cervix | CC | Estrogen signaling pathway | 44/1267 | 138/8465 | 3.55e-07 | 3.97e-06 | 2.35e-06 | 44 |
| hsa0401512 | Cervix | CC | Rap1 signaling pathway | 56/1267 | 210/8465 | 6.23e-06 | 5.61e-05 | 3.32e-05 | 56 |
| hsa0472318 | Cervix | CC | Retrograde endocannabinoid signaling | 42/1267 | 148/8465 | 1.79e-05 | 1.42e-04 | 8.40e-05 | 42 |
| hsa0517016 | Cervix | CC | Human immunodeficiency virus 1 infection | 55/1267 | 212/8465 | 1.80e-05 | 1.42e-04 | 8.40e-05 | 55 |
| hsa0513516 | Cervix | CC | Yersinia infection | 39/1267 | 137/8465 | 3.27e-05 | 2.41e-04 | 1.42e-04 | 39 |
| hsa0407110 | Cervix | CC | Sphingolipid signaling pathway | 35/1267 | 121/8465 | 5.70e-05 | 3.93e-04 | 2.32e-04 | 35 |
| hsa051465 | Cervix | CC | Amoebiasis | 29/1267 | 102/8465 | 3.31e-04 | 1.70e-03 | 1.01e-03 | 29 |
| hsa0491212 | Cervix | CC | GnRH signaling pathway | 26/1267 | 93/8465 | 8.72e-04 | 3.87e-03 | 2.29e-03 | 26 |
| hsa0501716 | Cervix | CC | Spinocerebellar ataxia | 35/1267 | 143/8465 | 1.77e-03 | 7.21e-03 | 4.26e-03 | 35 |
| hsa0492812 | Cervix | CC | Parathyroid hormone synthesis, secretion and action | 27/1267 | 106/8465 | 3.12e-03 | 1.19e-02 | 7.03e-03 | 27 |
| hsa04062 | Cervix | CC | Chemokine signaling pathway | 43/1267 | 192/8465 | 3.60e-03 | 1.34e-02 | 7.91e-03 | 43 |
| hsa0497116 | Cervix | CC | Gastric acid secretion | 20/1267 | 76/8465 | 6.93e-03 | 2.27e-02 | 1.34e-02 | 20 |
| hsa04540 | Cervix | CC | Gap junction | 22/1267 | 88/8465 | 9.07e-03 | 2.85e-02 | 1.69e-02 | 22 |
| hsa049218 | Cervix | CC | Oxytocin signaling pathway | 34/1267 | 154/8465 | 1.12e-02 | 3.42e-02 | 2.02e-02 | 34 |
| hsa046115 | Cervix | CC | Platelet activation | 28/1267 | 124/8465 | 1.50e-02 | 4.45e-02 | 2.63e-02 | 28 |
| hsa0501019 | Cervix | CC | Alzheimer disease | 113/1267 | 384/8465 | 9.67e-14 | 3.92e-12 | 2.32e-12 | 113 |
| Page: 1 2 3 4 5 6 7 8 9 10 11 12 13 14 15 16 17 18 19 20 21 22 23 24 25 26 27 28 29 30 31 |
Top |
Cell-cell communication analysis |
| Identification of potential cell-cell interactions between two cell types and their ligand-receptor pairs for different disease states |
| Ligand | Receptor | LRpair | Pathway | Tissue | Disease Stage |
| Page: 1 |
Top |
Single-cell gene regulatory network inference analysis |
| Find out the significant the regulons (TFs) and the target genes of each regulon across cell types for different disease states |
| TF | Cell Type | Tissue | Disease Stage | Target Gene | RSS | Regulon Activity |
| ∗The dot plots of a searched regulon are shown for all cell subpopulations in each disease state of each tissue based on the regulon specific score inferred using pySCENIC and by calculating the average expression. |
| Page: 1 |
Top |
Somatic mutation of malignant transformation related genes |
| Annotation of somatic variants for genes involved in malignant transformation |
| Hugo Symbol | Variant Class | Variant Classification | dbSNP RS | HGVSc | HGVSp | HGVSp Short | SWISSPROT | BIOTYPE | SIFT | PolyPhen | Tumor Sample Barcode | Tissue | Histology | Sex | Age | Stage | Therapy Types | Drugs | Outcome |
| GNAQ | SNV | Missense_Mutation | novel | c.492N>T | p.Leu164Phe | p.L164F | P50148 | protein_coding | deleterious(0.02) | possibly_damaging(0.456) | TCGA-AN-A0AT-01 | Breast | breast invasive carcinoma | Female | <65 | I/II | Unknown | Unknown | SD |
| GNAQ | SNV | Missense_Mutation | novel | c.75C>G | p.Ile25Met | p.I25M | P50148 | protein_coding | deleterious(0) | probably_damaging(1) | TCGA-C8-A8HQ-01 | Breast | breast invasive carcinoma | Female | <65 | I/II | Unknown | Unknown | SD |
| GNAQ | SNV | Missense_Mutation | rs769002669 | c.676N>G | p.Ile226Val | p.I226V | P50148 | protein_coding | tolerated(0.06) | benign(0.106) | TCGA-FU-A40J-01 | Cervix | cervical & endocervical cancer | Female | <65 | III/IV | Chemotherapy | carboplatin | CR |
| GNAQ | SNV | Missense_Mutation | c.955G>A | p.Asp319Asn | p.D319N | P50148 | protein_coding | tolerated(0.19) | benign(0.014) | TCGA-Q1-A73O-01 | Cervix | cervical & endocervical cancer | Female | <65 | I/II | Chemotherapy | cisplatin | CR | |
| GNAQ | SNV | Missense_Mutation | rs397514698 | c.548N>A | p.Arg183Gln | p.R183Q | P50148 | protein_coding | deleterious(0.03) | probably_damaging(0.958) | TCGA-A6-5665-01 | Colorectum | colon adenocarcinoma | Female | >=65 | I/II | Unknown | Unknown | PD |
| GNAQ | SNV | Missense_Mutation | c.542N>C | p.Arg181Thr | p.R181T | P50148 | protein_coding | deleterious(0) | probably_damaging(0.995) | TCGA-AA-3666-01 | Colorectum | colon adenocarcinoma | Male | >=65 | III/IV | Unknown | Unknown | PD | |
| GNAQ | SNV | Missense_Mutation | c.403T>G | p.Leu135Val | p.L135V | P50148 | protein_coding | tolerated(0.06) | benign(0.118) | TCGA-AA-A010-01 | Colorectum | colon adenocarcinoma | Female | <65 | I/II | Chemotherapy | folinic | CR | |
| GNAQ | SNV | Missense_Mutation | c.524C>T | p.Thr175Met | p.T175M | P50148 | protein_coding | deleterious(0) | probably_damaging(0.987) | TCGA-AD-5900-01 | Colorectum | colon adenocarcinoma | Male | >=65 | I/II | Unknown | Unknown | SD | |
| GNAQ | SNV | Missense_Mutation | rs761634659 | c.254N>T | p.Thr85Met | p.T85M | P50148 | protein_coding | tolerated(0.42) | benign(0.015) | TCGA-AZ-6601-01 | Colorectum | colon adenocarcinoma | Male | >=65 | I/II | Unknown | Unknown | PD |
| GNAQ | SNV | Missense_Mutation | c.152G>T | p.Gly51Val | p.G51V | P50148 | protein_coding | deleterious(0) | probably_damaging(1) | TCGA-CM-4743-01 | Colorectum | colon adenocarcinoma | Male | >=65 | I/II | Chemotherapy | capecitabine | SD |
| Page: 1 2 3 4 |
Top |
Related drugs of malignant transformation related genes |
| Identification of chemicals and drugs interact with genes involved in malignant transfromation |
| (DGIdb 4.0) |
| Entrez ID | Symbol | Category | Interaction Types | Drug Claim Name | Drug Name | PMIDs |
| 2776 | GNAQ | CLINICALLY ACTIONABLE, DRUG RESISTANCE | Verteporfin | VERTEPORFIN | 27308390 | |
| 2776 | GNAQ | CLINICALLY ACTIONABLE, DRUG RESISTANCE | SOTRASTAURIN ACETATE | 24141786 | ||
| 2776 | GNAQ | CLINICALLY ACTIONABLE, DRUG RESISTANCE | Everolimus | EVEROLIMUS | 27507190 | |
| 2776 | GNAQ | CLINICALLY ACTIONABLE, DRUG RESISTANCE | MEK INHIBITOR PD0325901 | 24141786 | ||
| 2776 | GNAQ | CLINICALLY ACTIONABLE, DRUG RESISTANCE | PLX4720 | PLX-4720 | 24504448 | |
| 2776 | GNAQ | CLINICALLY ACTIONABLE, DRUG RESISTANCE | Selumetinib | SELUMETINIB | 22550165 | |
| 2776 | GNAQ | CLINICALLY ACTIONABLE, DRUG RESISTANCE | CGM097 | CGM-097 | 27507190 | |
| 2776 | GNAQ | CLINICALLY ACTIONABLE, DRUG RESISTANCE | U0126 | 19078957 | ||
| 2776 | GNAQ | CLINICALLY ACTIONABLE, DRUG RESISTANCE | MEK162 | BINIMETINIB | 27507190 | |
| 2776 | GNAQ | CLINICALLY ACTIONABLE, DRUG RESISTANCE | Refametinib | REFAMETINIB | 23434733 |
| Page: 1 2 |

Copyright 2023-Present -The University of Texas Health Science Center at Houston |