
|
|||||
|
 | |
| |
| |
| |
| |
| |
|
Gene: GNAI2 |
Gene summary for GNAI2 |
| Gene information | Species | Human | Gene symbol | GNAI2 | Gene ID | 2771 |
| Gene name | G protein subunit alpha i2 | |
| Gene Alias | GIP | |
| Cytomap | 3p21.31 | |
| Gene Type | protein-coding | GO ID | GO:0000165 | UniProtAcc | B3KP24 |
Top |
Malignant transformation analysis |
| Identification of the aberrant gene expression in precancerous and cancerous lesions by comparing the gene expression of stem-like cells in diseased tissues with normal stem cells |
| Entrez ID | Symbol | Replicates | Species | Organ | Tissue | Adj P-value | Log2FC | Malignancy |
| 2771 | GNAI2 | GSM4909281 | Human | Breast | IDC | 1.79e-09 | 3.76e-01 | 0.21 |
| 2771 | GNAI2 | GSM4909296 | Human | Breast | IDC | 5.33e-05 | -1.03e-01 | 0.1524 |
| 2771 | GNAI2 | GSM4909304 | Human | Breast | IDC | 9.69e-04 | 2.91e-01 | 0.1636 |
| 2771 | GNAI2 | GSM4909308 | Human | Breast | IDC | 2.69e-02 | 1.32e-01 | 0.158 |
| 2771 | GNAI2 | GSM4909311 | Human | Breast | IDC | 1.08e-09 | -9.54e-02 | 0.1534 |
| 2771 | GNAI2 | GSM4909312 | Human | Breast | IDC | 1.46e-04 | -1.15e-01 | 0.1552 |
| 2771 | GNAI2 | GSM4909317 | Human | Breast | IDC | 5.89e-04 | 2.66e-01 | 0.1355 |
| 2771 | GNAI2 | GSM4909319 | Human | Breast | IDC | 3.67e-11 | -1.69e-01 | 0.1563 |
| 2771 | GNAI2 | GSM4909321 | Human | Breast | IDC | 2.33e-04 | 1.52e-02 | 0.1559 |
| 2771 | GNAI2 | M1 | Human | Breast | IDC | 1.17e-09 | 3.92e-01 | 0.1577 |
| 2771 | GNAI2 | NCCBC14 | Human | Breast | DCIS | 1.12e-03 | 2.43e-01 | 0.2021 |
| 2771 | GNAI2 | NCCBC3 | Human | Breast | DCIS | 2.91e-15 | 5.96e-01 | 0.1198 |
| 2771 | GNAI2 | NCCBC5 | Human | Breast | DCIS | 3.80e-07 | 3.01e-01 | 0.2046 |
| 2771 | GNAI2 | DCIS2 | Human | Breast | DCIS | 5.42e-70 | 3.19e-01 | 0.0085 |
| 2771 | GNAI2 | CA_HPV_1 | Human | Cervix | CC | 1.92e-05 | 9.36e-02 | 0.0264 |
| 2771 | GNAI2 | CA_HPV_3 | Human | Cervix | CC | 1.60e-05 | -8.02e-02 | 0.0414 |
| 2771 | GNAI2 | CCI_1 | Human | Cervix | CC | 5.93e-04 | -5.95e-01 | 0.528 |
| 2771 | GNAI2 | CCI_3 | Human | Cervix | CC | 1.73e-05 | -5.13e-01 | 0.516 |
| 2771 | GNAI2 | CCII_1 | Human | Cervix | CC | 9.52e-23 | -8.30e-01 | 0.3249 |
| 2771 | GNAI2 | Tumor | Human | Cervix | CC | 1.77e-18 | -5.90e-01 | 0.1241 |
| Page: 1 2 3 4 5 6 7 8 9 10 |
| Tissue | Expression Dynamics | Abbreviation |
| Breast |  | IDC: Invasive ductal carcinoma |
| DCIS: Ductal carcinoma in situ | ||
| Precancer(BRCA1-mut): Precancerous lesion from BRCA1 mutation carriers | ||
| Cervix | 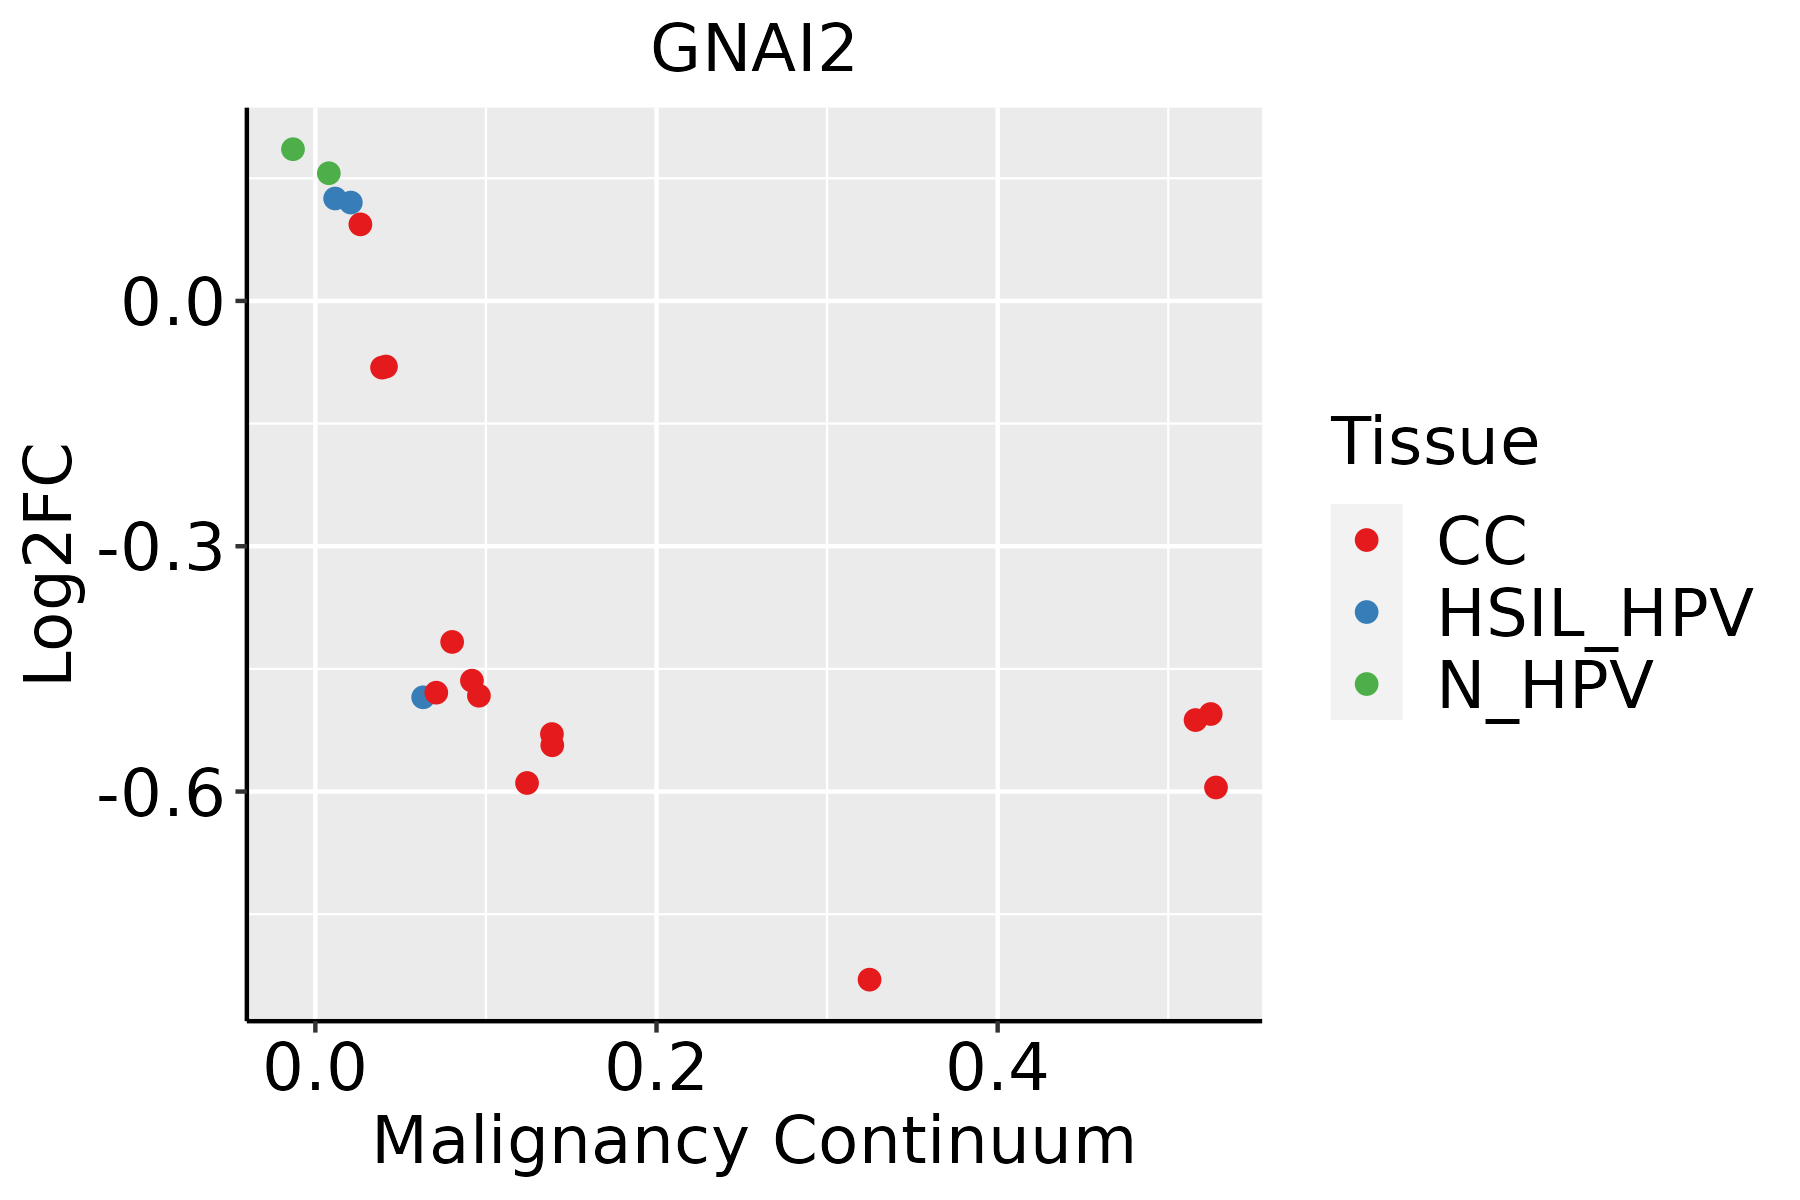 | CC: Cervix cancer |
| HSIL_HPV: HPV-infected high-grade squamous intraepithelial lesions | ||
| N_HPV: HPV-infected normal cervix | ||
| Colorectum (GSE201348) |  | FAP: Familial adenomatous polyposis |
| CRC: Colorectal cancer | ||
| Colorectum (HTA11) |  | AD: Adenomas |
| SER: Sessile serrated lesions | ||
| MSI-H: Microsatellite-high colorectal cancer | ||
| MSS: Microsatellite stable colorectal cancer | ||
| Endometrium | 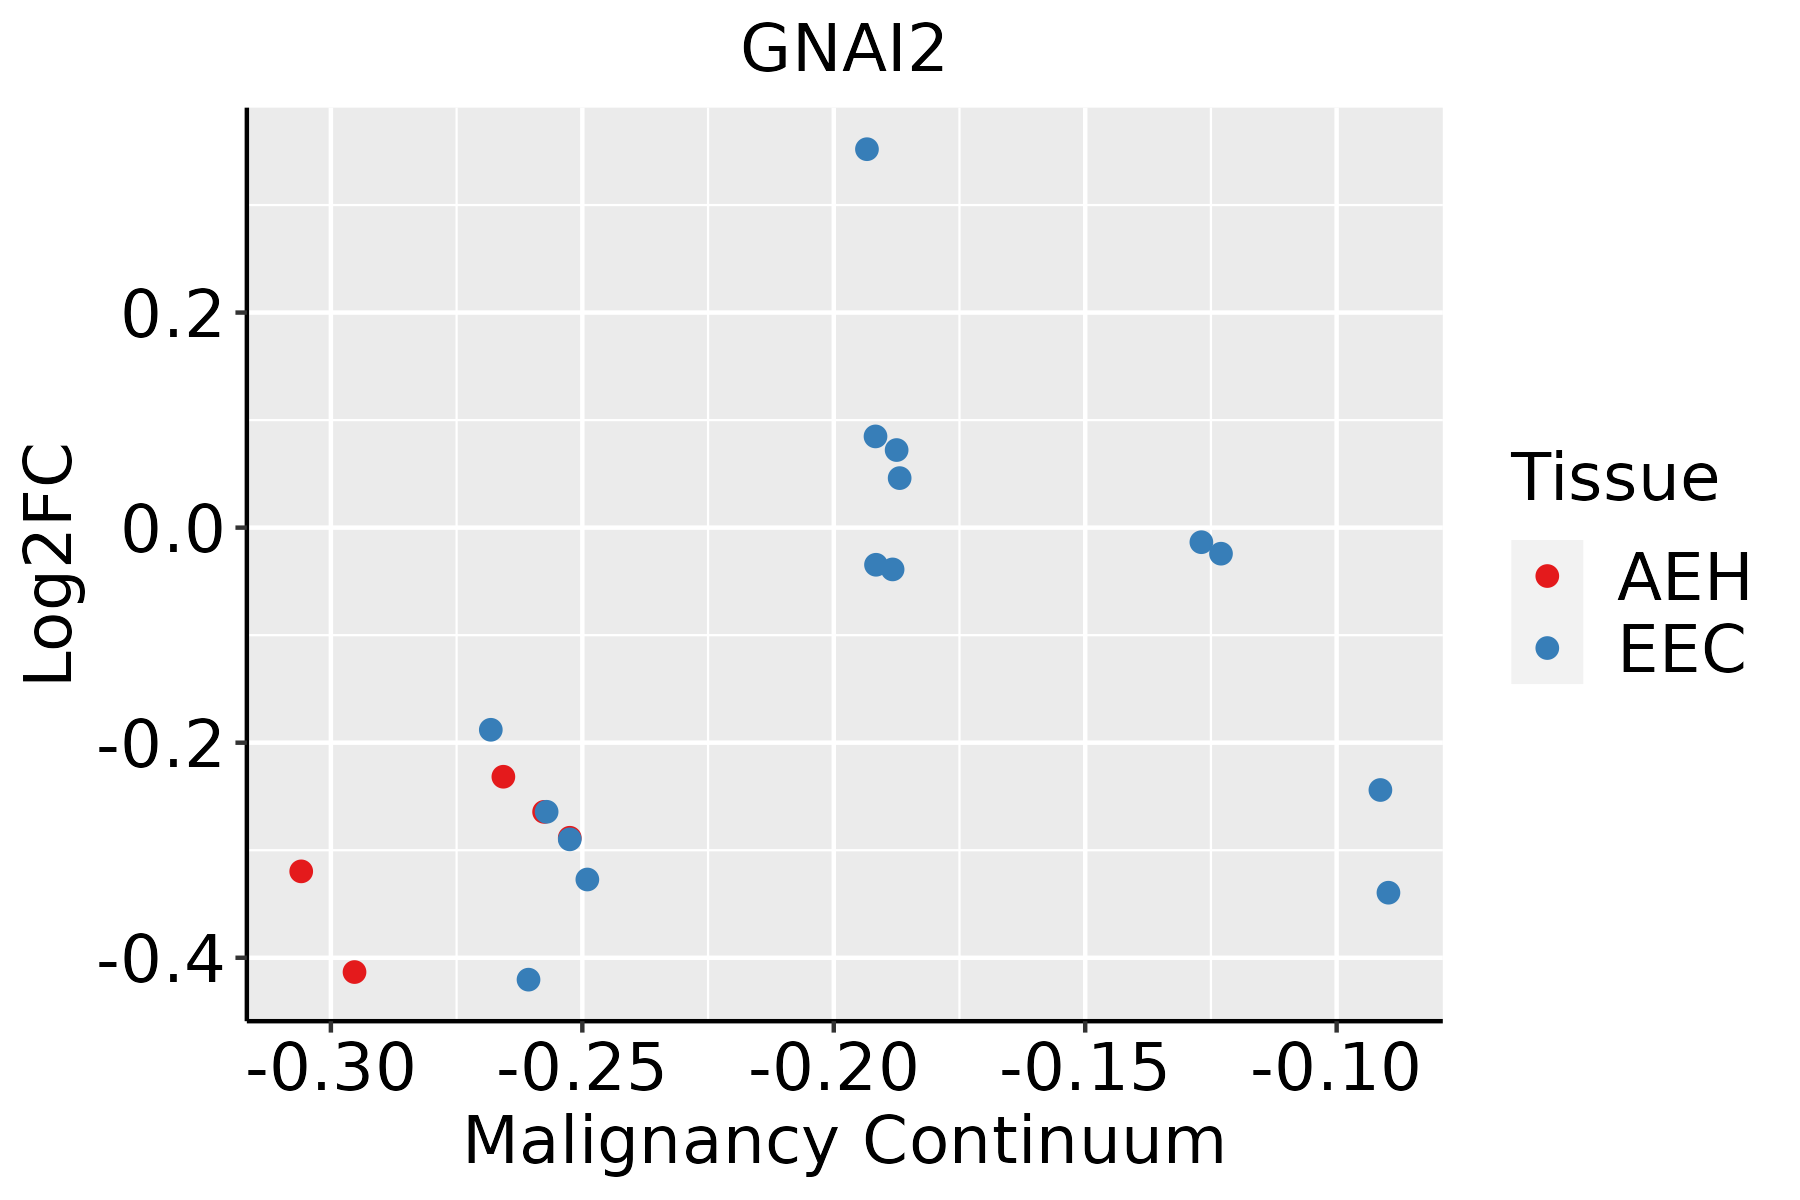 | AEH: Atypical endometrial hyperplasia |
| EEC: Endometrioid Cancer | ||
| Esophagus | 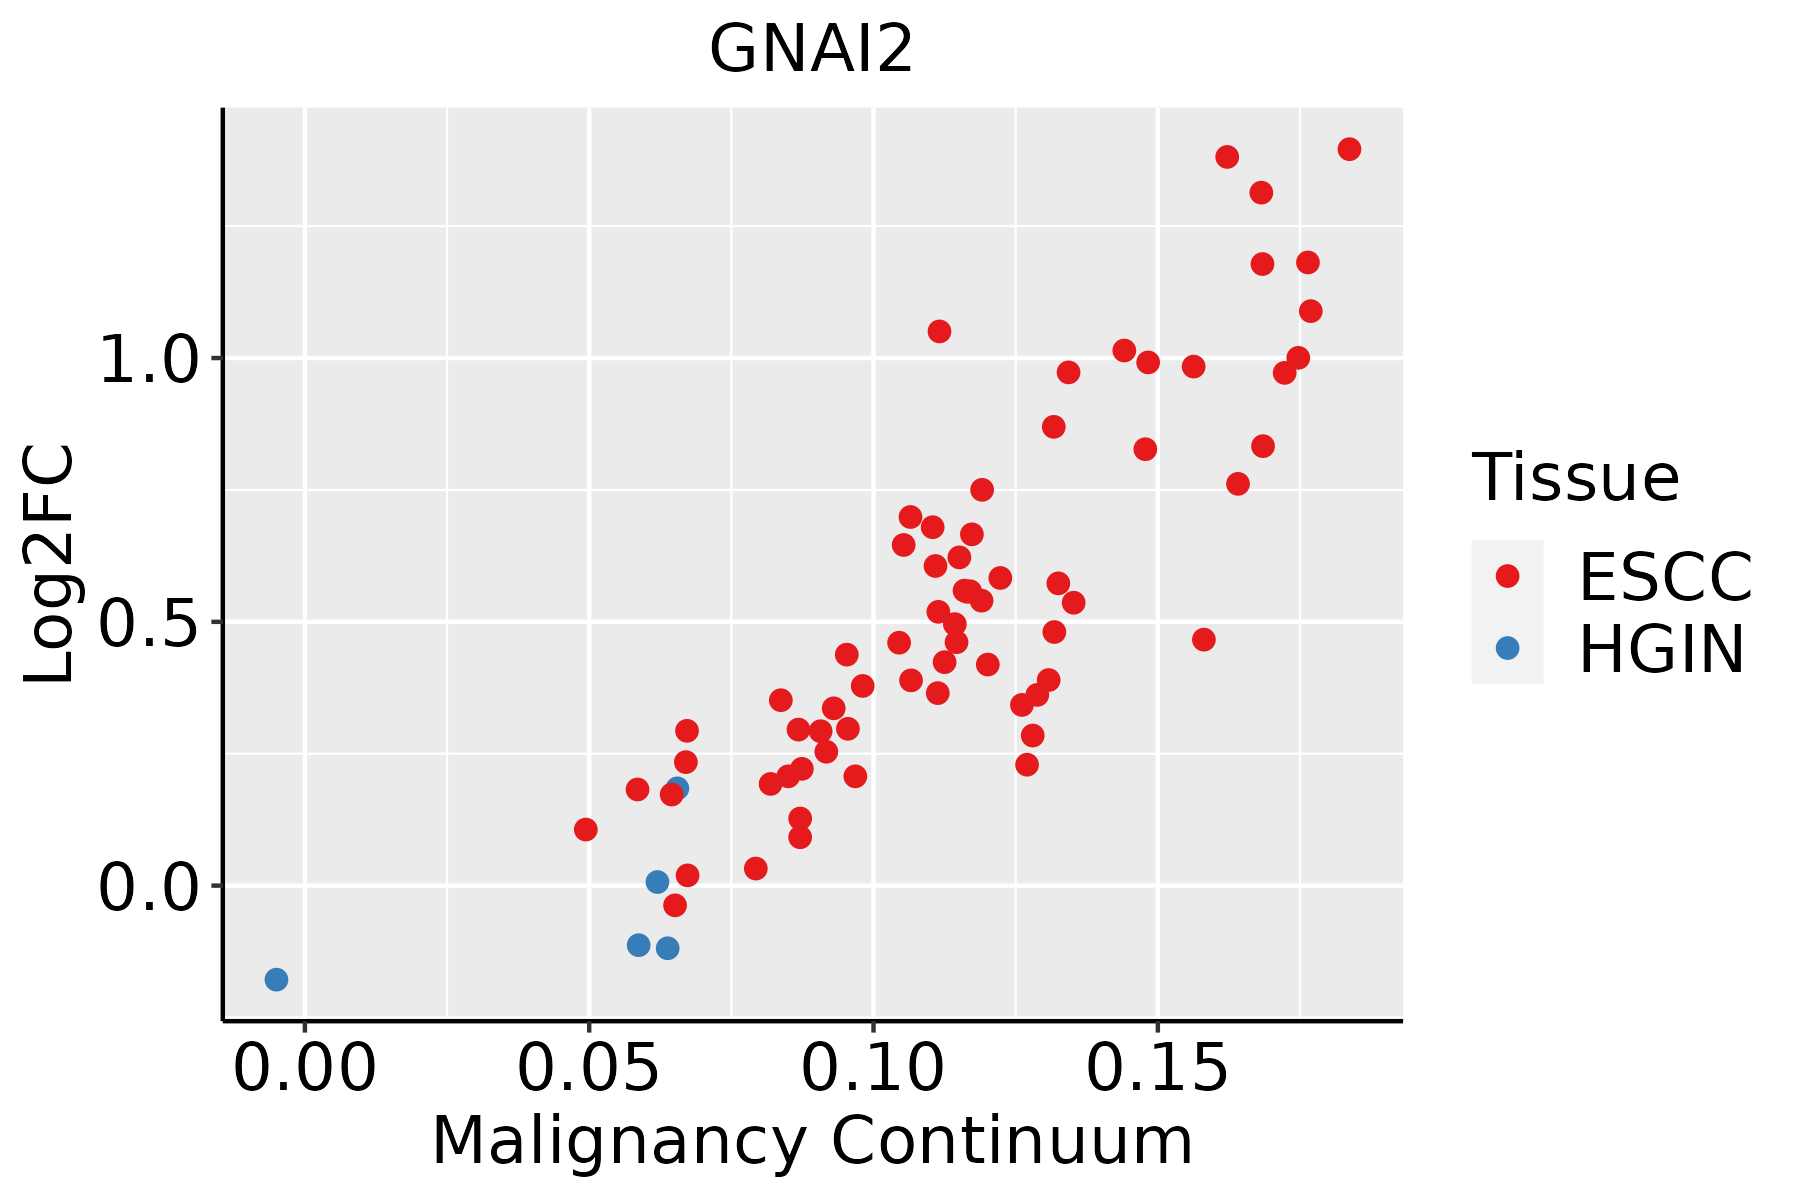 | ESCC: Esophageal squamous cell carcinoma |
| HGIN: High-grade intraepithelial neoplasias | ||
| LGIN: Low-grade intraepithelial neoplasias | ||
| Liver | 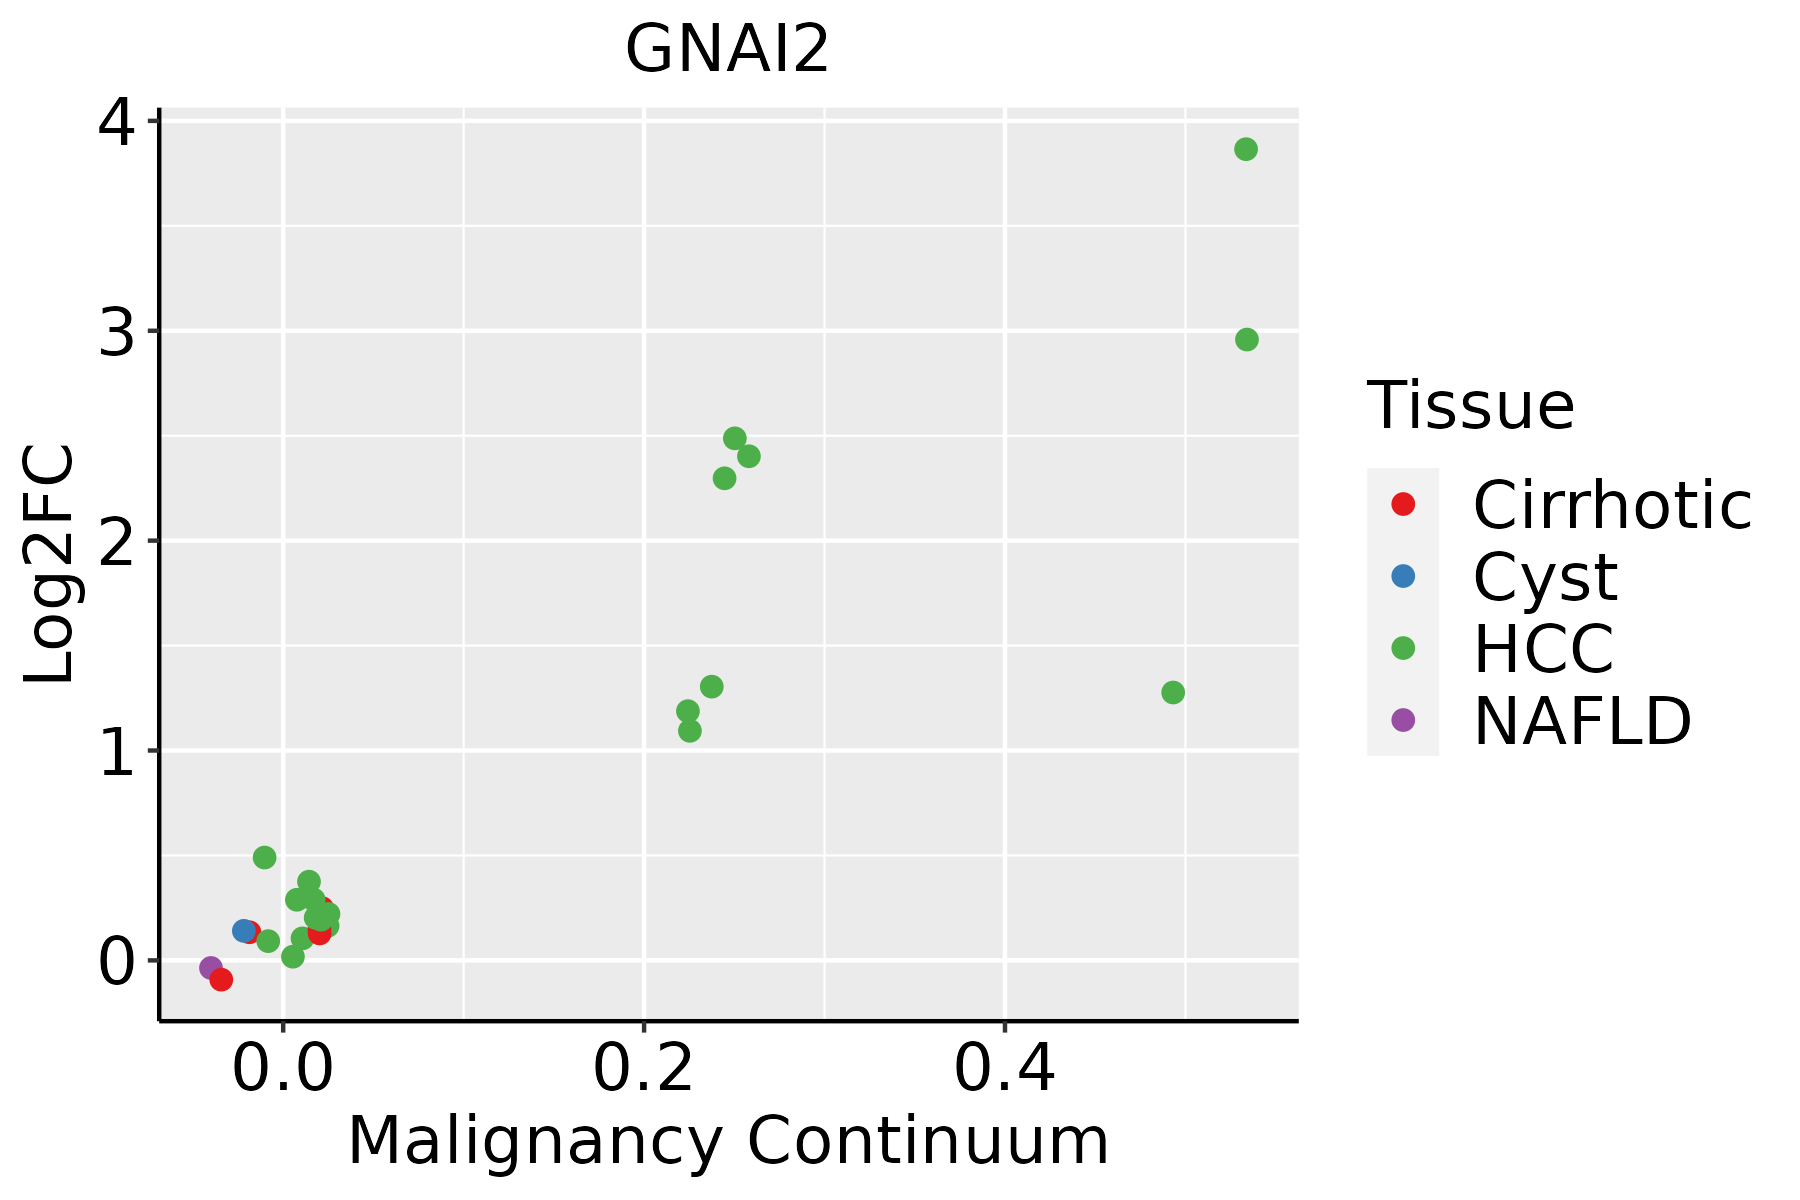 | HCC: Hepatocellular carcinoma |
| NAFLD: Non-alcoholic fatty liver disease | ||
| Oral Cavity |  | EOLP: Erosive Oral lichen planus |
| LP: leukoplakia | ||
| NEOLP: Non-erosive oral lichen planus | ||
| OSCC: Oral squamous cell carcinoma | ||
| Prostate | 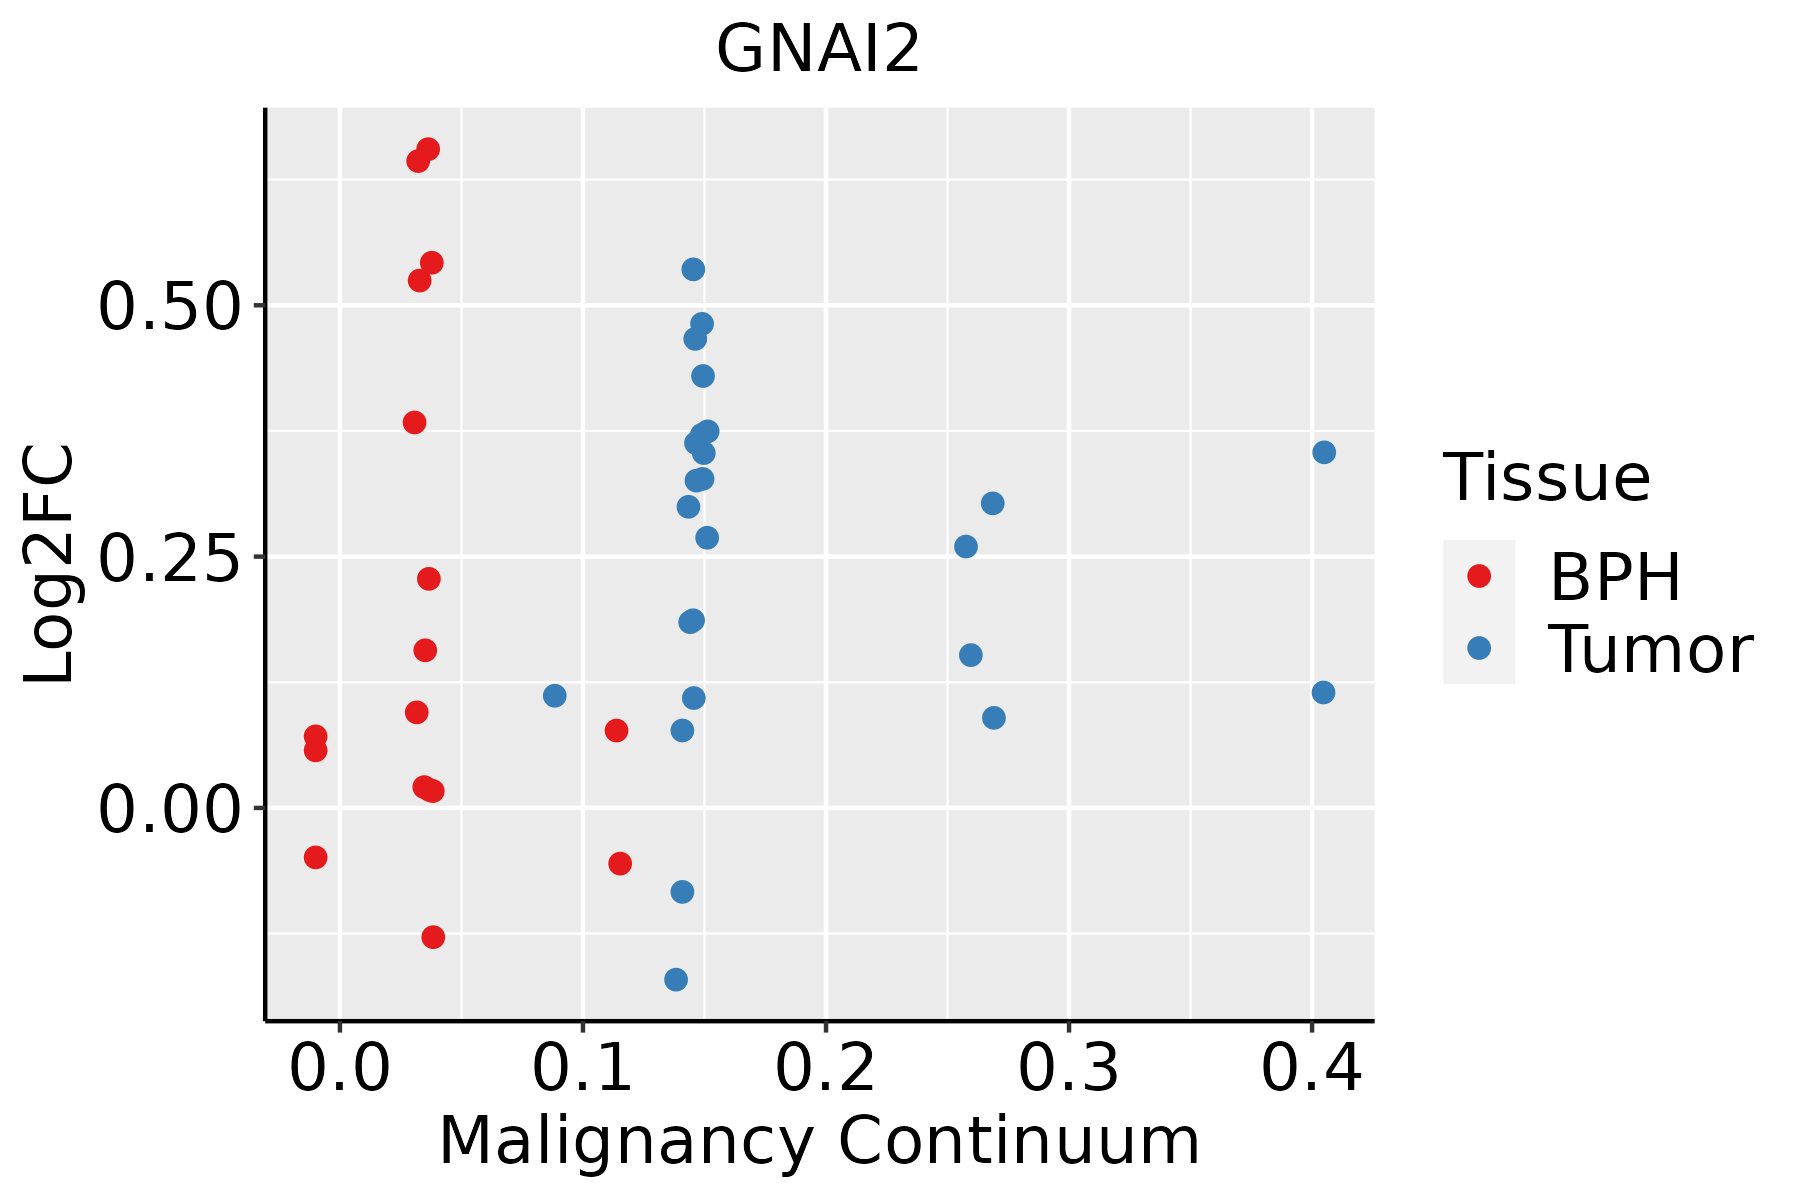 | BPH: Benign Prostatic Hyperplasia |
| Skin | 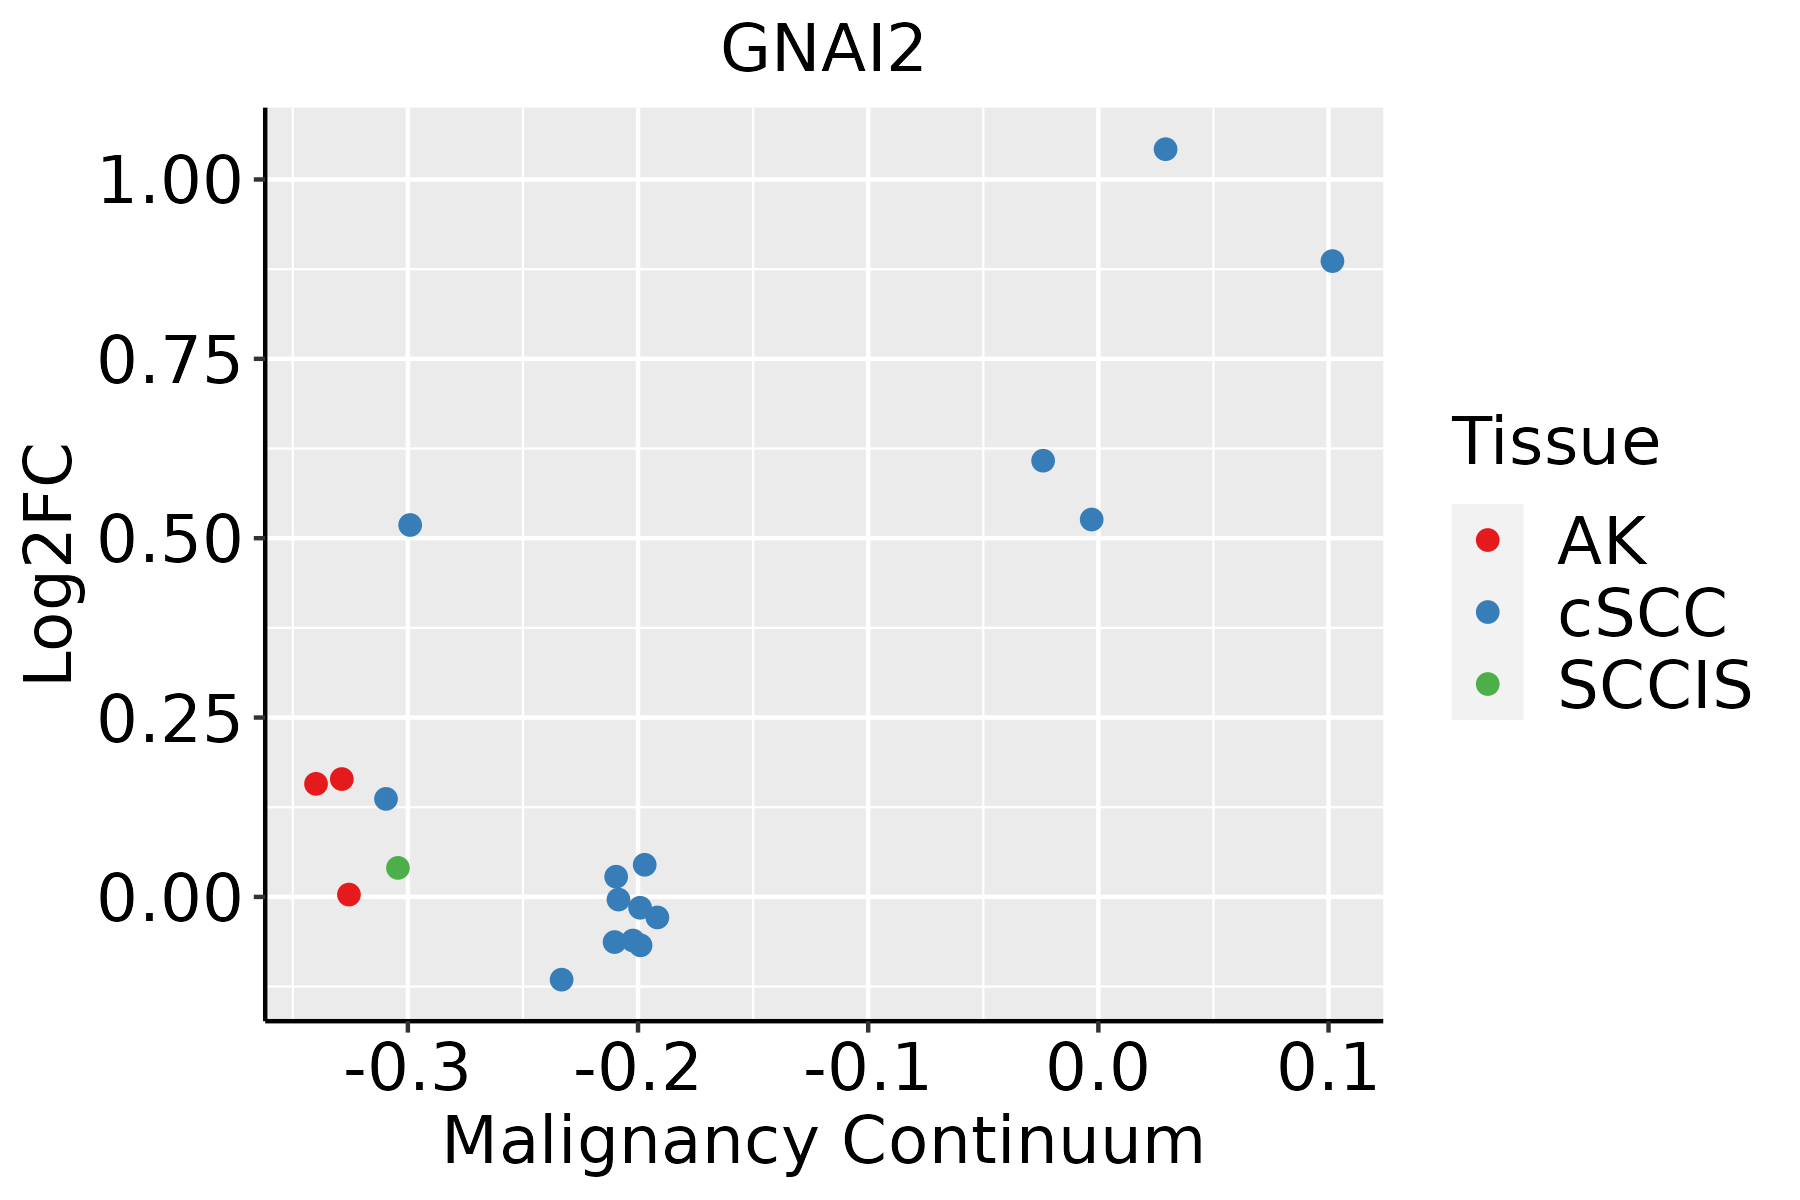 | AK: Actinic keratosis |
| cSCC: Cutaneous squamous cell carcinoma | ||
| SCCIS:squamous cell carcinoma in situ | ||
| Thyroid | 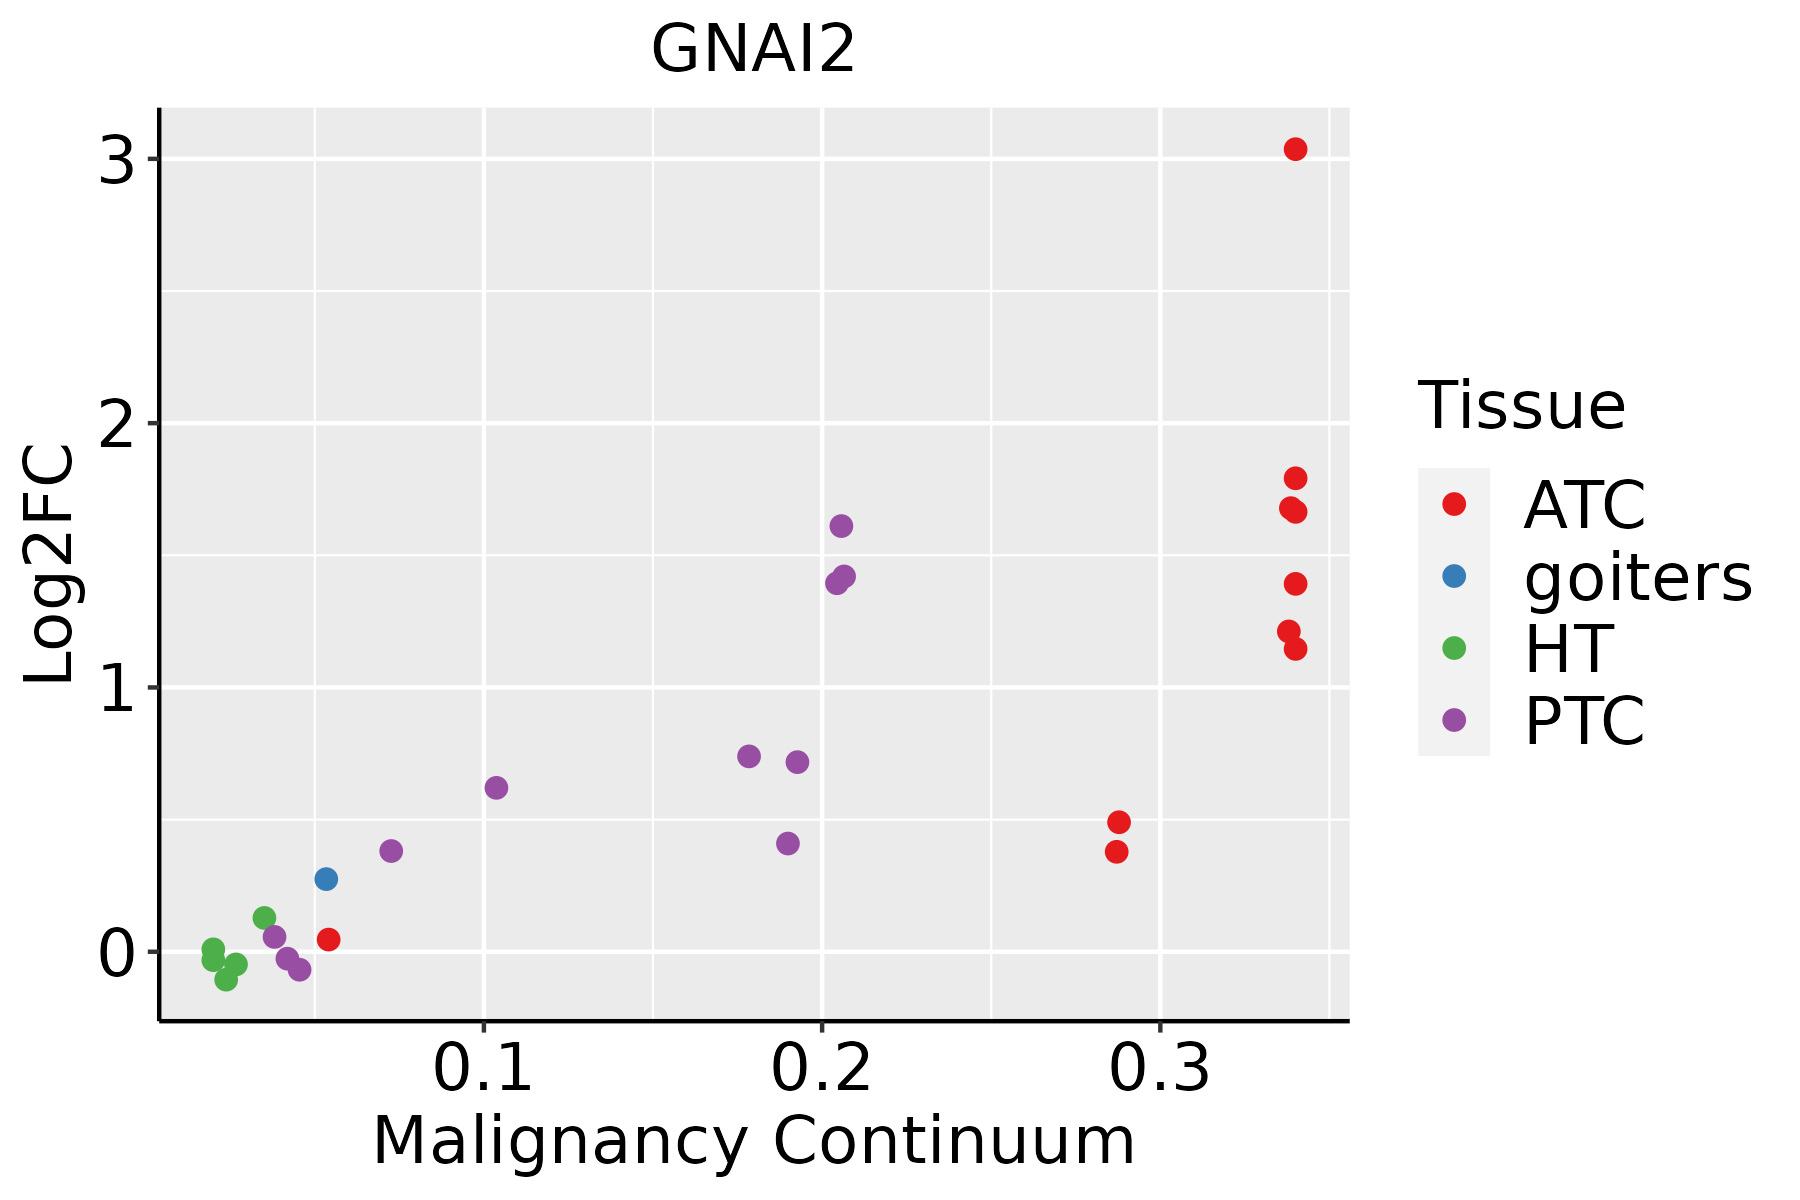 | ATC: Anaplastic thyroid cancer |
| HT: Hashimoto's thyroiditis | ||
| PTC: Papillary thyroid cancer |
| ∗log2FC in expression of this searched gene in stem-like cells from each diseased tissue sample relative to stem-like cells in normal samples in each tissue plotted against the malignancy continuum. Samples are colored based on if they are from different disease stage. |
Top |
Malignant transformation related pathway analysis |
| Find out the enriched GO biological processes and KEGG pathways involved in transition from healthy to precancer to cancer |
| Tissue | Disease Stage | Enriched GO biological Processes |
| Colorectum | AD |  |
| Colorectum | SER |  |
| Colorectum | MSS |  |
| Colorectum | MSI-H |  |
| Colorectum | FAP |  |
| ∗Top 15 enriched GO BP terms are showed in the bar plot of each disease state in each tissue. Each row represents a significant GO biological process which is colored according to the -log10(p.adjust). |
| Page: 1 2 3 4 5 6 7 8 9 |
| GO ID | Tissue | Disease Stage | Description | Gene Ratio | Bg Ratio | pvalue | p.adjust | Count |
| GO:200123314 | Breast | IDC | regulation of apoptotic signaling pathway | 82/1434 | 356/18723 | 6.27e-20 | 5.93e-17 | 82 |
| GO:005134613 | Breast | IDC | negative regulation of hydrolase activity | 71/1434 | 379/18723 | 1.33e-12 | 2.90e-10 | 71 |
| GO:200123414 | Breast | IDC | negative regulation of apoptotic signaling pathway | 49/1434 | 224/18723 | 1.45e-11 | 2.58e-09 | 49 |
| GO:003166714 | Breast | IDC | response to nutrient levels | 62/1434 | 474/18723 | 2.33e-05 | 5.57e-04 | 62 |
| GO:000758412 | Breast | IDC | response to nutrient | 29/1434 | 174/18723 | 5.69e-05 | 1.20e-03 | 29 |
| GO:007259313 | Breast | IDC | reactive oxygen species metabolic process | 36/1434 | 239/18723 | 7.16e-05 | 1.43e-03 | 36 |
| GO:00434348 | Breast | IDC | response to peptide hormone | 54/1434 | 414/18723 | 8.25e-05 | 1.61e-03 | 54 |
| GO:005087813 | Breast | IDC | regulation of body fluid levels | 50/1434 | 379/18723 | 1.12e-04 | 2.10e-03 | 50 |
| GO:003530414 | Breast | IDC | regulation of protein dephosphorylation | 18/1434 | 90/18723 | 1.39e-04 | 2.48e-03 | 18 |
| GO:001095913 | Breast | IDC | regulation of metal ion transport | 52/1434 | 406/18723 | 1.76e-04 | 2.97e-03 | 52 |
| GO:00703713 | Breast | IDC | ERK1 and ERK2 cascade | 43/1434 | 330/18723 | 4.28e-04 | 5.84e-03 | 43 |
| GO:00459369 | Breast | IDC | negative regulation of phosphate metabolic process | 53/1434 | 441/18723 | 7.21e-04 | 8.79e-03 | 53 |
| GO:00105639 | Breast | IDC | negative regulation of phosphorus metabolic process | 53/1434 | 442/18723 | 7.60e-04 | 9.25e-03 | 53 |
| GO:003530813 | Breast | IDC | negative regulation of protein dephosphorylation | 9/1434 | 34/18723 | 8.01e-04 | 9.58e-03 | 9 |
| GO:004366613 | Breast | IDC | regulation of phosphoprotein phosphatase activity | 12/1434 | 58/18723 | 1.27e-03 | 1.35e-02 | 12 |
| GO:200037913 | Breast | IDC | positive regulation of reactive oxygen species metabolic process | 14/1434 | 76/18723 | 1.71e-03 | 1.67e-02 | 14 |
| GO:00486592 | Breast | IDC | smooth muscle cell proliferation | 26/1434 | 184/18723 | 1.77e-03 | 1.72e-02 | 26 |
| GO:00486602 | Breast | IDC | regulation of smooth muscle cell proliferation | 25/1434 | 180/18723 | 2.71e-03 | 2.41e-02 | 25 |
| GO:0051924 | Breast | IDC | regulation of calcium ion transport | 32/1434 | 255/18723 | 3.94e-03 | 3.22e-02 | 32 |
| GO:200037713 | Breast | IDC | regulation of reactive oxygen species metabolic process | 22/1434 | 157/18723 | 4.24e-03 | 3.31e-02 | 22 |
| Page: 1 2 3 4 5 6 7 8 9 10 11 12 13 14 15 16 17 18 19 20 21 22 23 24 25 26 27 28 29 30 31 |
| Pathway ID | Tissue | Disease Stage | Description | Gene Ratio | Bg Ratio | pvalue | p.adjust | qvalue | Count |
| hsa0501224 | Breast | IDC | Parkinson disease | 107/867 | 266/8465 | 2.57e-39 | 8.36e-37 | 6.26e-37 | 107 |
| hsa0491523 | Breast | IDC | Estrogen signaling pathway | 35/867 | 138/8465 | 2.55e-07 | 5.18e-06 | 3.88e-06 | 35 |
| hsa0472323 | Breast | IDC | Retrograde endocannabinoid signaling | 31/867 | 148/8465 | 7.62e-05 | 7.50e-04 | 5.61e-04 | 31 |
| hsa0516324 | Breast | IDC | Human cytomegalovirus infection | 39/867 | 225/8465 | 6.66e-04 | 5.41e-03 | 4.05e-03 | 39 |
| hsa0497122 | Breast | IDC | Gastric acid secretion | 16/867 | 76/8465 | 3.80e-03 | 2.33e-02 | 1.74e-02 | 16 |
| hsa0467024 | Breast | IDC | Leukocyte transendothelial migration | 21/867 | 114/8465 | 5.41e-03 | 3.13e-02 | 2.34e-02 | 21 |
| hsa0517014 | Breast | IDC | Human immunodeficiency virus 1 infection | 33/867 | 212/8465 | 9.28e-03 | 4.37e-02 | 3.27e-02 | 33 |
| hsa0501234 | Breast | IDC | Parkinson disease | 107/867 | 266/8465 | 2.57e-39 | 8.36e-37 | 6.26e-37 | 107 |
| hsa0491533 | Breast | IDC | Estrogen signaling pathway | 35/867 | 138/8465 | 2.55e-07 | 5.18e-06 | 3.88e-06 | 35 |
| hsa0472333 | Breast | IDC | Retrograde endocannabinoid signaling | 31/867 | 148/8465 | 7.62e-05 | 7.50e-04 | 5.61e-04 | 31 |
| hsa0516334 | Breast | IDC | Human cytomegalovirus infection | 39/867 | 225/8465 | 6.66e-04 | 5.41e-03 | 4.05e-03 | 39 |
| hsa0497132 | Breast | IDC | Gastric acid secretion | 16/867 | 76/8465 | 3.80e-03 | 2.33e-02 | 1.74e-02 | 16 |
| hsa0467034 | Breast | IDC | Leukocyte transendothelial migration | 21/867 | 114/8465 | 5.41e-03 | 3.13e-02 | 2.34e-02 | 21 |
| hsa0517015 | Breast | IDC | Human immunodeficiency virus 1 infection | 33/867 | 212/8465 | 9.28e-03 | 4.37e-02 | 3.27e-02 | 33 |
| hsa0501243 | Breast | DCIS | Parkinson disease | 106/846 | 266/8465 | 1.64e-39 | 5.29e-37 | 3.90e-37 | 106 |
| hsa0491542 | Breast | DCIS | Estrogen signaling pathway | 35/846 | 138/8465 | 1.40e-07 | 2.51e-06 | 1.85e-06 | 35 |
| hsa0472342 | Breast | DCIS | Retrograde endocannabinoid signaling | 29/846 | 148/8465 | 2.82e-04 | 2.34e-03 | 1.72e-03 | 29 |
| hsa0516344 | Breast | DCIS | Human cytomegalovirus infection | 38/846 | 225/8465 | 8.11e-04 | 5.95e-03 | 4.38e-03 | 38 |
| hsa0497142 | Breast | DCIS | Gastric acid secretion | 16/846 | 76/8465 | 2.97e-03 | 1.81e-02 | 1.33e-02 | 16 |
| hsa0467044 | Breast | DCIS | Leukocyte transendothelial migration | 21/846 | 114/8465 | 4.07e-03 | 2.31e-02 | 1.70e-02 | 21 |
| Page: 1 2 3 4 5 6 7 8 9 10 11 12 13 14 15 16 17 18 19 |
Top |
Cell-cell communication analysis |
| Identification of potential cell-cell interactions between two cell types and their ligand-receptor pairs for different disease states |
| Ligand | Receptor | LRpair | Pathway | Tissue | Disease Stage |
| Page: 1 |
Top |
Single-cell gene regulatory network inference analysis |
| Find out the significant the regulons (TFs) and the target genes of each regulon across cell types for different disease states |
| TF | Cell Type | Tissue | Disease Stage | Target Gene | RSS | Regulon Activity |
| ∗The dot plots of a searched regulon are shown for all cell subpopulations in each disease state of each tissue based on the regulon specific score inferred using pySCENIC and by calculating the average expression. |
| Page: 1 |
Top |
Somatic mutation of malignant transformation related genes |
| Annotation of somatic variants for genes involved in malignant transformation |
| Hugo Symbol | Variant Class | Variant Classification | dbSNP RS | HGVSc | HGVSp | HGVSp Short | SWISSPROT | BIOTYPE | SIFT | PolyPhen | Tumor Sample Barcode | Tissue | Histology | Sex | Age | Stage | Therapy Types | Drugs | Outcome |
| GNAI2 | SNV | Missense_Mutation | novel | c.889T>C | p.Tyr297His | p.Y297H | P04899 | protein_coding | deleterious(0.01) | probably_damaging(0.959) | TCGA-5T-A9QA-01 | Breast | breast invasive carcinoma | Female | <65 | I/II | Chemotherapy | taxol | SD |
| GNAI2 | SNV | Missense_Mutation | c.109N>A | p.Leu37Met | p.L37M | P04899 | protein_coding | deleterious(0) | probably_damaging(0.971) | TCGA-BH-A0DL-01 | Breast | breast invasive carcinoma | Female | <65 | I/II | Chemotherapy | cytoxan | CR | |
| GNAI2 | SNV | Missense_Mutation | c.292N>T | p.Pro98Ser | p.P98S | P04899 | protein_coding | tolerated(0.37) | benign(0.005) | TCGA-BH-A1FJ-01 | Breast | breast invasive carcinoma | Female | >=65 | III/IV | Unknown | Unknown | SD | |
| GNAI2 | SNV | Missense_Mutation | novel | c.706N>T | p.Ala236Ser | p.A236S | P04899 | protein_coding | tolerated(0.38) | benign(0.115) | TCGA-S3-AA15-01 | Breast | breast invasive carcinoma | Female | <65 | I/II | Chemotherapy | adriamycin | CR |
| GNAI2 | deletion | Frame_Shift_Del | novel | c.406delN | p.Gly136ValfsTer22 | p.G136Vfs*22 | P04899 | protein_coding | TCGA-D8-A27V-01 | Breast | breast invasive carcinoma | Female | <65 | I/II | Hormone Therapy | tamoxiphen | SD | ||
| GNAI2 | SNV | Missense_Mutation | rs781807470 | c.475N>A | p.Asp159Asn | p.D159N | P04899 | protein_coding | tolerated(0.19) | benign(0.003) | TCGA-C5-A1ME-01 | Cervix | cervical & endocervical cancer | Female | <65 | I/II | Unknown | Unknown | SD |
| GNAI2 | SNV | Missense_Mutation | rs781986131 | c.200G>A | p.Arg67Gln | p.R67Q | P04899 | protein_coding | tolerated(0.39) | benign(0.006) | TCGA-5M-AAT6-01 | Colorectum | colon adenocarcinoma | Female | <65 | III/IV | Unknown | Unknown | PD |
| GNAI2 | SNV | Missense_Mutation | c.1055N>A | p.Cys352Tyr | p.C352Y | P04899 | protein_coding | tolerated(0.06) | possibly_damaging(0.776) | TCGA-AD-6889-01 | Colorectum | colon adenocarcinoma | Male | >=65 | I/II | Chemotherapy | xeloda | PD | |
| GNAI2 | SNV | Missense_Mutation | c.878N>A | p.Gly293Glu | p.G293E | P04899 | protein_coding | deleterious(0) | probably_damaging(0.994) | TCGA-AD-6895-01 | Colorectum | colon adenocarcinoma | Male | >=65 | III/IV | Unknown | Unknown | SD | |
| GNAI2 | SNV | Missense_Mutation | rs782786744 | c.979G>A | p.Ala327Thr | p.A327T | P04899 | protein_coding | deleterious(0) | probably_damaging(1) | TCGA-AZ-4313-01 | Colorectum | colon adenocarcinoma | Female | <65 | I/II | Unknown | Unknown | SD |
| Page: 1 2 3 4 |
Top |
Related drugs of malignant transformation related genes |
| Identification of chemicals and drugs interact with genes involved in malignant transfromation |
| (DGIdb 4.0) |
| Entrez ID | Symbol | Category | Interaction Types | Drug Claim Name | Drug Name | PMIDs |
| Page: 1 |

Copyright 2023-Present -The University of Texas Health Science Center at Houston |