
|
|||||
|
 | |
| |
| |
| |
| |
| |
|
Gene: GNAI1 |
Gene summary for GNAI1 |
| Gene information | Species | Human | Gene symbol | GNAI1 | Gene ID | 2770 |
| Gene name | G protein subunit alpha i1 | |
| Gene Alias | Gi | |
| Cytomap | 7q21.11 | |
| Gene Type | protein-coding | GO ID | GO:0000226 | UniProtAcc | P63096 |
Top |
Malignant transformation analysis |
| Identification of the aberrant gene expression in precancerous and cancerous lesions by comparing the gene expression of stem-like cells in diseased tissues with normal stem cells |
| Entrez ID | Symbol | Replicates | Species | Organ | Tissue | Adj P-value | Log2FC | Malignancy |
| 2770 | GNAI1 | CA_HPV_1 | Human | Cervix | CC | 1.24e-03 | -1.26e-01 | 0.0264 |
| 2770 | GNAI1 | CA_HPV_3 | Human | Cervix | CC | 2.37e-02 | 1.85e-01 | 0.0414 |
| 2770 | GNAI1 | CCI_1 | Human | Cervix | CC | 4.78e-04 | 7.87e-01 | 0.528 |
| 2770 | GNAI1 | CCI_3 | Human | Cervix | CC | 7.00e-05 | 6.01e-01 | 0.516 |
| 2770 | GNAI1 | sample3 | Human | Cervix | CC | 2.03e-05 | 2.87e-01 | 0.1387 |
| 2770 | GNAI1 | T3 | Human | Cervix | CC | 2.19e-08 | 3.26e-01 | 0.1389 |
| 2770 | GNAI1 | LZE2T | Human | Esophagus | ESCC | 3.91e-03 | 2.41e-01 | 0.082 |
| 2770 | GNAI1 | LZE4T | Human | Esophagus | ESCC | 1.06e-11 | 2.98e-01 | 0.0811 |
| 2770 | GNAI1 | LZE8T | Human | Esophagus | ESCC | 6.50e-08 | 2.19e-01 | 0.067 |
| 2770 | GNAI1 | LZE20T | Human | Esophagus | ESCC | 3.29e-04 | 1.84e-01 | 0.0662 |
| 2770 | GNAI1 | LZE22D1 | Human | Esophagus | HGIN | 4.44e-02 | -2.37e-02 | 0.0595 |
| 2770 | GNAI1 | LZE6T | Human | Esophagus | ESCC | 3.76e-04 | 2.64e-02 | 0.0845 |
| 2770 | GNAI1 | P2T-E | Human | Esophagus | ESCC | 2.40e-16 | 2.08e-01 | 0.1177 |
| 2770 | GNAI1 | P4T-E | Human | Esophagus | ESCC | 1.39e-05 | 2.30e-01 | 0.1323 |
| 2770 | GNAI1 | P5T-E | Human | Esophagus | ESCC | 3.07e-12 | 2.58e-01 | 0.1327 |
| 2770 | GNAI1 | P8T-E | Human | Esophagus | ESCC | 1.39e-11 | 2.02e-01 | 0.0889 |
| 2770 | GNAI1 | P9T-E | Human | Esophagus | ESCC | 3.49e-05 | 1.77e-01 | 0.1131 |
| 2770 | GNAI1 | P10T-E | Human | Esophagus | ESCC | 5.90e-24 | 1.73e-01 | 0.116 |
| 2770 | GNAI1 | P11T-E | Human | Esophagus | ESCC | 2.41e-11 | 7.67e-01 | 0.1426 |
| 2770 | GNAI1 | P15T-E | Human | Esophagus | ESCC | 2.57e-18 | 4.66e-01 | 0.1149 |
| Page: 1 2 3 4 5 6 |
| Tissue | Expression Dynamics | Abbreviation |
| Cervix | 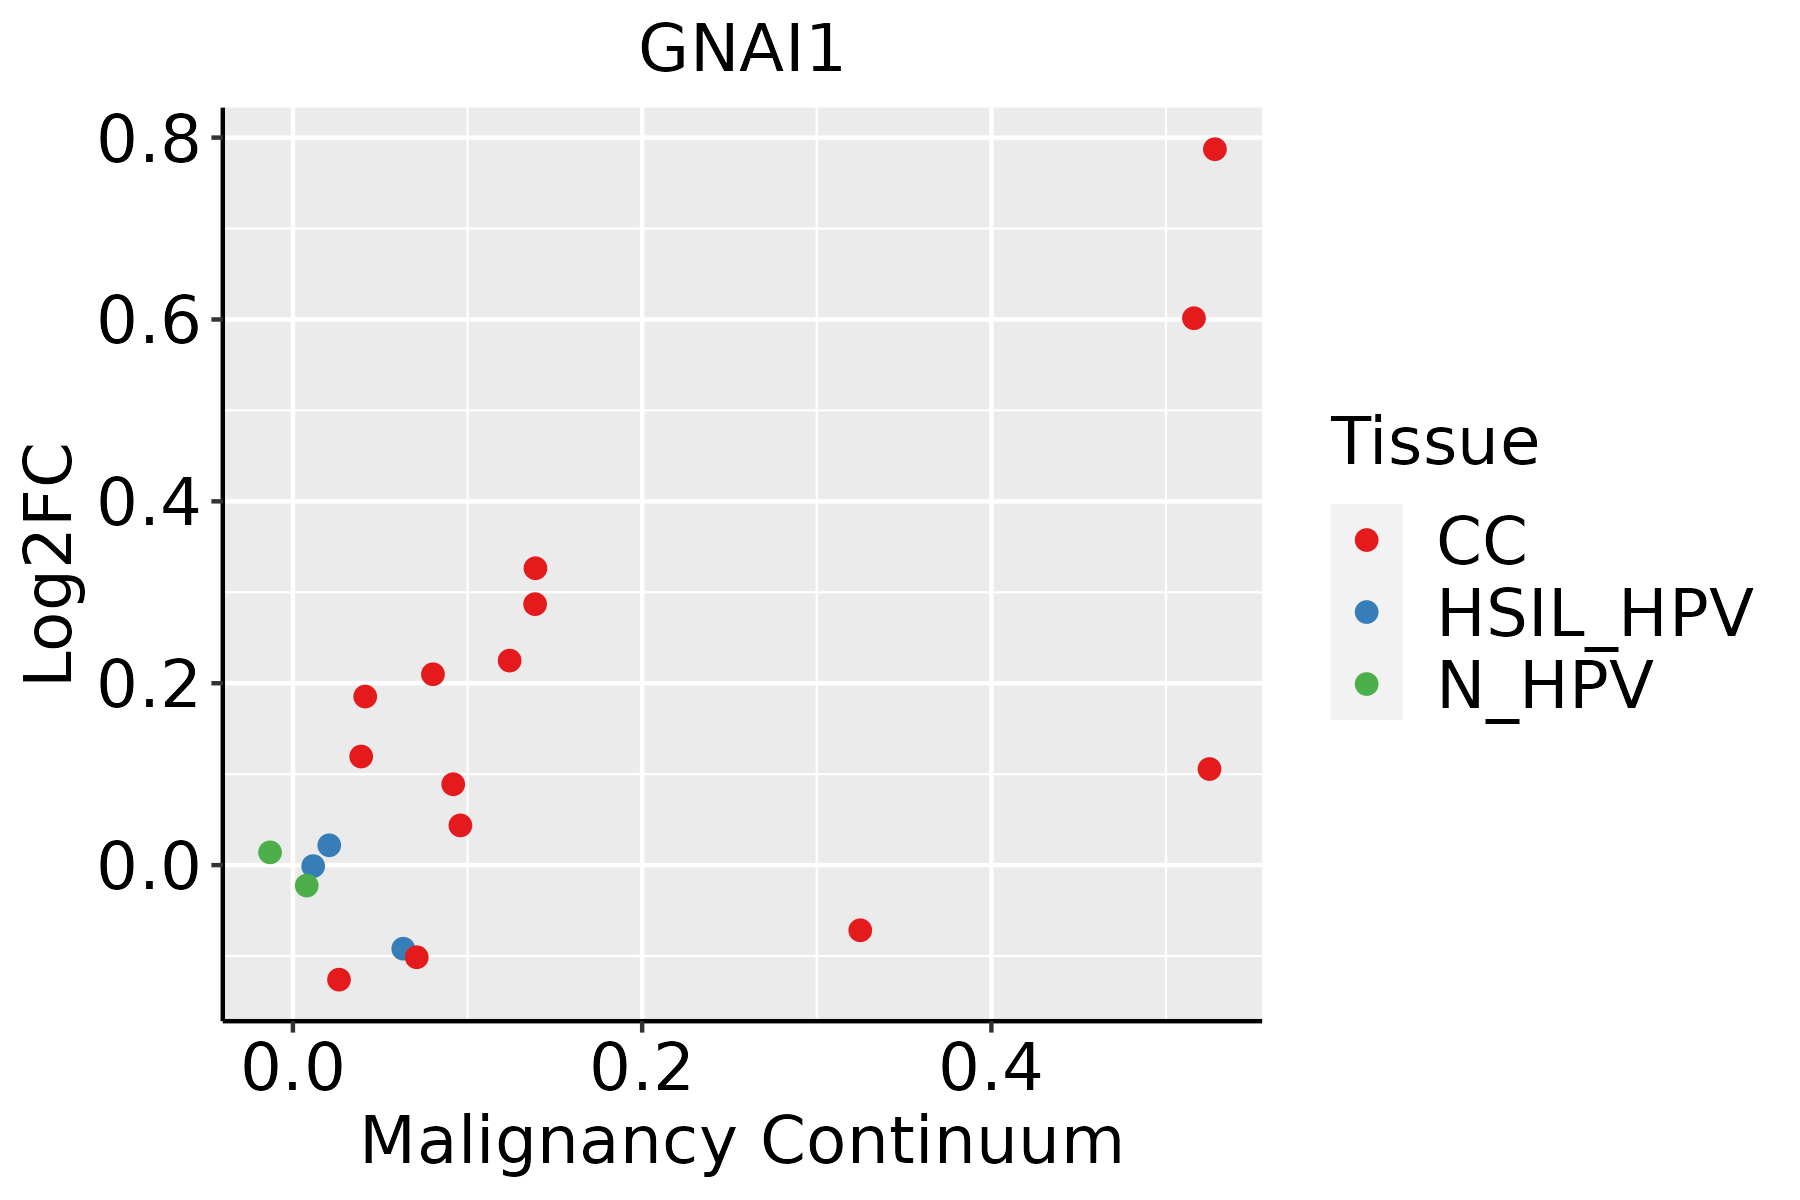 | CC: Cervix cancer |
| HSIL_HPV: HPV-infected high-grade squamous intraepithelial lesions | ||
| N_HPV: HPV-infected normal cervix | ||
| Esophagus | 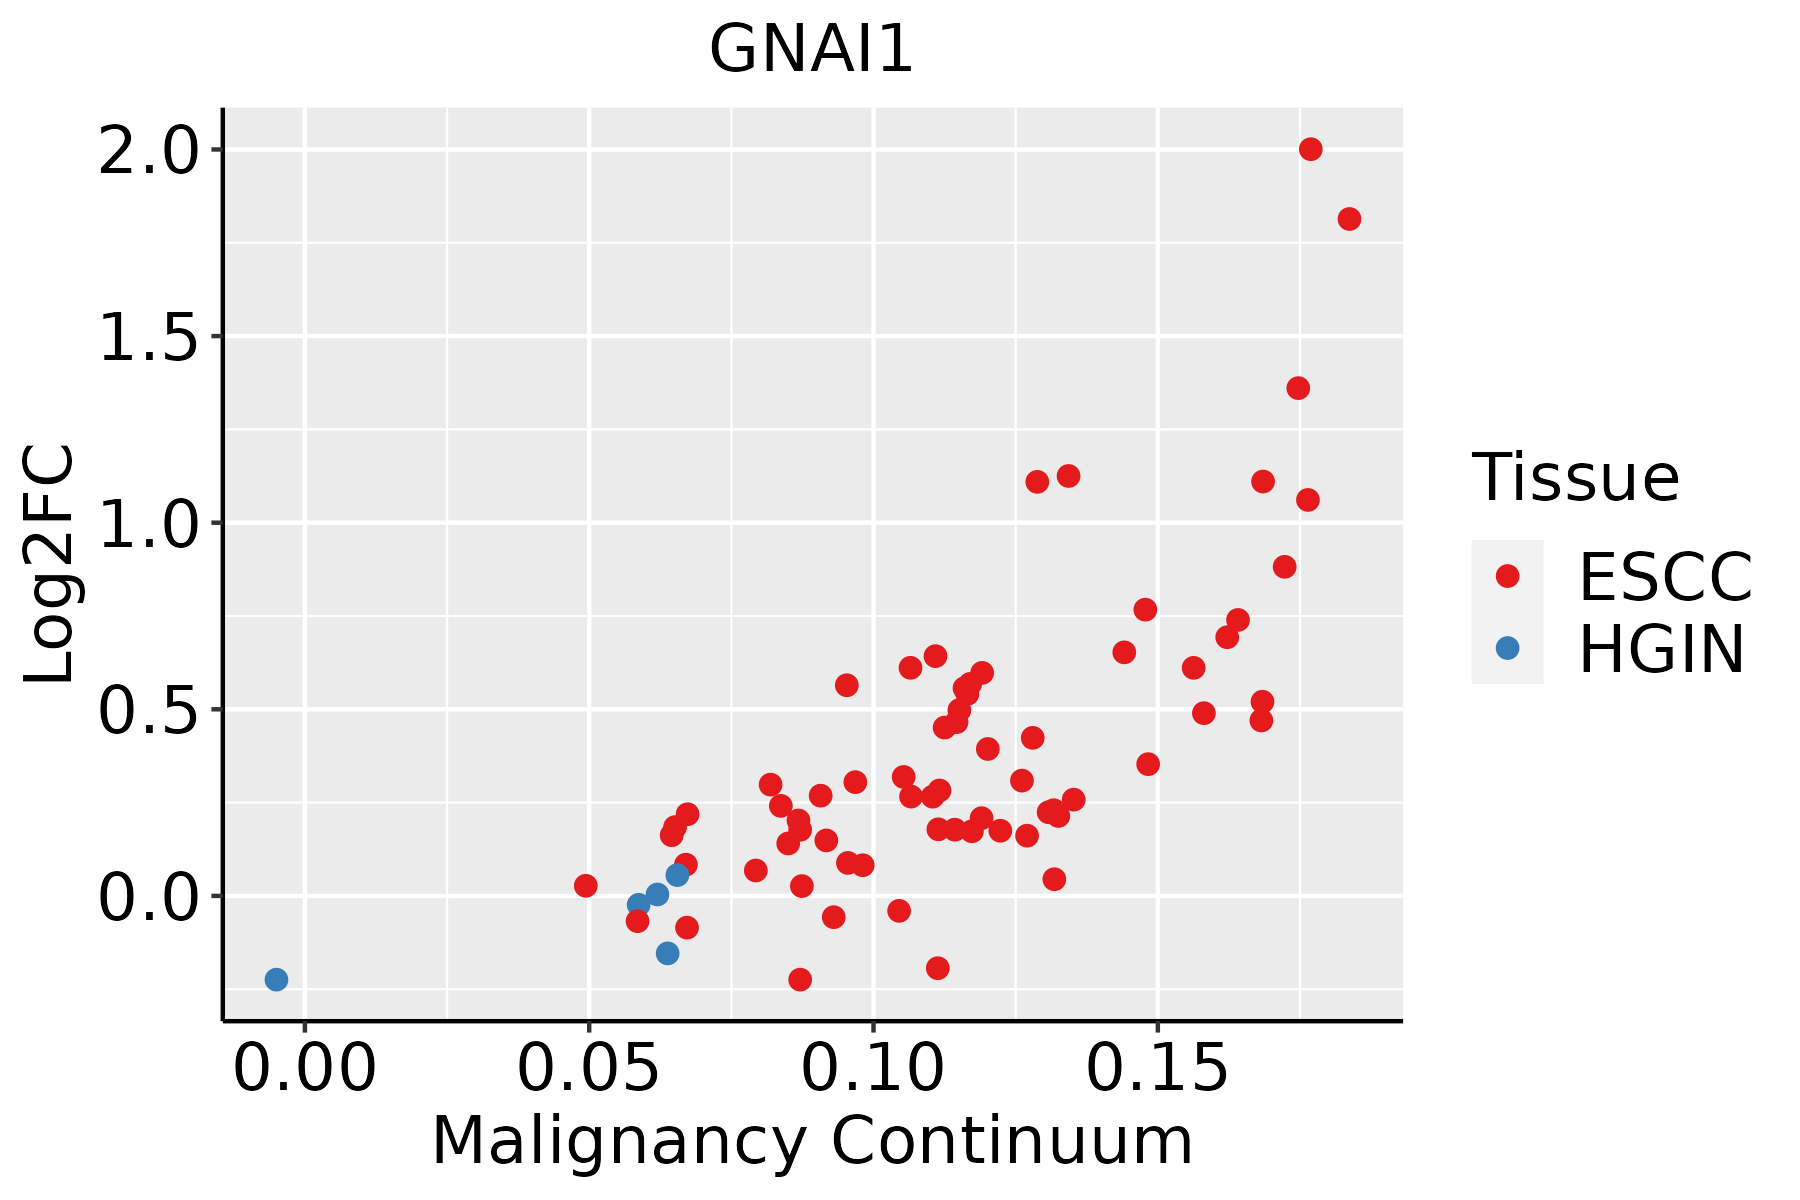 | ESCC: Esophageal squamous cell carcinoma |
| HGIN: High-grade intraepithelial neoplasias | ||
| LGIN: Low-grade intraepithelial neoplasias | ||
| Liver | 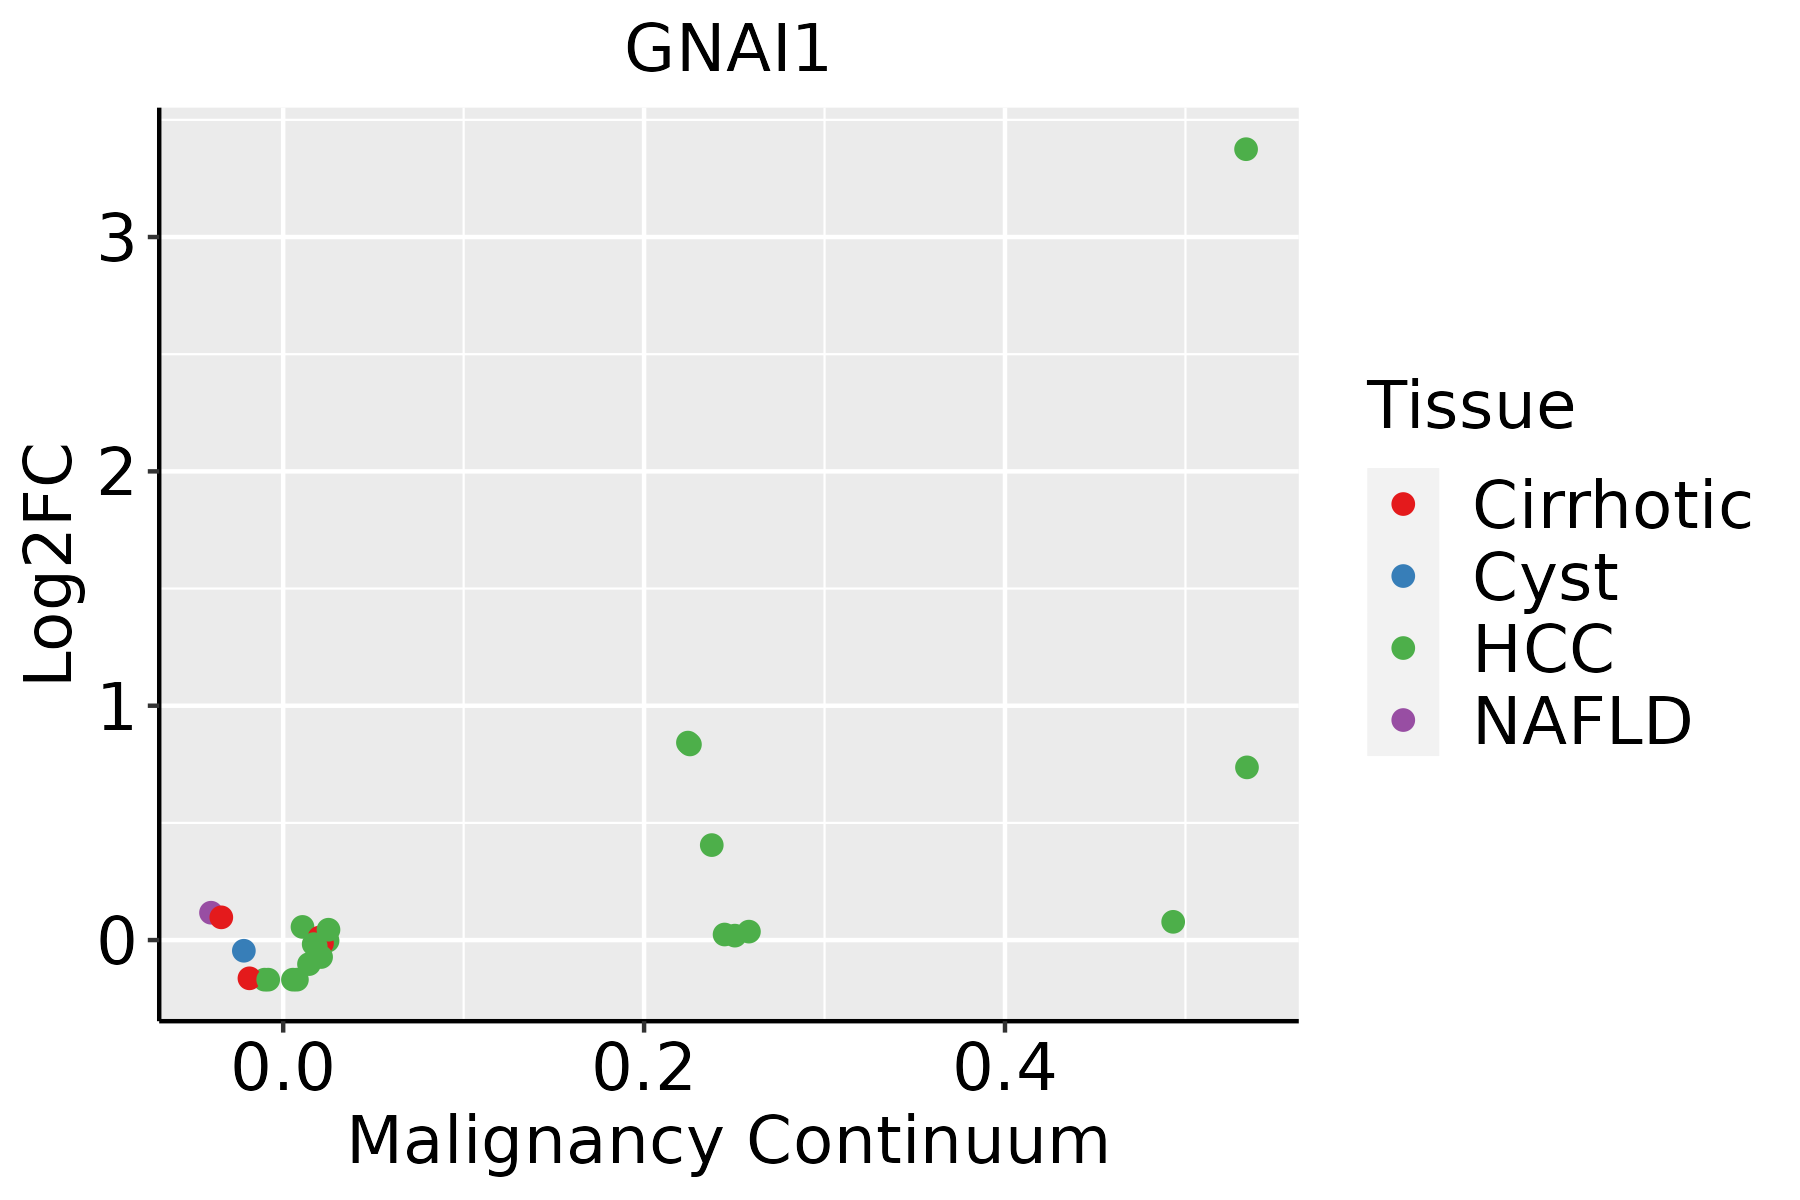 | HCC: Hepatocellular carcinoma |
| NAFLD: Non-alcoholic fatty liver disease | ||
| Oral Cavity |  | EOLP: Erosive Oral lichen planus |
| LP: leukoplakia | ||
| NEOLP: Non-erosive oral lichen planus | ||
| OSCC: Oral squamous cell carcinoma | ||
| Skin | 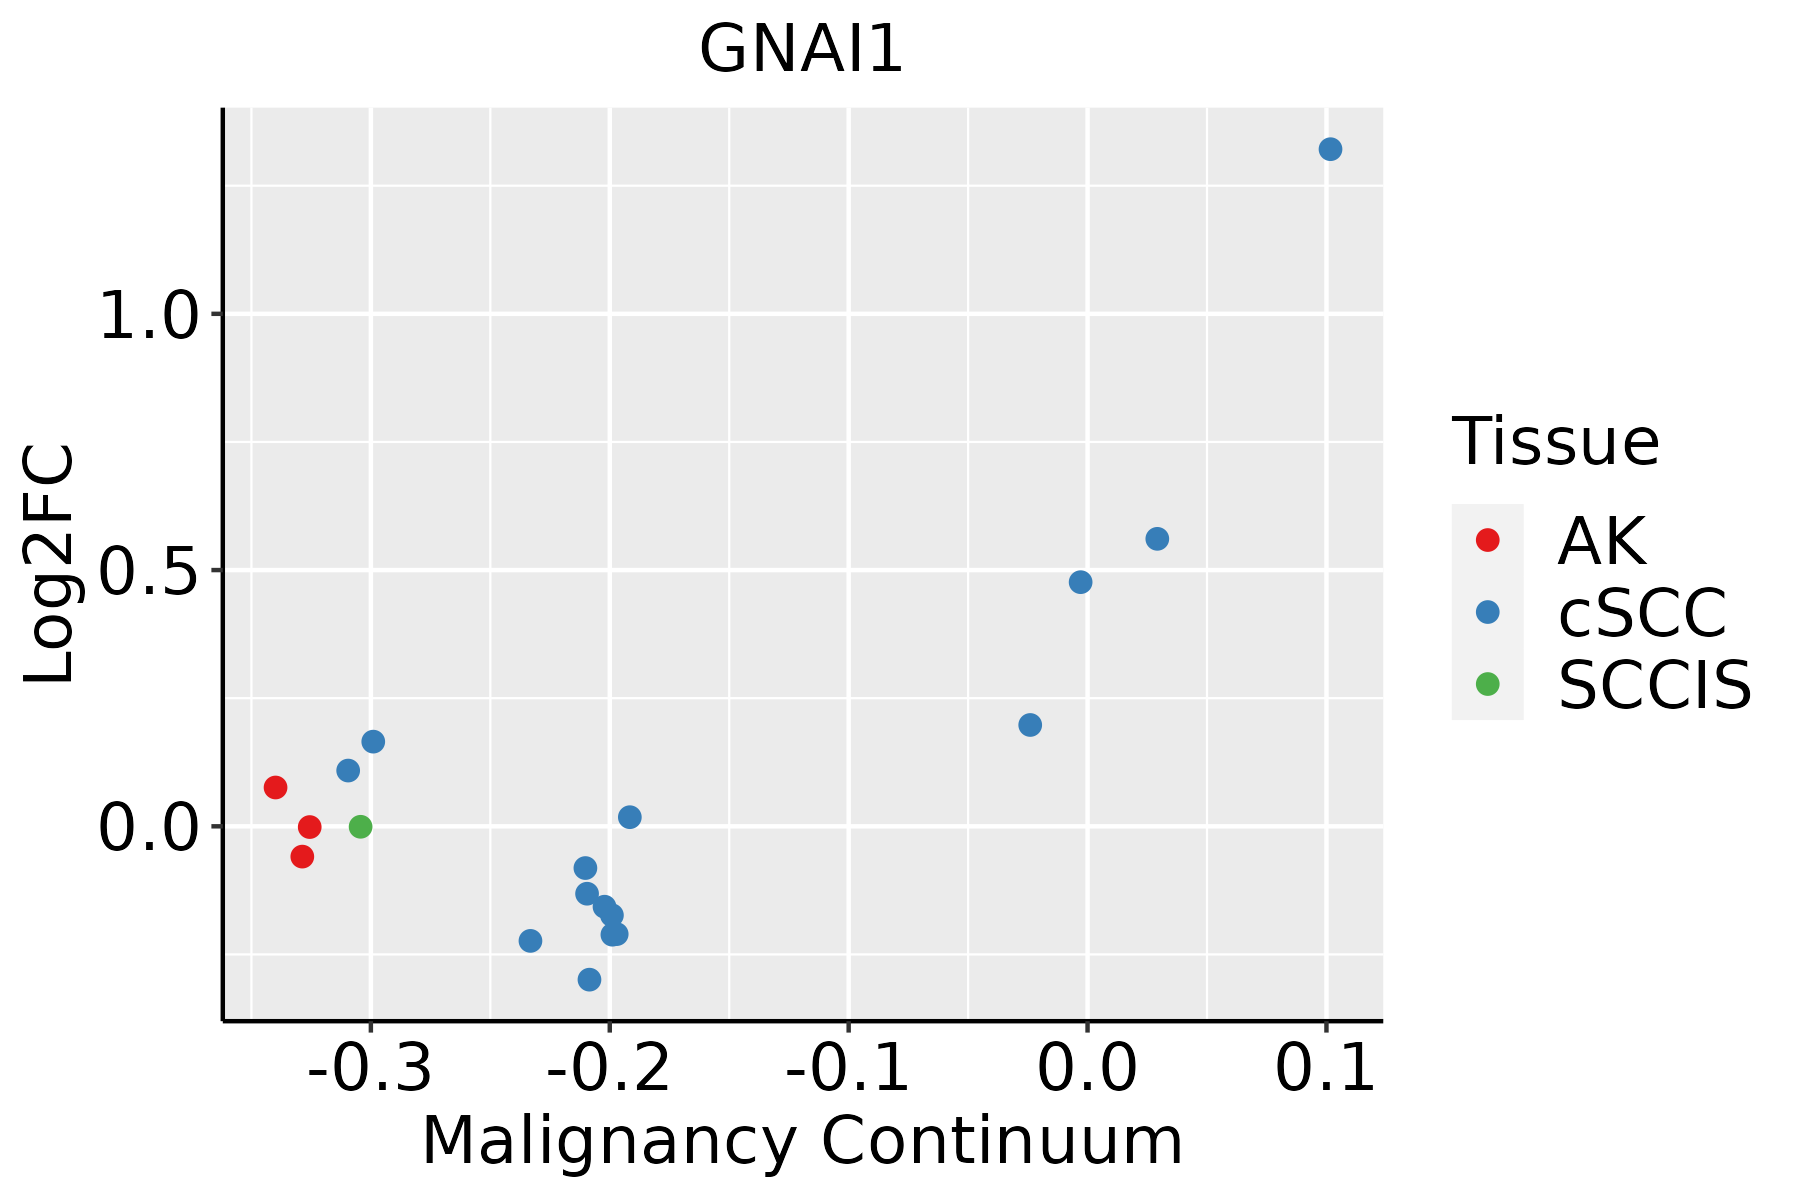 | AK: Actinic keratosis |
| cSCC: Cutaneous squamous cell carcinoma | ||
| SCCIS:squamous cell carcinoma in situ | ||
| Thyroid | 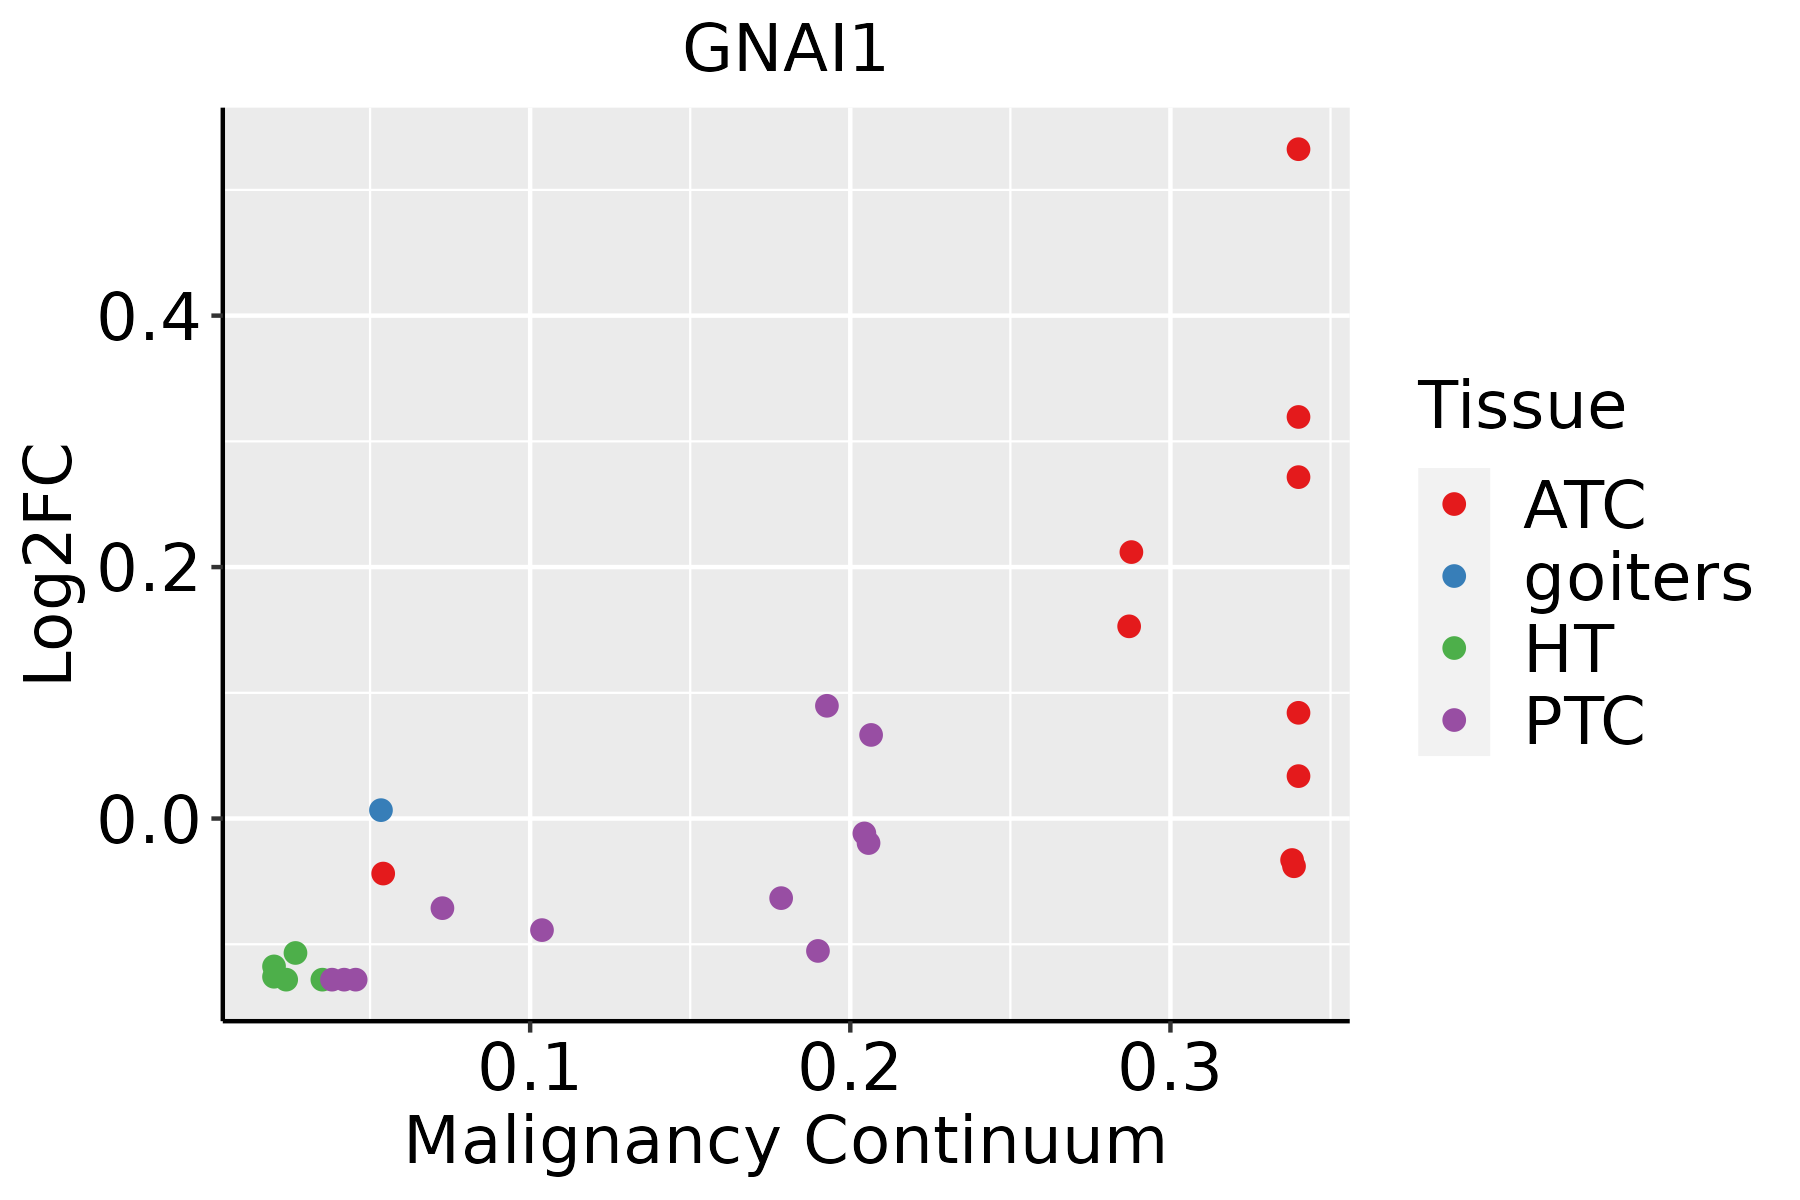 | ATC: Anaplastic thyroid cancer |
| HT: Hashimoto's thyroiditis | ||
| PTC: Papillary thyroid cancer |
| ∗log2FC in expression of this searched gene in stem-like cells from each diseased tissue sample relative to stem-like cells in normal samples in each tissue plotted against the malignancy continuum. Samples are colored based on if they are from different disease stage. |
Top |
Malignant transformation related pathway analysis |
| Find out the enriched GO biological processes and KEGG pathways involved in transition from healthy to precancer to cancer |
| Tissue | Disease Stage | Enriched GO biological Processes |
| Colorectum | AD |  |
| Colorectum | SER |  |
| Colorectum | MSS |  |
| Colorectum | MSI-H |  |
| Colorectum | FAP |  |
| ∗Top 15 enriched GO BP terms are showed in the bar plot of each disease state in each tissue. Each row represents a significant GO biological process which is colored according to the -log10(p.adjust). |
| Page: 1 2 3 4 5 6 7 8 9 |
| GO ID | Tissue | Disease Stage | Description | Gene Ratio | Bg Ratio | pvalue | p.adjust | Count |
| GO:190382910 | Cervix | CC | positive regulation of cellular protein localization | 72/2311 | 276/18723 | 3.20e-10 | 4.46e-08 | 72 |
| GO:19907788 | Cervix | CC | protein localization to cell periphery | 78/2311 | 333/18723 | 1.22e-08 | 9.73e-07 | 78 |
| GO:19043779 | Cervix | CC | positive regulation of protein localization to cell periphery | 24/2311 | 69/18723 | 1.21e-06 | 4.15e-05 | 24 |
| GO:190165410 | Cervix | CC | response to ketone | 45/2311 | 194/18723 | 1.83e-05 | 3.44e-04 | 45 |
| GO:00434349 | Cervix | CC | response to peptide hormone | 77/2311 | 414/18723 | 1.40e-04 | 1.70e-03 | 77 |
| GO:19043758 | Cervix | CC | regulation of protein localization to cell periphery | 30/2311 | 125/18723 | 2.28e-04 | 2.56e-03 | 30 |
| GO:00705074 | Cervix | CC | regulation of microtubule cytoskeleton organization | 32/2311 | 148/18723 | 1.02e-03 | 8.51e-03 | 32 |
| GO:00973059 | Cervix | CC | response to alcohol | 46/2311 | 253/18723 | 4.40e-03 | 2.69e-02 | 46 |
| GO:190382926 | Esophagus | HGIN | positive regulation of cellular protein localization | 75/2587 | 276/18723 | 3.19e-09 | 2.30e-07 | 75 |
| GO:190165420 | Esophagus | HGIN | response to ketone | 48/2587 | 194/18723 | 3.17e-05 | 8.12e-04 | 48 |
| GO:199077818 | Esophagus | HGIN | protein localization to cell periphery | 71/2587 | 333/18723 | 1.05e-04 | 2.24e-03 | 71 |
| GO:190437518 | Esophagus | HGIN | regulation of protein localization to cell periphery | 32/2587 | 125/18723 | 3.23e-04 | 5.39e-03 | 32 |
| GO:00070527 | Esophagus | HGIN | mitotic spindle organization | 31/2587 | 120/18723 | 3.35e-04 | 5.50e-03 | 31 |
| GO:19028507 | Esophagus | HGIN | microtubule cytoskeleton organization involved in mitosis | 36/2587 | 147/18723 | 3.61e-04 | 5.68e-03 | 36 |
| GO:00070518 | Esophagus | HGIN | spindle organization | 42/2587 | 184/18723 | 6.07e-04 | 8.49e-03 | 42 |
| GO:009730520 | Esophagus | HGIN | response to alcohol | 54/2587 | 253/18723 | 6.46e-04 | 8.87e-03 | 54 |
| GO:004343420 | Esophagus | HGIN | response to peptide hormone | 79/2587 | 414/18723 | 1.60e-03 | 1.79e-02 | 79 |
| GO:190437718 | Esophagus | HGIN | positive regulation of protein localization to cell periphery | 18/2587 | 69/18723 | 4.94e-03 | 4.18e-02 | 18 |
| GO:00902245 | Esophagus | HGIN | regulation of spindle organization | 12/2587 | 39/18723 | 4.97e-03 | 4.18e-02 | 12 |
| GO:00602365 | Esophagus | HGIN | regulation of mitotic spindle organization | 11/2587 | 35/18723 | 5.89e-03 | 4.78e-02 | 11 |
| Page: 1 2 3 4 5 6 7 8 |
| Pathway ID | Tissue | Disease Stage | Description | Gene Ratio | Bg Ratio | pvalue | p.adjust | qvalue | Count |
| hsa0501220 | Cervix | CC | Parkinson disease | 102/1267 | 266/8465 | 1.81e-21 | 1.47e-19 | 8.66e-20 | 102 |
| hsa0516318 | Cervix | CC | Human cytomegalovirus infection | 65/1267 | 225/8465 | 4.59e-08 | 6.47e-07 | 3.83e-07 | 65 |
| hsa0491520 | Cervix | CC | Estrogen signaling pathway | 44/1267 | 138/8465 | 3.55e-07 | 3.97e-06 | 2.35e-06 | 44 |
| hsa0467020 | Cervix | CC | Leukocyte transendothelial migration | 36/1267 | 114/8465 | 5.22e-06 | 4.83e-05 | 2.86e-05 | 36 |
| hsa0401512 | Cervix | CC | Rap1 signaling pathway | 56/1267 | 210/8465 | 6.23e-06 | 5.61e-05 | 3.32e-05 | 56 |
| hsa0517016 | Cervix | CC | Human immunodeficiency virus 1 infection | 55/1267 | 212/8465 | 1.80e-05 | 1.42e-04 | 8.40e-05 | 55 |
| hsa0514514 | Cervix | CC | Toxoplasmosis | 34/1267 | 112/8465 | 2.42e-05 | 1.82e-04 | 1.08e-04 | 34 |
| hsa0407110 | Cervix | CC | Sphingolipid signaling pathway | 35/1267 | 121/8465 | 5.70e-05 | 3.93e-04 | 2.32e-04 | 35 |
| hsa043609 | Cervix | CC | Axon guidance | 47/1267 | 182/8465 | 8.13e-05 | 5.38e-04 | 3.18e-04 | 47 |
| hsa051337 | Cervix | CC | Pertussis | 21/1267 | 76/8465 | 3.08e-03 | 1.19e-02 | 7.03e-03 | 21 |
| hsa0492812 | Cervix | CC | Parathyroid hormone synthesis, secretion and action | 27/1267 | 106/8465 | 3.12e-03 | 1.19e-02 | 7.03e-03 | 27 |
| hsa04062 | Cervix | CC | Chemokine signaling pathway | 43/1267 | 192/8465 | 3.60e-03 | 1.34e-02 | 7.91e-03 | 43 |
| hsa0497116 | Cervix | CC | Gastric acid secretion | 20/1267 | 76/8465 | 6.93e-03 | 2.27e-02 | 1.34e-02 | 20 |
| hsa049265 | Cervix | CC | Relaxin signaling pathway | 30/1267 | 129/8465 | 7.92e-03 | 2.56e-02 | 1.51e-02 | 30 |
| hsa04540 | Cervix | CC | Gap junction | 22/1267 | 88/8465 | 9.07e-03 | 2.85e-02 | 1.69e-02 | 22 |
| hsa049218 | Cervix | CC | Oxytocin signaling pathway | 34/1267 | 154/8465 | 1.12e-02 | 3.42e-02 | 2.02e-02 | 34 |
| hsa046115 | Cervix | CC | Platelet activation | 28/1267 | 124/8465 | 1.50e-02 | 4.45e-02 | 2.63e-02 | 28 |
| hsa05012110 | Cervix | CC | Parkinson disease | 102/1267 | 266/8465 | 1.81e-21 | 1.47e-19 | 8.66e-20 | 102 |
| hsa0516319 | Cervix | CC | Human cytomegalovirus infection | 65/1267 | 225/8465 | 4.59e-08 | 6.47e-07 | 3.83e-07 | 65 |
| hsa04915110 | Cervix | CC | Estrogen signaling pathway | 44/1267 | 138/8465 | 3.55e-07 | 3.97e-06 | 2.35e-06 | 44 |
| Page: 1 2 3 4 5 6 7 |
Top |
Cell-cell communication analysis |
| Identification of potential cell-cell interactions between two cell types and their ligand-receptor pairs for different disease states |
| Ligand | Receptor | LRpair | Pathway | Tissue | Disease Stage |
| Page: 1 |
Top |
Single-cell gene regulatory network inference analysis |
| Find out the significant the regulons (TFs) and the target genes of each regulon across cell types for different disease states |
| TF | Cell Type | Tissue | Disease Stage | Target Gene | RSS | Regulon Activity |
| ∗The dot plots of a searched regulon are shown for all cell subpopulations in each disease state of each tissue based on the regulon specific score inferred using pySCENIC and by calculating the average expression. |
| Page: 1 |
Top |
Somatic mutation of malignant transformation related genes |
| Annotation of somatic variants for genes involved in malignant transformation |
| Hugo Symbol | Variant Class | Variant Classification | dbSNP RS | HGVSc | HGVSp | HGVSp Short | SWISSPROT | BIOTYPE | SIFT | PolyPhen | Tumor Sample Barcode | Tissue | Histology | Sex | Age | Stage | Therapy Types | Drugs | Outcome |
| GNAI1 | SNV | Missense_Mutation | rs142908338 | c.313C>T | p.Arg105Cys | p.R105C | P63096 | protein_coding | deleterious(0) | possibly_damaging(0.835) | TCGA-A2-A0CL-01 | Breast | breast invasive carcinoma | Female | <65 | III/IV | Chemotherapy | cytoxan | SD |
| GNAI1 | SNV | Missense_Mutation | novel | c.1051T>G | p.Cys351Gly | p.C351G | P63096 | protein_coding | deleterious(0.01) | possibly_damaging(0.468) | TCGA-AN-A046-01 | Breast | breast invasive carcinoma | Female | >=65 | I/II | Unknown | Unknown | SD |
| GNAI1 | deletion | Frame_Shift_Del | novel | c.908delN | p.Gln304AsnfsTer36 | p.Q304Nfs*36 | P63096 | protein_coding | TCGA-EW-A2FV-01 | Breast | breast invasive carcinoma | Female | <65 | III/IV | Chemotherapy | docetaxel | SD | ||
| GNAI1 | SNV | Missense_Mutation | c.601N>A | p.Val201Met | p.V201M | P63096 | protein_coding | deleterious(0.01) | probably_damaging(0.975) | TCGA-EK-A2RC-01 | Cervix | cervical & endocervical cancer | Female | <65 | I/II | Unknown | Unknown | SD | |
| GNAI1 | SNV | Missense_Mutation | novel | c.190N>A | p.Glu64Lys | p.E64K | P63096 | protein_coding | deleterious(0.03) | benign(0.116) | TCGA-VS-AA62-01 | Cervix | cervical & endocervical cancer | Female | <65 | I/II | Chemotherapy | cisplatin | PD |
| GNAI1 | SNV | Missense_Mutation | novel | c.752N>G | p.Asp251Gly | p.D251G | P63096 | protein_coding | deleterious(0.01) | probably_damaging(0.932) | TCGA-ZJ-AB0I-01 | Cervix | cervical & endocervical cancer | Female | <65 | I/II | Unknown | Unknown | SD |
| GNAI1 | SNV | Missense_Mutation | rs758691743 | c.314N>A | p.Arg105His | p.R105H | P63096 | protein_coding | tolerated(0.07) | possibly_damaging(0.621) | TCGA-AA-3715-01 | Colorectum | colon adenocarcinoma | Male | >=65 | I/II | Unknown | Unknown | PD |
| GNAI1 | SNV | Missense_Mutation | c.659N>T | p.Ala220Val | p.A220V | P63096 | protein_coding | deleterious(0.01) | benign(0.191) | TCGA-AA-3811-01 | Colorectum | colon adenocarcinoma | Female | >=65 | III/IV | Unknown | Unknown | PD | |
| GNAI1 | SNV | Missense_Mutation | novel | c.658G>A | p.Ala220Thr | p.A220T | P63096 | protein_coding | tolerated(0.05) | possibly_damaging(0.886) | TCGA-AG-A002-01 | Colorectum | rectum adenocarcinoma | Male | <65 | I/II | Unknown | Unknown | SD |
| GNAI1 | insertion | Frame_Shift_Ins | novel | c.720_720+1insA | p.Asn241LysfsTer5 | p.N241Kfs*5 | P63096 | protein_coding | TCGA-AM-5820-01 | Colorectum | colon adenocarcinoma | Female | <65 | I/II | Unknown | Unknown | SD |
| Page: 1 2 3 4 5 |
Top |
Related drugs of malignant transformation related genes |
| Identification of chemicals and drugs interact with genes involved in malignant transfromation |
| (DGIdb 4.0) |
| Entrez ID | Symbol | Category | Interaction Types | Drug Claim Name | Drug Name | PMIDs |
| Page: 1 |

Copyright 2023-Present -The University of Texas Health Science Center at Houston |