
|
|||||
|
 | |
| |
| |
| |
| |
| |
|
Gene: GNA13 |
Gene summary for GNA13 |
| Gene information | Species | Human | Gene symbol | GNA13 | Gene ID | 10672 |
| Gene name | G protein subunit alpha 13 | |
| Gene Alias | G13 | |
| Cytomap | 17q24.1 | |
| Gene Type | protein-coding | GO ID | GO:0006873 | UniProtAcc | Q14344 |
Top |
Malignant transformation analysis |
| Identification of the aberrant gene expression in precancerous and cancerous lesions by comparing the gene expression of stem-like cells in diseased tissues with normal stem cells |
| Entrez ID | Symbol | Replicates | Species | Organ | Tissue | Adj P-value | Log2FC | Malignancy |
| 10672 | GNA13 | LZE4T | Human | Esophagus | ESCC | 6.24e-19 | 5.16e-01 | 0.0811 |
| 10672 | GNA13 | LZE7T | Human | Esophagus | ESCC | 7.26e-08 | 2.18e-01 | 0.0667 |
| 10672 | GNA13 | LZE20T | Human | Esophagus | ESCC | 1.16e-02 | 1.05e-02 | 0.0662 |
| 10672 | GNA13 | LZE24T | Human | Esophagus | ESCC | 3.73e-13 | 3.96e-01 | 0.0596 |
| 10672 | GNA13 | P1T-E | Human | Esophagus | ESCC | 5.89e-03 | 5.74e-02 | 0.0875 |
| 10672 | GNA13 | P2T-E | Human | Esophagus | ESCC | 8.01e-17 | 5.10e-02 | 0.1177 |
| 10672 | GNA13 | P4T-E | Human | Esophagus | ESCC | 4.38e-11 | 8.30e-02 | 0.1323 |
| 10672 | GNA13 | P5T-E | Human | Esophagus | ESCC | 8.07e-06 | 6.30e-02 | 0.1327 |
| 10672 | GNA13 | P8T-E | Human | Esophagus | ESCC | 1.70e-20 | 2.58e-01 | 0.0889 |
| 10672 | GNA13 | P9T-E | Human | Esophagus | ESCC | 5.10e-10 | 2.87e-01 | 0.1131 |
| 10672 | GNA13 | P10T-E | Human | Esophagus | ESCC | 4.52e-19 | 1.79e-01 | 0.116 |
| 10672 | GNA13 | P12T-E | Human | Esophagus | ESCC | 4.44e-13 | 2.35e-01 | 0.1122 |
| 10672 | GNA13 | P15T-E | Human | Esophagus | ESCC | 1.08e-17 | 3.61e-01 | 0.1149 |
| 10672 | GNA13 | P16T-E | Human | Esophagus | ESCC | 7.52e-07 | -5.12e-02 | 0.1153 |
| 10672 | GNA13 | P20T-E | Human | Esophagus | ESCC | 7.51e-04 | 4.94e-02 | 0.1124 |
| 10672 | GNA13 | P21T-E | Human | Esophagus | ESCC | 4.36e-13 | 9.81e-02 | 0.1617 |
| 10672 | GNA13 | P22T-E | Human | Esophagus | ESCC | 9.90e-11 | 3.00e-01 | 0.1236 |
| 10672 | GNA13 | P23T-E | Human | Esophagus | ESCC | 1.02e-22 | 4.55e-01 | 0.108 |
| 10672 | GNA13 | P24T-E | Human | Esophagus | ESCC | 3.92e-02 | 7.10e-02 | 0.1287 |
| 10672 | GNA13 | P26T-E | Human | Esophagus | ESCC | 3.20e-16 | 2.57e-01 | 0.1276 |
| Page: 1 2 3 4 5 |
| Tissue | Expression Dynamics | Abbreviation |
| Esophagus |  | ESCC: Esophageal squamous cell carcinoma |
| HGIN: High-grade intraepithelial neoplasias | ||
| LGIN: Low-grade intraepithelial neoplasias | ||
| Liver | 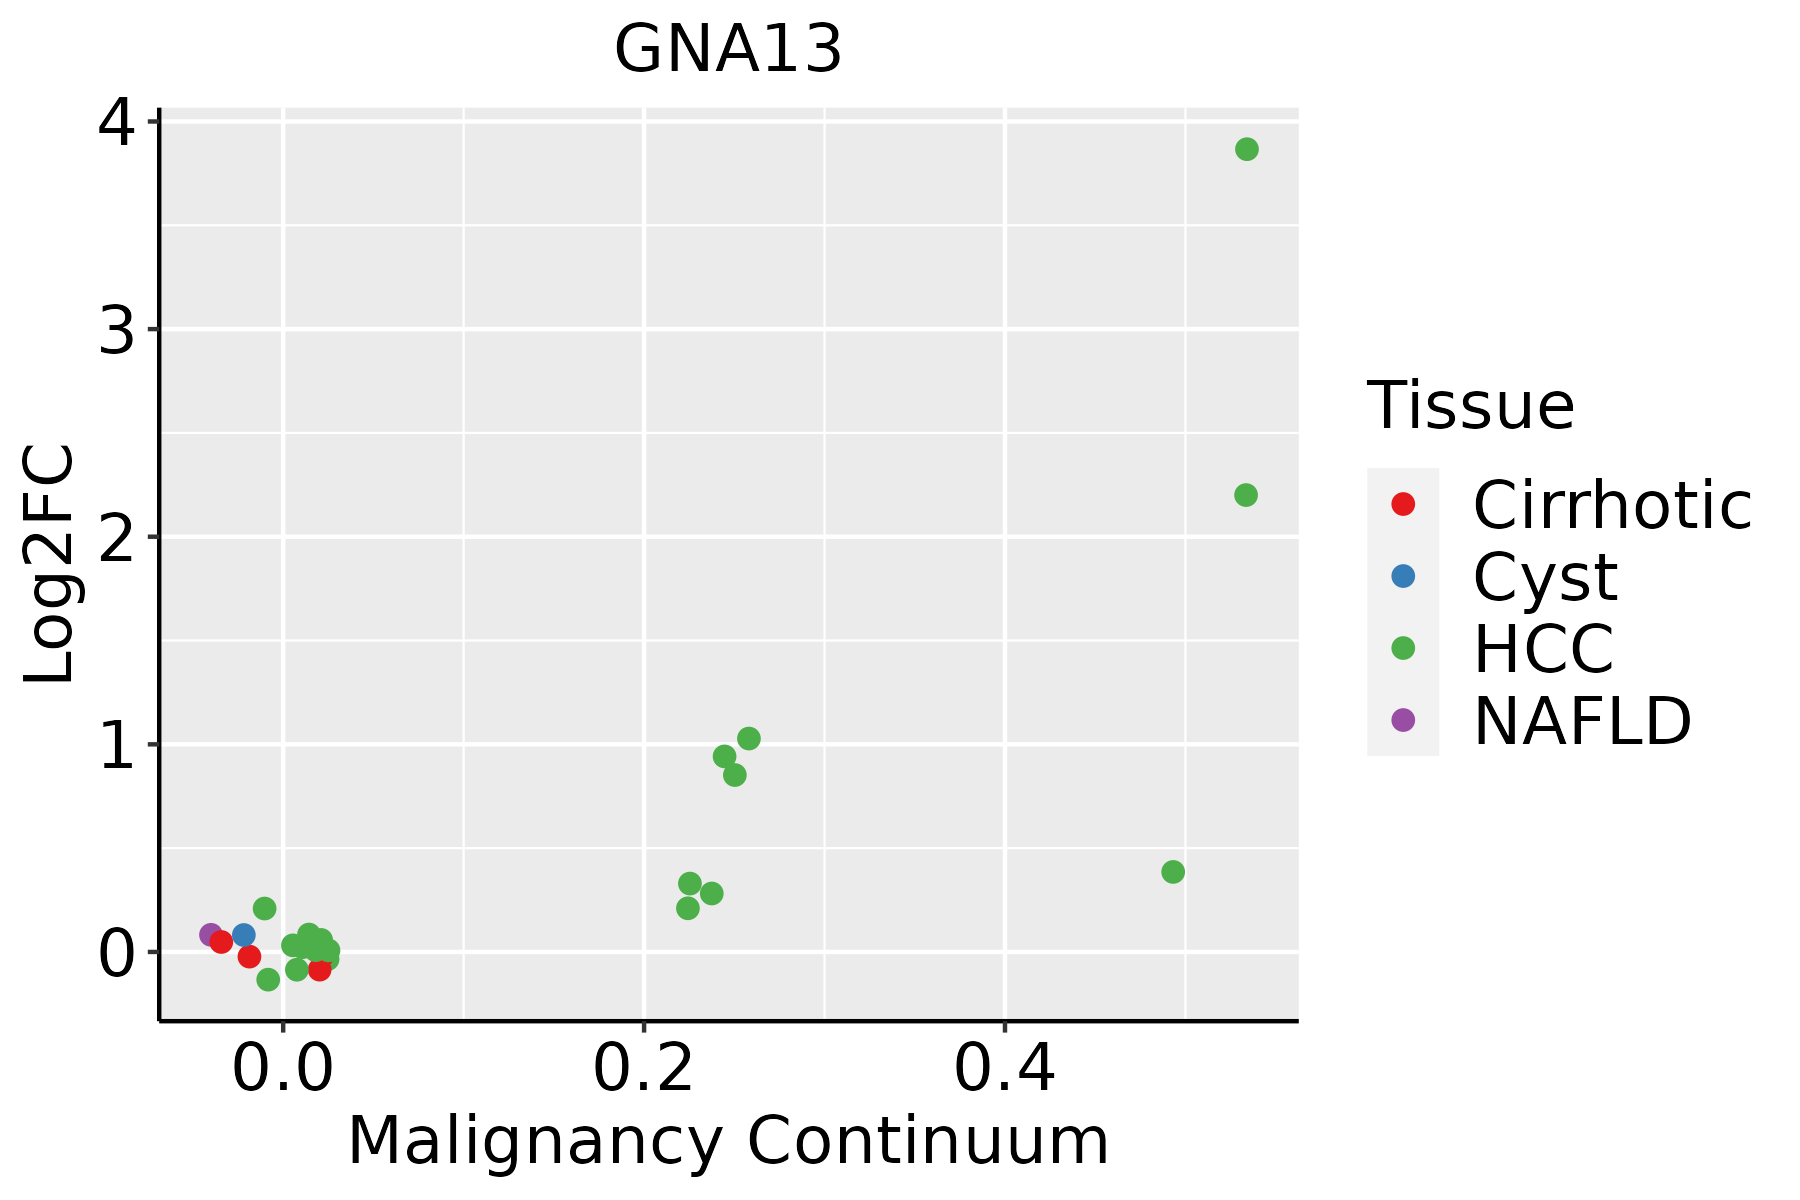 | HCC: Hepatocellular carcinoma |
| NAFLD: Non-alcoholic fatty liver disease | ||
| Oral Cavity | 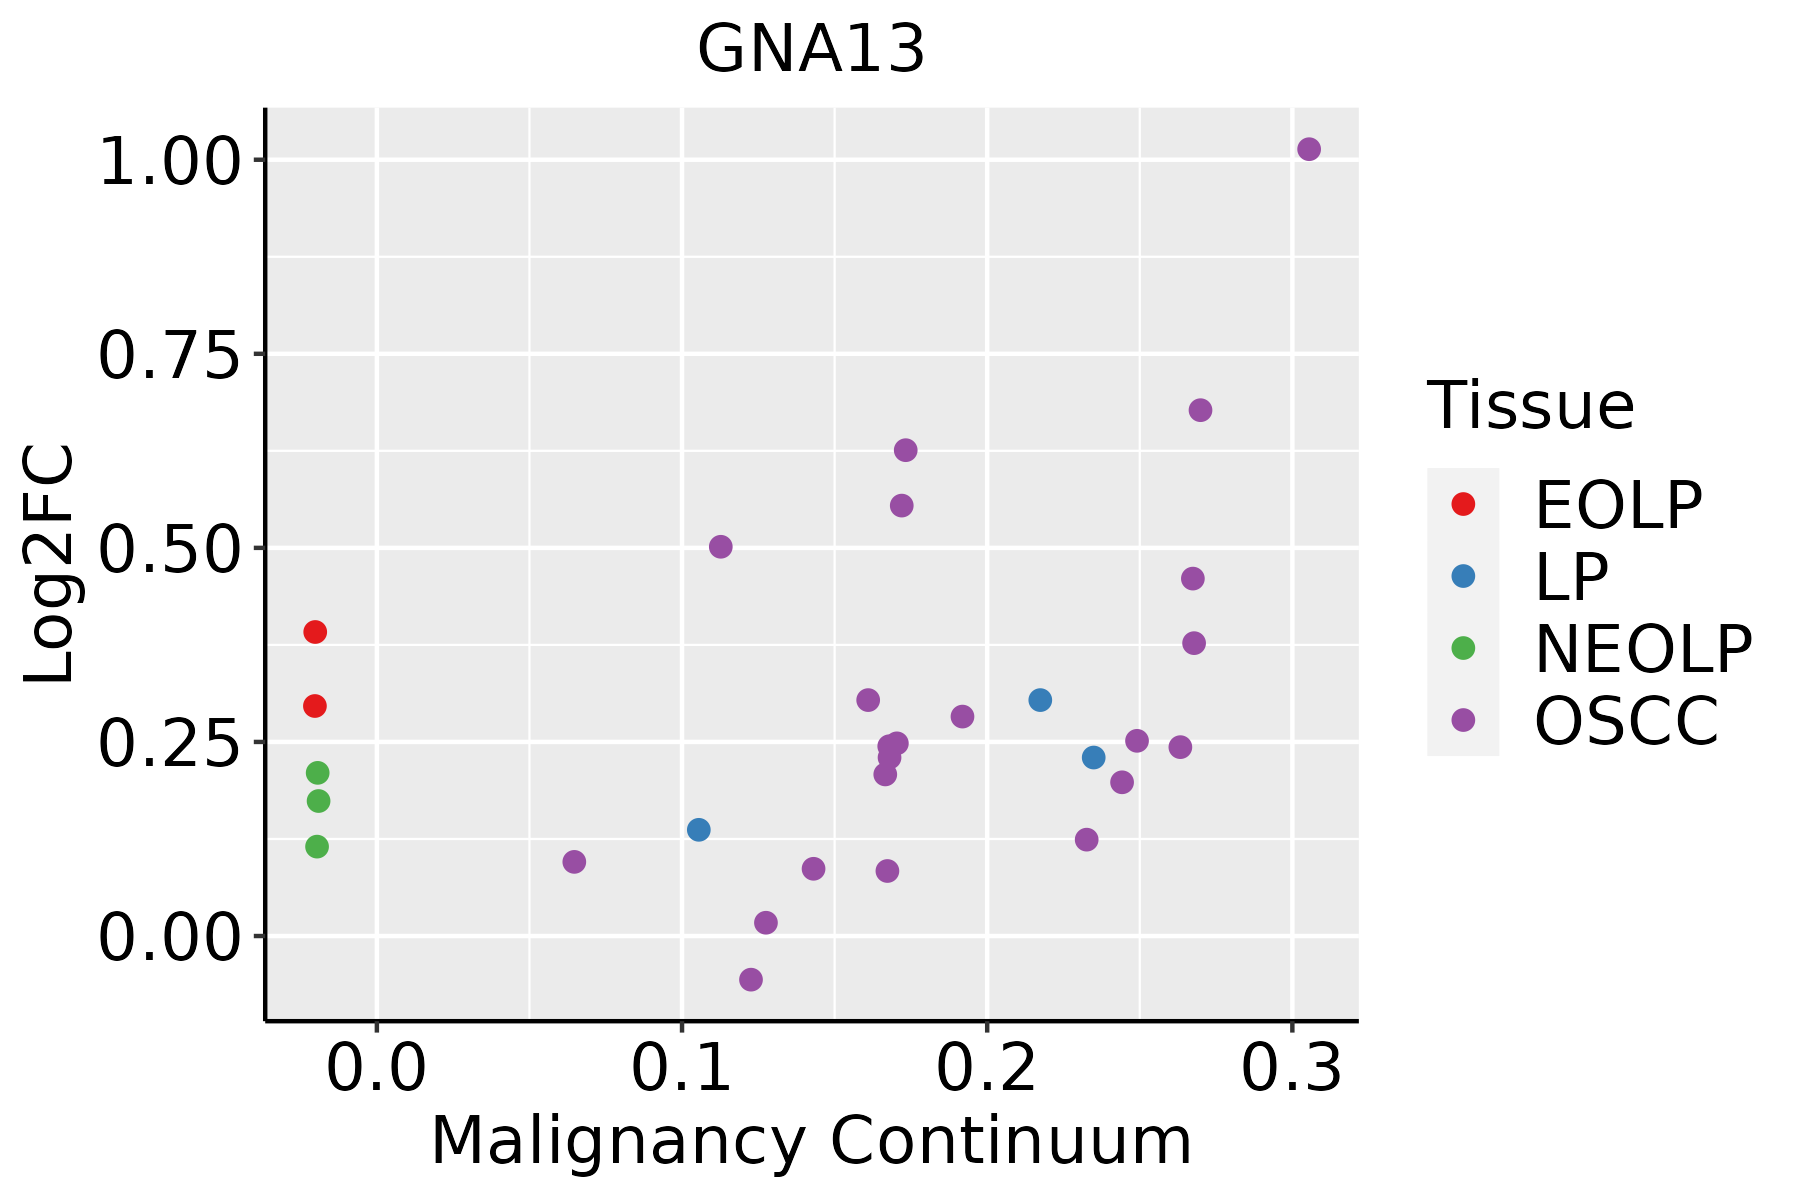 | EOLP: Erosive Oral lichen planus |
| LP: leukoplakia | ||
| NEOLP: Non-erosive oral lichen planus | ||
| OSCC: Oral squamous cell carcinoma |
| ∗log2FC in expression of this searched gene in stem-like cells from each diseased tissue sample relative to stem-like cells in normal samples in each tissue plotted against the malignancy continuum. Samples are colored based on if they are from different disease stage. |
Top |
Malignant transformation related pathway analysis |
| Find out the enriched GO biological processes and KEGG pathways involved in transition from healthy to precancer to cancer |
| Tissue | Disease Stage | Enriched GO biological Processes |
| Colorectum | AD |  |
| Colorectum | SER |  |
| Colorectum | MSS |  |
| Colorectum | MSI-H |  |
| Colorectum | FAP |  |
| ∗Top 15 enriched GO BP terms are showed in the bar plot of each disease state in each tissue. Each row represents a significant GO biological process which is colored according to the -log10(p.adjust). |
| Page: 1 2 3 4 5 6 7 8 9 |
| GO ID | Tissue | Disease Stage | Description | Gene Ratio | Bg Ratio | pvalue | p.adjust | Count |
| GO:000726510 | Esophagus | ESCC | Ras protein signal transduction | 201/8552 | 337/18723 | 1.44e-07 | 2.30e-06 | 201 |
| GO:000726610 | Esophagus | ESCC | Rho protein signal transduction | 81/8552 | 137/18723 | 1.03e-03 | 5.20e-03 | 81 |
| GO:00486597 | Esophagus | ESCC | smooth muscle cell proliferation | 103/8552 | 184/18723 | 3.08e-03 | 1.28e-02 | 103 |
| GO:00486607 | Esophagus | ESCC | regulation of smooth muscle cell proliferation | 100/8552 | 180/18723 | 4.76e-03 | 1.85e-02 | 100 |
| GO:00330025 | Esophagus | ESCC | muscle cell proliferation | 134/8552 | 248/18723 | 4.80e-03 | 1.86e-02 | 134 |
| GO:005105610 | Esophagus | ESCC | regulation of small GTPase mediated signal transduction | 157/8552 | 302/18723 | 1.55e-02 | 4.98e-02 | 157 |
| GO:000726521 | Liver | HCC | Ras protein signal transduction | 187/7958 | 337/18723 | 8.89e-07 | 1.35e-05 | 187 |
| GO:000726621 | Liver | HCC | Rho protein signal transduction | 76/7958 | 137/18723 | 1.46e-03 | 7.75e-03 | 76 |
| GO:00072659 | Oral cavity | OSCC | Ras protein signal transduction | 185/7305 | 337/18723 | 1.95e-09 | 4.60e-08 | 185 |
| GO:00072669 | Oral cavity | OSCC | Rho protein signal transduction | 76/7305 | 137/18723 | 6.64e-05 | 5.37e-04 | 76 |
| GO:00486596 | Oral cavity | OSCC | smooth muscle cell proliferation | 89/7305 | 184/18723 | 5.95e-03 | 2.27e-02 | 89 |
| GO:00486606 | Oral cavity | OSCC | regulation of smooth muscle cell proliferation | 86/7305 | 180/18723 | 1.00e-02 | 3.49e-02 | 86 |
| GO:00330024 | Oral cavity | OSCC | muscle cell proliferation | 115/7305 | 248/18723 | 1.05e-02 | 3.58e-02 | 115 |
| GO:000726522 | Oral cavity | EOLP | Ras protein signal transduction | 74/2218 | 337/18723 | 8.76e-08 | 3.09e-06 | 74 |
| GO:003300212 | Oral cavity | EOLP | muscle cell proliferation | 56/2218 | 248/18723 | 1.25e-06 | 3.00e-05 | 56 |
| GO:004865915 | Oral cavity | EOLP | smooth muscle cell proliferation | 44/2218 | 184/18723 | 3.47e-06 | 7.48e-05 | 44 |
| GO:004866015 | Oral cavity | EOLP | regulation of smooth muscle cell proliferation | 42/2218 | 180/18723 | 1.10e-05 | 1.93e-04 | 42 |
| GO:00303366 | Oral cavity | EOLP | negative regulation of cell migration | 64/2218 | 344/18723 | 1.57e-04 | 1.67e-03 | 64 |
| GO:00512716 | Oral cavity | EOLP | negative regulation of cellular component movement | 67/2218 | 367/18723 | 1.97e-04 | 2.00e-03 | 67 |
| GO:20001466 | Oral cavity | EOLP | negative regulation of cell motility | 65/2218 | 359/18723 | 3.09e-04 | 2.89e-03 | 65 |
| Page: 1 2 3 |
| Pathway ID | Tissue | Disease Stage | Description | Gene Ratio | Bg Ratio | pvalue | p.adjust | qvalue | Count |
| hsa05130211 | Esophagus | ESCC | Pathogenic Escherichia coli infection | 142/4205 | 197/8465 | 8.21e-11 | 1.06e-09 | 5.42e-10 | 142 |
| hsa05163210 | Esophagus | ESCC | Human cytomegalovirus infection | 148/4205 | 225/8465 | 5.73e-07 | 4.00e-06 | 2.05e-06 | 148 |
| hsa0407116 | Esophagus | ESCC | Sphingolipid signaling pathway | 85/4205 | 121/8465 | 3.04e-06 | 1.73e-05 | 8.84e-06 | 85 |
| hsa0492816 | Esophagus | ESCC | Parathyroid hormone synthesis, secretion and action | 66/4205 | 106/8465 | 5.86e-03 | 1.47e-02 | 7.51e-03 | 66 |
| hsa0481028 | Esophagus | ESCC | Regulation of actin cytoskeleton | 133/4205 | 229/8465 | 5.94e-03 | 1.48e-02 | 7.56e-03 | 133 |
| hsa05130310 | Esophagus | ESCC | Pathogenic Escherichia coli infection | 142/4205 | 197/8465 | 8.21e-11 | 1.06e-09 | 5.42e-10 | 142 |
| hsa0516338 | Esophagus | ESCC | Human cytomegalovirus infection | 148/4205 | 225/8465 | 5.73e-07 | 4.00e-06 | 2.05e-06 | 148 |
| hsa0407117 | Esophagus | ESCC | Sphingolipid signaling pathway | 85/4205 | 121/8465 | 3.04e-06 | 1.73e-05 | 8.84e-06 | 85 |
| hsa0492817 | Esophagus | ESCC | Parathyroid hormone synthesis, secretion and action | 66/4205 | 106/8465 | 5.86e-03 | 1.47e-02 | 7.51e-03 | 66 |
| hsa04810112 | Esophagus | ESCC | Regulation of actin cytoskeleton | 133/4205 | 229/8465 | 5.94e-03 | 1.48e-02 | 7.56e-03 | 133 |
| hsa0513042 | Liver | HCC | Pathogenic Escherichia coli infection | 129/4020 | 197/8465 | 2.02e-07 | 2.50e-06 | 1.39e-06 | 129 |
| hsa0481041 | Liver | HCC | Regulation of actin cytoskeleton | 134/4020 | 229/8465 | 4.48e-04 | 1.94e-03 | 1.08e-03 | 134 |
| hsa0516322 | Liver | HCC | Human cytomegalovirus infection | 131/4020 | 225/8465 | 6.86e-04 | 2.77e-03 | 1.54e-03 | 131 |
| hsa040718 | Liver | HCC | Sphingolipid signaling pathway | 72/4020 | 121/8465 | 5.01e-03 | 1.47e-02 | 8.18e-03 | 72 |
| hsa046112 | Liver | HCC | Platelet activation | 71/4020 | 124/8465 | 1.77e-02 | 4.15e-02 | 2.31e-02 | 71 |
| hsa0513052 | Liver | HCC | Pathogenic Escherichia coli infection | 129/4020 | 197/8465 | 2.02e-07 | 2.50e-06 | 1.39e-06 | 129 |
| hsa0481051 | Liver | HCC | Regulation of actin cytoskeleton | 134/4020 | 229/8465 | 4.48e-04 | 1.94e-03 | 1.08e-03 | 134 |
| hsa0516332 | Liver | HCC | Human cytomegalovirus infection | 131/4020 | 225/8465 | 6.86e-04 | 2.77e-03 | 1.54e-03 | 131 |
| hsa0407111 | Liver | HCC | Sphingolipid signaling pathway | 72/4020 | 121/8465 | 5.01e-03 | 1.47e-02 | 8.18e-03 | 72 |
| hsa0461111 | Liver | HCC | Platelet activation | 71/4020 | 124/8465 | 1.77e-02 | 4.15e-02 | 2.31e-02 | 71 |
| Page: 1 2 3 |
Top |
Cell-cell communication analysis |
| Identification of potential cell-cell interactions between two cell types and their ligand-receptor pairs for different disease states |
| Ligand | Receptor | LRpair | Pathway | Tissue | Disease Stage |
| Page: 1 |
Top |
Single-cell gene regulatory network inference analysis |
| Find out the significant the regulons (TFs) and the target genes of each regulon across cell types for different disease states |
| TF | Cell Type | Tissue | Disease Stage | Target Gene | RSS | Regulon Activity |
| ∗The dot plots of a searched regulon are shown for all cell subpopulations in each disease state of each tissue based on the regulon specific score inferred using pySCENIC and by calculating the average expression. |
| Page: 1 |
Top |
Somatic mutation of malignant transformation related genes |
| Annotation of somatic variants for genes involved in malignant transformation |
| Hugo Symbol | Variant Class | Variant Classification | dbSNP RS | HGVSc | HGVSp | HGVSp Short | SWISSPROT | BIOTYPE | SIFT | PolyPhen | Tumor Sample Barcode | Tissue | Histology | Sex | Age | Stage | Therapy Types | Drugs | Outcome |
| GNA13 | SNV | Missense_Mutation | c.685G>A | p.Glu229Lys | p.E229K | Q14344 | protein_coding | deleterious(0) | possibly_damaging(0.606) | TCGA-D8-A27G-01 | Breast | breast invasive carcinoma | Female | >=65 | I/II | Unknown | Unknown | SD | |
| GNA13 | SNV | Missense_Mutation | c.1050C>G | p.Ile350Met | p.I350M | Q14344 | protein_coding | deleterious(0.02) | probably_damaging(0.994) | TCGA-C5-A1MH-01 | Cervix | cervical & endocervical cancer | Female | >=65 | III/IV | Chemotherapy | cisplatin | PD | |
| GNA13 | SNV | Missense_Mutation | c.172N>A | p.Glu58Lys | p.E58K | Q14344 | protein_coding | deleterious(0) | probably_damaging(0.995) | TCGA-C5-A2LZ-01 | Cervix | cervical & endocervical cancer | Female | >=65 | III/IV | Unknown | Unknown | PD | |
| GNA13 | SNV | Missense_Mutation | rs200032909 | c.991N>T | p.Arg331Trp | p.R331W | Q14344 | protein_coding | deleterious(0.02) | probably_damaging(0.998) | TCGA-FU-A2QG-01 | Cervix | cervical & endocervical cancer | Female | <65 | I/II | Unknown | Unknown | SD |
| GNA13 | SNV | Missense_Mutation | rs754149325 | c.628N>A | p.Asp210Asn | p.D210N | Q14344 | protein_coding | tolerated(0.31) | benign(0.001) | TCGA-AA-A00N-01 | Colorectum | colon adenocarcinoma | Male | >=65 | I/II | Unknown | Unknown | PD |
| GNA13 | SNV | Missense_Mutation | c.126N>T | p.Lys42Asn | p.K42N | Q14344 | protein_coding | deleterious(0.01) | probably_damaging(0.997) | TCGA-AA-A00N-01 | Colorectum | colon adenocarcinoma | Male | >=65 | I/II | Unknown | Unknown | PD | |
| GNA13 | SNV | Missense_Mutation | novel | c.903N>C | p.Gln301His | p.Q301H | Q14344 | protein_coding | tolerated(0.09) | benign(0.269) | TCGA-CA-6717-01 | Colorectum | colon adenocarcinoma | Male | <65 | I/II | Chemotherapy | oxaliplatin | CR |
| GNA13 | SNV | Missense_Mutation | c.22N>T | p.Arg8Trp | p.R8W | Q14344 | protein_coding | deleterious_low_confidence(0) | possibly_damaging(0.751) | TCGA-DM-A28F-01 | Colorectum | colon adenocarcinoma | Male | >=65 | III/IV | Unknown | Unknown | SD | |
| GNA13 | SNV | Missense_Mutation | novel | c.961N>T | p.Asp321Tyr | p.D321Y | Q14344 | protein_coding | deleterious(0.01) | probably_damaging(1) | TCGA-A5-A0G1-01 | Endometrium | uterine corpus endometrioid carcinoma | Female | >=65 | I/II | Unknown | Unknown | SD |
| GNA13 | SNV | Missense_Mutation | novel | c.1079N>A | p.Arg360His | p.R360H | Q14344 | protein_coding | tolerated(0.15) | probably_damaging(0.994) | TCGA-A5-A0G2-01 | Endometrium | uterine corpus endometrioid carcinoma | Female | <65 | III/IV | Unknown | Unknown | SD |
| Page: 1 2 3 4 |
Top |
Related drugs of malignant transformation related genes |
| Identification of chemicals and drugs interact with genes involved in malignant transfromation |
| (DGIdb 4.0) |
| Entrez ID | Symbol | Category | Interaction Types | Drug Claim Name | Drug Name | PMIDs |
| 10672 | GNA13 | CLINICALLY ACTIONABLE, TRANSCRIPTION FACTOR | oxaliplatin | OXALIPLATIN | 24444404 |
| Page: 1 |

Copyright 2023-Present -The University of Texas Health Science Center at Houston |