
|
|||||
|
 | |
| |
| |
| |
| |
| |
|
Gene: GNA11 |
Gene summary for GNA11 |
| Gene information | Species | Human | Gene symbol | GNA11 | Gene ID | 2767 |
| Gene name | G protein subunit alpha 11 | |
| Gene Alias | FBH | |
| Cytomap | 19p13.3 | |
| Gene Type | protein-coding | GO ID | GO:0001501 | UniProtAcc | P29992 |
Top |
Malignant transformation analysis |
| Identification of the aberrant gene expression in precancerous and cancerous lesions by comparing the gene expression of stem-like cells in diseased tissues with normal stem cells |
| Entrez ID | Symbol | Replicates | Species | Organ | Tissue | Adj P-value | Log2FC | Malignancy |
| 2767 | GNA11 | HTA11_2487_2000001011 | Human | Colorectum | SER | 2.04e-10 | 6.35e-01 | -0.1808 |
| 2767 | GNA11 | HTA11_347_2000001011 | Human | Colorectum | AD | 2.86e-18 | 5.78e-01 | -0.1954 |
| 2767 | GNA11 | HTA11_2112_2000001011 | Human | Colorectum | SER | 1.78e-04 | 8.70e-01 | -0.2196 |
| 2767 | GNA11 | HTA11_3361_2000001011 | Human | Colorectum | AD | 4.62e-05 | 4.49e-01 | -0.1207 |
| 2767 | GNA11 | HTA11_83_2000001011 | Human | Colorectum | SER | 5.95e-04 | 4.72e-01 | -0.1526 |
| 2767 | GNA11 | HTA11_696_2000001011 | Human | Colorectum | AD | 3.42e-14 | 6.29e-01 | -0.1464 |
| 2767 | GNA11 | HTA11_866_2000001011 | Human | Colorectum | AD | 2.04e-03 | 3.09e-01 | -0.1001 |
| 2767 | GNA11 | HTA11_1391_2000001011 | Human | Colorectum | AD | 2.77e-06 | 4.71e-01 | -0.059 |
| 2767 | GNA11 | HTA11_2992_2000001011 | Human | Colorectum | SER | 4.17e-03 | 6.03e-01 | -0.1706 |
| 2767 | GNA11 | HTA11_5212_2000001011 | Human | Colorectum | AD | 1.09e-08 | 7.18e-01 | -0.2061 |
| 2767 | GNA11 | HTA11_7696_3000711011 | Human | Colorectum | AD | 1.68e-03 | 1.93e-01 | 0.0674 |
| 2767 | GNA11 | HTA11_99999971662_82457 | Human | Colorectum | MSS | 2.06e-02 | 1.11e-01 | 0.3859 |
| 2767 | GNA11 | A002-C-205 | Human | Colorectum | FAP | 2.69e-02 | -1.87e-01 | -0.1236 |
| 2767 | GNA11 | LZE20T | Human | Esophagus | ESCC | 1.21e-04 | 6.57e-02 | 0.0662 |
| 2767 | GNA11 | LZE24T | Human | Esophagus | ESCC | 1.60e-07 | 1.30e-01 | 0.0596 |
| 2767 | GNA11 | P2T-E | Human | Esophagus | ESCC | 2.56e-12 | 4.84e-03 | 0.1177 |
| 2767 | GNA11 | P4T-E | Human | Esophagus | ESCC | 8.45e-13 | 3.42e-02 | 0.1323 |
| 2767 | GNA11 | P5T-E | Human | Esophagus | ESCC | 1.10e-06 | -6.57e-02 | 0.1327 |
| 2767 | GNA11 | P8T-E | Human | Esophagus | ESCC | 1.06e-20 | 1.94e-01 | 0.0889 |
| 2767 | GNA11 | P9T-E | Human | Esophagus | ESCC | 1.93e-04 | 9.80e-02 | 0.1131 |
| Page: 1 2 3 4 5 6 |
| Tissue | Expression Dynamics | Abbreviation |
| Colorectum (GSE201348) |  | FAP: Familial adenomatous polyposis |
| CRC: Colorectal cancer | ||
| Colorectum (HTA11) |  | AD: Adenomas |
| SER: Sessile serrated lesions | ||
| MSI-H: Microsatellite-high colorectal cancer | ||
| MSS: Microsatellite stable colorectal cancer | ||
| Esophagus |  | ESCC: Esophageal squamous cell carcinoma |
| HGIN: High-grade intraepithelial neoplasias | ||
| LGIN: Low-grade intraepithelial neoplasias | ||
| GC | 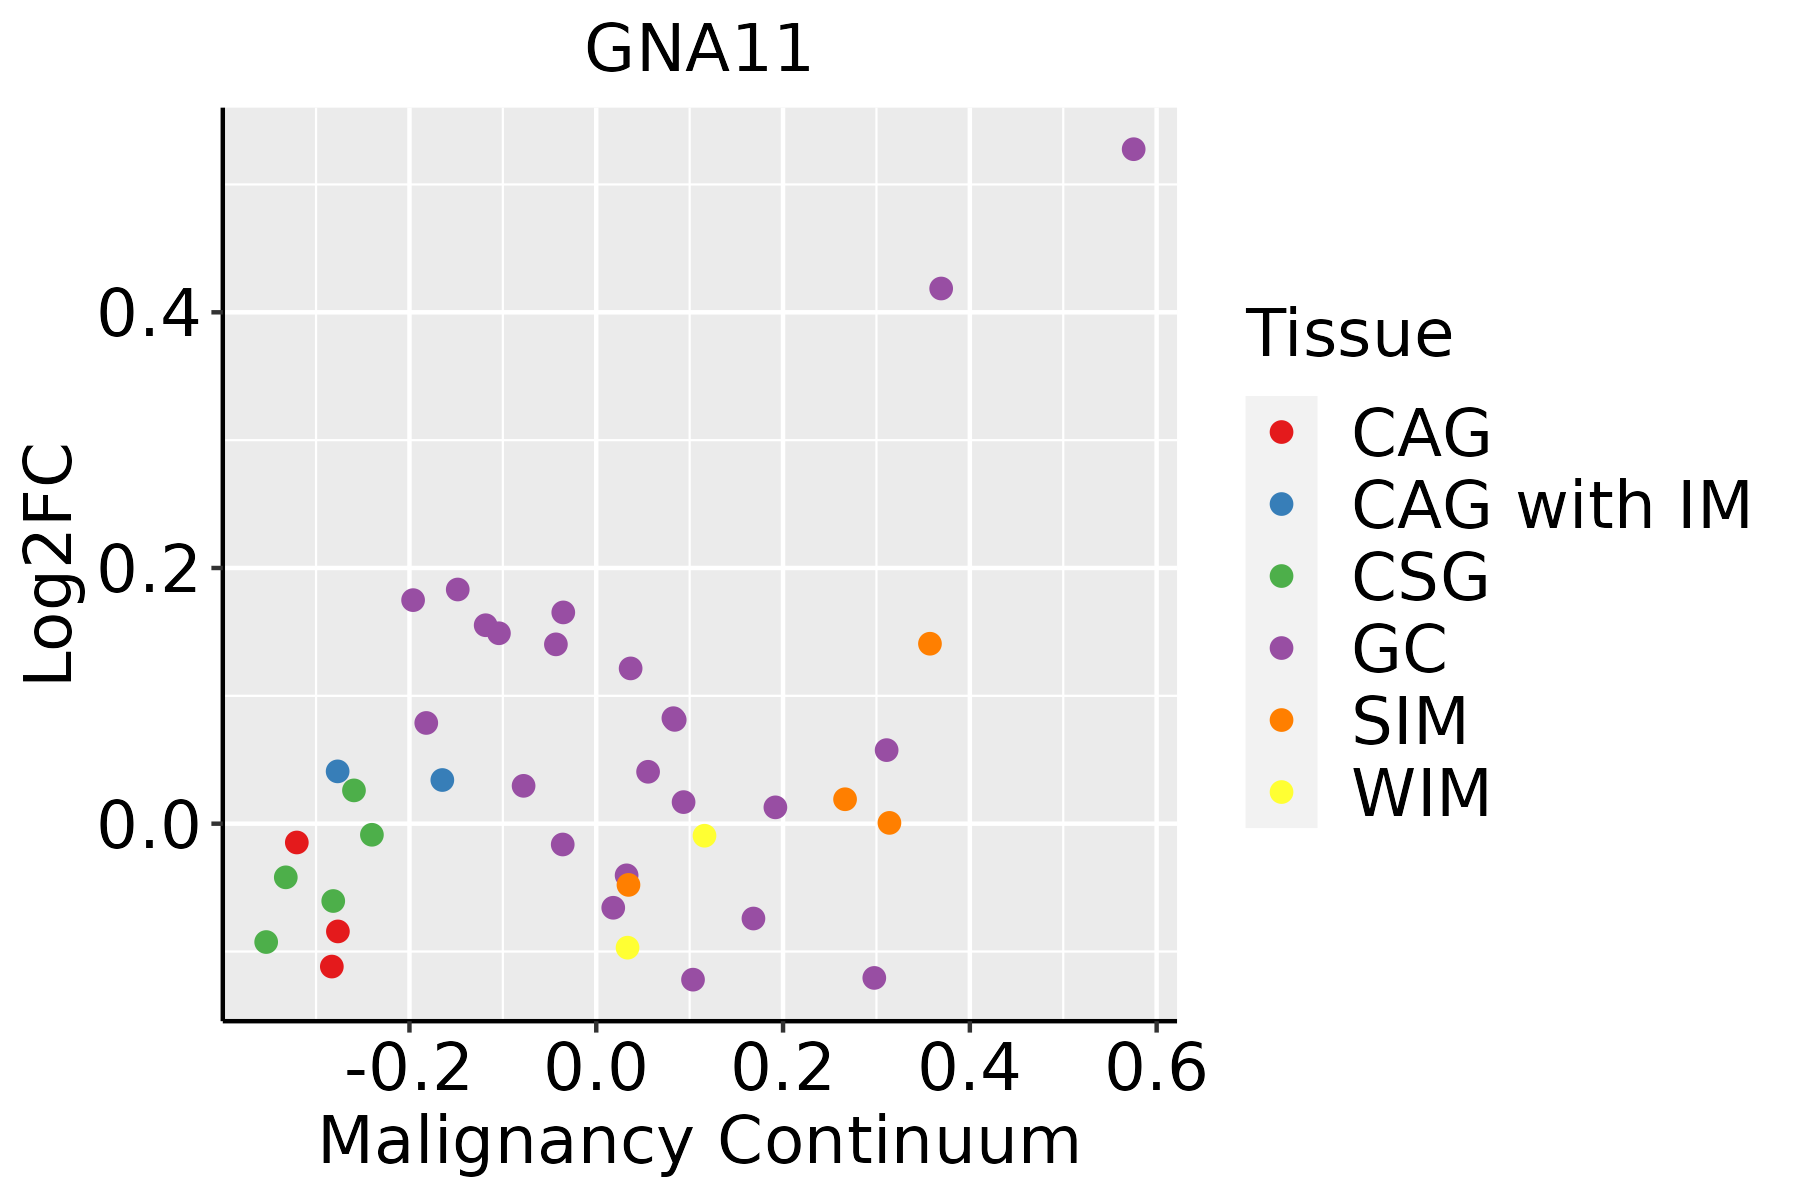 | CAG: Chronic atrophic gastritis |
| CAG with IM: Chronic atrophic gastritis with intestinal metaplasia | ||
| CSG: Chronic superficial gastritis | ||
| GC: Gastric cancer | ||
| SIM: Severe intestinal metaplasia | ||
| WIM: Wild intestinal metaplasia | ||
| Liver | 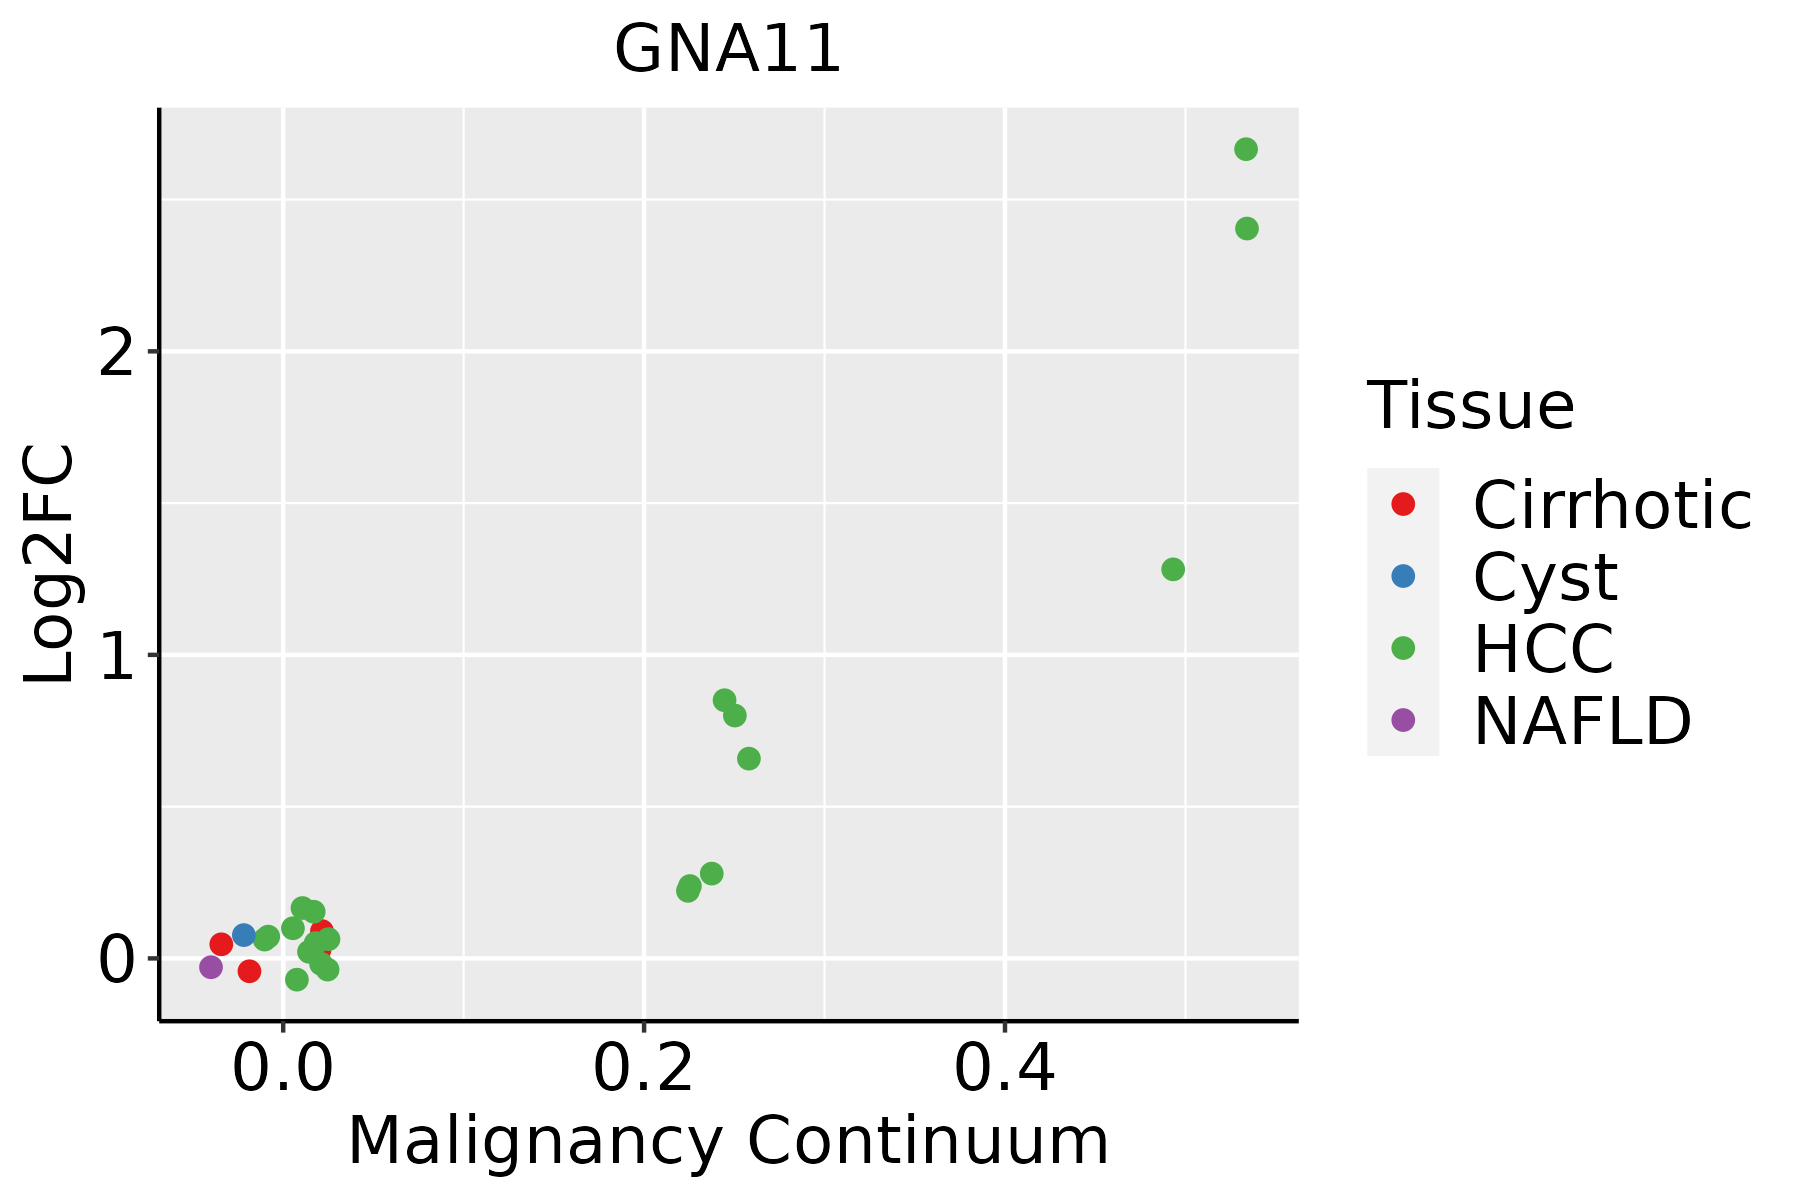 | HCC: Hepatocellular carcinoma |
| NAFLD: Non-alcoholic fatty liver disease | ||
| Oral Cavity |  | EOLP: Erosive Oral lichen planus |
| LP: leukoplakia | ||
| NEOLP: Non-erosive oral lichen planus | ||
| OSCC: Oral squamous cell carcinoma | ||
| Thyroid |  | ATC: Anaplastic thyroid cancer |
| HT: Hashimoto's thyroiditis | ||
| PTC: Papillary thyroid cancer |
| ∗log2FC in expression of this searched gene in stem-like cells from each diseased tissue sample relative to stem-like cells in normal samples in each tissue plotted against the malignancy continuum. Samples are colored based on if they are from different disease stage. |
Top |
Malignant transformation related pathway analysis |
| Find out the enriched GO biological processes and KEGG pathways involved in transition from healthy to precancer to cancer |
| Tissue | Disease Stage | Enriched GO biological Processes |
| Colorectum | AD |  |
| Colorectum | SER |  |
| Colorectum | MSS |  |
| Colorectum | MSI-H |  |
| Colorectum | FAP |  |
| ∗Top 15 enriched GO BP terms are showed in the bar plot of each disease state in each tissue. Each row represents a significant GO biological process which is colored according to the -log10(p.adjust). |
| Page: 1 2 3 4 5 6 7 8 9 |
| GO ID | Tissue | Disease Stage | Description | Gene Ratio | Bg Ratio | pvalue | p.adjust | Count |
| GO:0007623 | Colorectum | AD | circadian rhythm | 72/3918 | 210/18723 | 4.50e-06 | 1.21e-04 | 72 |
| GO:0048511 | Colorectum | AD | rhythmic process | 94/3918 | 298/18723 | 1.00e-05 | 2.34e-04 | 94 |
| GO:0042752 | Colorectum | AD | regulation of circadian rhythm | 40/3918 | 121/18723 | 1.24e-03 | 1.09e-02 | 40 |
| GO:00076231 | Colorectum | SER | circadian rhythm | 54/2897 | 210/18723 | 7.98e-05 | 1.77e-03 | 54 |
| GO:00485111 | Colorectum | SER | rhythmic process | 65/2897 | 298/18723 | 2.18e-03 | 2.11e-02 | 65 |
| GO:00427521 | Colorectum | SER | regulation of circadian rhythm | 30/2897 | 121/18723 | 5.03e-03 | 3.88e-02 | 30 |
| GO:00076232 | Colorectum | MSS | circadian rhythm | 69/3467 | 210/18723 | 4.22e-07 | 1.67e-05 | 69 |
| GO:00485112 | Colorectum | MSS | rhythmic process | 89/3467 | 298/18723 | 1.17e-06 | 3.96e-05 | 89 |
| GO:00427522 | Colorectum | MSS | regulation of circadian rhythm | 38/3467 | 121/18723 | 4.33e-04 | 5.23e-03 | 38 |
| GO:00076233 | Colorectum | FAP | circadian rhythm | 56/2622 | 210/18723 | 9.12e-07 | 4.14e-05 | 56 |
| GO:00485113 | Colorectum | FAP | rhythmic process | 72/2622 | 298/18723 | 1.67e-06 | 6.99e-05 | 72 |
| GO:00427523 | Colorectum | FAP | regulation of circadian rhythm | 33/2622 | 121/18723 | 9.26e-05 | 1.59e-03 | 33 |
| GO:0001508 | Colorectum | FAP | action potential | 34/2622 | 134/18723 | 3.30e-04 | 4.22e-03 | 34 |
| GO:0071214 | Colorectum | FAP | cellular response to abiotic stimulus | 63/2622 | 331/18723 | 6.38e-03 | 3.99e-02 | 63 |
| GO:0104004 | Colorectum | FAP | cellular response to environmental stimulus | 63/2622 | 331/18723 | 6.38e-03 | 3.99e-02 | 63 |
| GO:000931419 | Esophagus | ESCC | response to radiation | 277/8552 | 456/18723 | 4.42e-11 | 1.43e-09 | 277 |
| GO:007121419 | Esophagus | ESCC | cellular response to abiotic stimulus | 206/8552 | 331/18723 | 7.52e-10 | 1.88e-08 | 206 |
| GO:010400419 | Esophagus | ESCC | cellular response to environmental stimulus | 206/8552 | 331/18723 | 7.52e-10 | 1.88e-08 | 206 |
| GO:000941611 | Esophagus | ESCC | response to light stimulus | 183/8552 | 320/18723 | 2.03e-05 | 1.76e-04 | 183 |
| GO:004851118 | Esophagus | ESCC | rhythmic process | 164/8552 | 298/18723 | 6.80e-04 | 3.57e-03 | 164 |
| Page: 1 2 3 |
| Pathway ID | Tissue | Disease Stage | Description | Gene Ratio | Bg Ratio | pvalue | p.adjust | qvalue | Count |
| hsa05170 | Colorectum | AD | Human immunodeficiency virus 1 infection | 72/2092 | 212/8465 | 1.40e-03 | 8.46e-03 | 5.39e-03 | 72 |
| hsa05163 | Colorectum | AD | Human cytomegalovirus infection | 75/2092 | 225/8465 | 2.00e-03 | 1.10e-02 | 7.01e-03 | 75 |
| hsa04912 | Colorectum | AD | GnRH signaling pathway | 35/2092 | 93/8465 | 3.69e-03 | 1.90e-02 | 1.21e-02 | 35 |
| hsa04928 | Colorectum | AD | Parathyroid hormone synthesis, secretion and action | 38/2092 | 106/8465 | 6.60e-03 | 2.77e-02 | 1.76e-02 | 38 |
| hsa051701 | Colorectum | AD | Human immunodeficiency virus 1 infection | 72/2092 | 212/8465 | 1.40e-03 | 8.46e-03 | 5.39e-03 | 72 |
| hsa051631 | Colorectum | AD | Human cytomegalovirus infection | 75/2092 | 225/8465 | 2.00e-03 | 1.10e-02 | 7.01e-03 | 75 |
| hsa049121 | Colorectum | AD | GnRH signaling pathway | 35/2092 | 93/8465 | 3.69e-03 | 1.90e-02 | 1.21e-02 | 35 |
| hsa049281 | Colorectum | AD | Parathyroid hormone synthesis, secretion and action | 38/2092 | 106/8465 | 6.60e-03 | 2.77e-02 | 1.76e-02 | 38 |
| hsa051702 | Colorectum | SER | Human immunodeficiency virus 1 infection | 58/1580 | 212/8465 | 1.08e-03 | 8.56e-03 | 6.21e-03 | 58 |
| hsa049282 | Colorectum | SER | Parathyroid hormone synthesis, secretion and action | 31/1580 | 106/8465 | 5.20e-03 | 3.28e-02 | 2.38e-02 | 31 |
| hsa051632 | Colorectum | SER | Human cytomegalovirus infection | 57/1580 | 225/8465 | 7.40e-03 | 3.84e-02 | 2.79e-02 | 57 |
| hsa049122 | Colorectum | SER | GnRH signaling pathway | 27/1580 | 93/8465 | 9.68e-03 | 4.72e-02 | 3.43e-02 | 27 |
| hsa051703 | Colorectum | SER | Human immunodeficiency virus 1 infection | 58/1580 | 212/8465 | 1.08e-03 | 8.56e-03 | 6.21e-03 | 58 |
| hsa049283 | Colorectum | SER | Parathyroid hormone synthesis, secretion and action | 31/1580 | 106/8465 | 5.20e-03 | 3.28e-02 | 2.38e-02 | 31 |
| hsa051633 | Colorectum | SER | Human cytomegalovirus infection | 57/1580 | 225/8465 | 7.40e-03 | 3.84e-02 | 2.79e-02 | 57 |
| hsa049123 | Colorectum | SER | GnRH signaling pathway | 27/1580 | 93/8465 | 9.68e-03 | 4.72e-02 | 3.43e-02 | 27 |
| hsa051634 | Colorectum | MSS | Human cytomegalovirus infection | 74/1875 | 225/8465 | 1.12e-04 | 1.01e-03 | 6.19e-04 | 74 |
| hsa051704 | Colorectum | MSS | Human immunodeficiency virus 1 infection | 69/1875 | 212/8465 | 2.66e-04 | 1.98e-03 | 1.21e-03 | 69 |
| hsa049124 | Colorectum | MSS | GnRH signaling pathway | 35/1875 | 93/8465 | 4.81e-04 | 3.43e-03 | 2.10e-03 | 35 |
| hsa04935 | Colorectum | MSS | Growth hormone synthesis, secretion and action | 42/1875 | 120/8465 | 8.17e-04 | 5.16e-03 | 3.16e-03 | 42 |
| Page: 1 2 3 4 5 |
Top |
Cell-cell communication analysis |
| Identification of potential cell-cell interactions between two cell types and their ligand-receptor pairs for different disease states |
| Ligand | Receptor | LRpair | Pathway | Tissue | Disease Stage |
| Page: 1 |
Top |
Single-cell gene regulatory network inference analysis |
| Find out the significant the regulons (TFs) and the target genes of each regulon across cell types for different disease states |
| TF | Cell Type | Tissue | Disease Stage | Target Gene | RSS | Regulon Activity |
| ∗The dot plots of a searched regulon are shown for all cell subpopulations in each disease state of each tissue based on the regulon specific score inferred using pySCENIC and by calculating the average expression. |
| Page: 1 |
Top |
Somatic mutation of malignant transformation related genes |
| Annotation of somatic variants for genes involved in malignant transformation |
| Hugo Symbol | Variant Class | Variant Classification | dbSNP RS | HGVSc | HGVSp | HGVSp Short | SWISSPROT | BIOTYPE | SIFT | PolyPhen | Tumor Sample Barcode | Tissue | Histology | Sex | Age | Stage | Therapy Types | Drugs | Outcome |
| GNA11 | SNV | Missense_Mutation | c.340N>T | p.Arg114Trp | p.R114W | P29992 | protein_coding | tolerated(0.16) | possibly_damaging(0.776) | TCGA-A8-A09Z-01 | Breast | breast invasive carcinoma | Female | >=65 | I/II | Unknown | Unknown | SD | |
| GNA11 | SNV | Missense_Mutation | c.388A>G | p.Ser130Gly | p.S130G | P29992 | protein_coding | tolerated(0.23) | benign(0.003) | TCGA-AO-A128-01 | Breast | breast invasive carcinoma | Female | <65 | I/II | Chemotherapy | doxorubicin | SD | |
| GNA11 | insertion | Frame_Shift_Ins | novel | c.869_870insAAGGCCC | p.Asp290GlufsTer190 | p.D290Efs*190 | P29992 | protein_coding | TCGA-BH-A0HB-01 | Breast | breast invasive carcinoma | Female | <65 | I/II | Chemotherapy | docetaxel | SD | ||
| GNA11 | SNV | Missense_Mutation | c.168N>G | p.Ile56Met | p.I56M | P29992 | protein_coding | deleterious(0.03) | probably_damaging(0.997) | TCGA-C5-A1MK-01 | Cervix | cervical & endocervical cancer | Female | >=65 | III/IV | Chemotherapy | carboplatin | PD | |
| GNA11 | SNV | Missense_Mutation | c.733G>A | p.Glu245Lys | p.E245K | P29992 | protein_coding | tolerated(0.24) | benign(0.339) | TCGA-C5-A7UH-01 | Cervix | cervical & endocervical cancer | Female | <65 | III/IV | Chemotherapy | cisplatin | SD | |
| GNA11 | SNV | Missense_Mutation | novel | c.721N>A | p.Glu241Lys | p.E241K | P29992 | protein_coding | deleterious(0.01) | probably_damaging(0.987) | TCGA-LP-A5U2-01 | Cervix | cervical & endocervical cancer | Female | <65 | III/IV | Unknown | Unknown | SD |
| GNA11 | SNV | Missense_Mutation | novel | c.502G>A | p.Ala168Thr | p.A168T | P29992 | protein_coding | tolerated(0.39) | benign(0.005) | TCGA-AA-3949-01 | Colorectum | colon adenocarcinoma | Female | >=65 | III/IV | Unknown | Unknown | SD |
| GNA11 | SNV | Missense_Mutation | rs769503200 | c.691G>A | p.Ala231Thr | p.A231T | P29992 | protein_coding | deleterious(0) | probably_damaging(0.998) | TCGA-AA-A010-01 | Colorectum | colon adenocarcinoma | Female | <65 | I/II | Chemotherapy | folinic | CR |
| GNA11 | SNV | Missense_Mutation | rs775624350 | c.490N>A | p.Val164Ile | p.V164I | P29992 | protein_coding | tolerated(0.25) | benign(0.003) | TCGA-AU-6004-01 | Colorectum | colon adenocarcinoma | Female | >=65 | I/II | Unknown | Unknown | SD |
| GNA11 | SNV | Missense_Mutation | c.302N>G | p.Tyr101Cys | p.Y101C | P29992 | protein_coding | deleterious(0) | probably_damaging(0.99) | TCGA-CK-4951-01 | Colorectum | colon adenocarcinoma | Female | >=65 | I/II | Unknown | Unknown | PD |
| Page: 1 2 3 |
Top |
Related drugs of malignant transformation related genes |
| Identification of chemicals and drugs interact with genes involved in malignant transfromation |
| (DGIdb 4.0) |
| Entrez ID | Symbol | Category | Interaction Types | Drug Claim Name | Drug Name | PMIDs |
| 2767 | GNA11 | CLINICALLY ACTIONABLE | MEK INHIBITOR PD0325901 | 24141786 | ||
| 2767 | GNA11 | CLINICALLY ACTIONABLE | AEB071 | SOTRASTAURIN | 24141786,27507190 | |
| 2767 | GNA11 | CLINICALLY ACTIONABLE | CGM097 | CGM-097 | 27507190 | |
| 2767 | GNA11 | CLINICALLY ACTIONABLE | SELUMETINIB | SELUMETINIB | 26619011,2549426,22808163,24141786,21083380,21444680,25157968,1328859,22733540 | |
| 2767 | GNA11 | CLINICALLY ACTIONABLE | CABOZANTINIB | CABOZANTINIB | 28103611 | |
| 2767 | GNA11 | CLINICALLY ACTIONABLE | SOTRASTAURIN ACETATE | 24141786 | ||
| 2767 | GNA11 | CLINICALLY ACTIONABLE | MEK162 | BINIMETINIB | 24141786,27507190 | |
| 2767 | GNA11 | CLINICALLY ACTIONABLE | TAK-733 | TAK-733 | 22515704 | |
| 2767 | GNA11 | CLINICALLY ACTIONABLE | Everolimus | EVEROLIMUS | 27507190 | |
| 2767 | GNA11 | CLINICALLY ACTIONABLE | Trametinib | TRAMETINIB | 22733540 |
| Page: 1 |

Copyright 2023-Present -The University of Texas Health Science Center at Houston |