
|
|||||
|
 | |
| |
| |
| |
| |
| |
|
Gene: GMPR2 |
Gene summary for GMPR2 |
| Gene information | Species | Human | Gene symbol | GMPR2 | Gene ID | 51292 |
| Gene name | guanosine monophosphate reductase 2 | |
| Gene Alias | GMPR 2 | |
| Cytomap | 14q12 | |
| Gene Type | protein-coding | GO ID | GO:0006139 | UniProtAcc | Q9P2T1 |
Top |
Malignant transformation analysis |
| Identification of the aberrant gene expression in precancerous and cancerous lesions by comparing the gene expression of stem-like cells in diseased tissues with normal stem cells |
| Entrez ID | Symbol | Replicates | Species | Organ | Tissue | Adj P-value | Log2FC | Malignancy |
| 51292 | GMPR2 | LZE2T | Human | Esophagus | ESCC | 2.82e-02 | 3.43e-01 | 0.082 |
| 51292 | GMPR2 | LZE4T | Human | Esophagus | ESCC | 1.61e-13 | 5.22e-01 | 0.0811 |
| 51292 | GMPR2 | LZE8T | Human | Esophagus | ESCC | 1.08e-04 | 1.94e-01 | 0.067 |
| 51292 | GMPR2 | LZE20T | Human | Esophagus | ESCC | 6.94e-04 | 1.69e-01 | 0.0662 |
| 51292 | GMPR2 | LZE24T | Human | Esophagus | ESCC | 1.06e-19 | 7.19e-01 | 0.0596 |
| 51292 | GMPR2 | LZE6T | Human | Esophagus | ESCC | 1.89e-03 | 1.13e-01 | 0.0845 |
| 51292 | GMPR2 | P1T-E | Human | Esophagus | ESCC | 1.37e-06 | 4.18e-01 | 0.0875 |
| 51292 | GMPR2 | P2T-E | Human | Esophagus | ESCC | 2.00e-31 | 3.46e-01 | 0.1177 |
| 51292 | GMPR2 | P4T-E | Human | Esophagus | ESCC | 5.53e-20 | 5.69e-01 | 0.1323 |
| 51292 | GMPR2 | P5T-E | Human | Esophagus | ESCC | 1.55e-15 | 3.52e-01 | 0.1327 |
| 51292 | GMPR2 | P8T-E | Human | Esophagus | ESCC | 2.26e-35 | 7.64e-01 | 0.0889 |
| 51292 | GMPR2 | P9T-E | Human | Esophagus | ESCC | 2.70e-14 | 3.72e-01 | 0.1131 |
| 51292 | GMPR2 | P10T-E | Human | Esophagus | ESCC | 4.56e-35 | 5.16e-01 | 0.116 |
| 51292 | GMPR2 | P11T-E | Human | Esophagus | ESCC | 5.72e-11 | 5.83e-01 | 0.1426 |
| 51292 | GMPR2 | P12T-E | Human | Esophagus | ESCC | 1.20e-58 | 1.21e+00 | 0.1122 |
| 51292 | GMPR2 | P15T-E | Human | Esophagus | ESCC | 2.85e-55 | 1.24e+00 | 0.1149 |
| 51292 | GMPR2 | P16T-E | Human | Esophagus | ESCC | 3.79e-27 | 3.91e-01 | 0.1153 |
| 51292 | GMPR2 | P17T-E | Human | Esophagus | ESCC | 6.89e-06 | 4.12e-01 | 0.1278 |
| 51292 | GMPR2 | P19T-E | Human | Esophagus | ESCC | 1.14e-04 | 6.45e-01 | 0.1662 |
| 51292 | GMPR2 | P20T-E | Human | Esophagus | ESCC | 7.61e-15 | 2.94e-01 | 0.1124 |
| Page: 1 2 3 4 5 6 |
| Tissue | Expression Dynamics | Abbreviation |
| Esophagus | 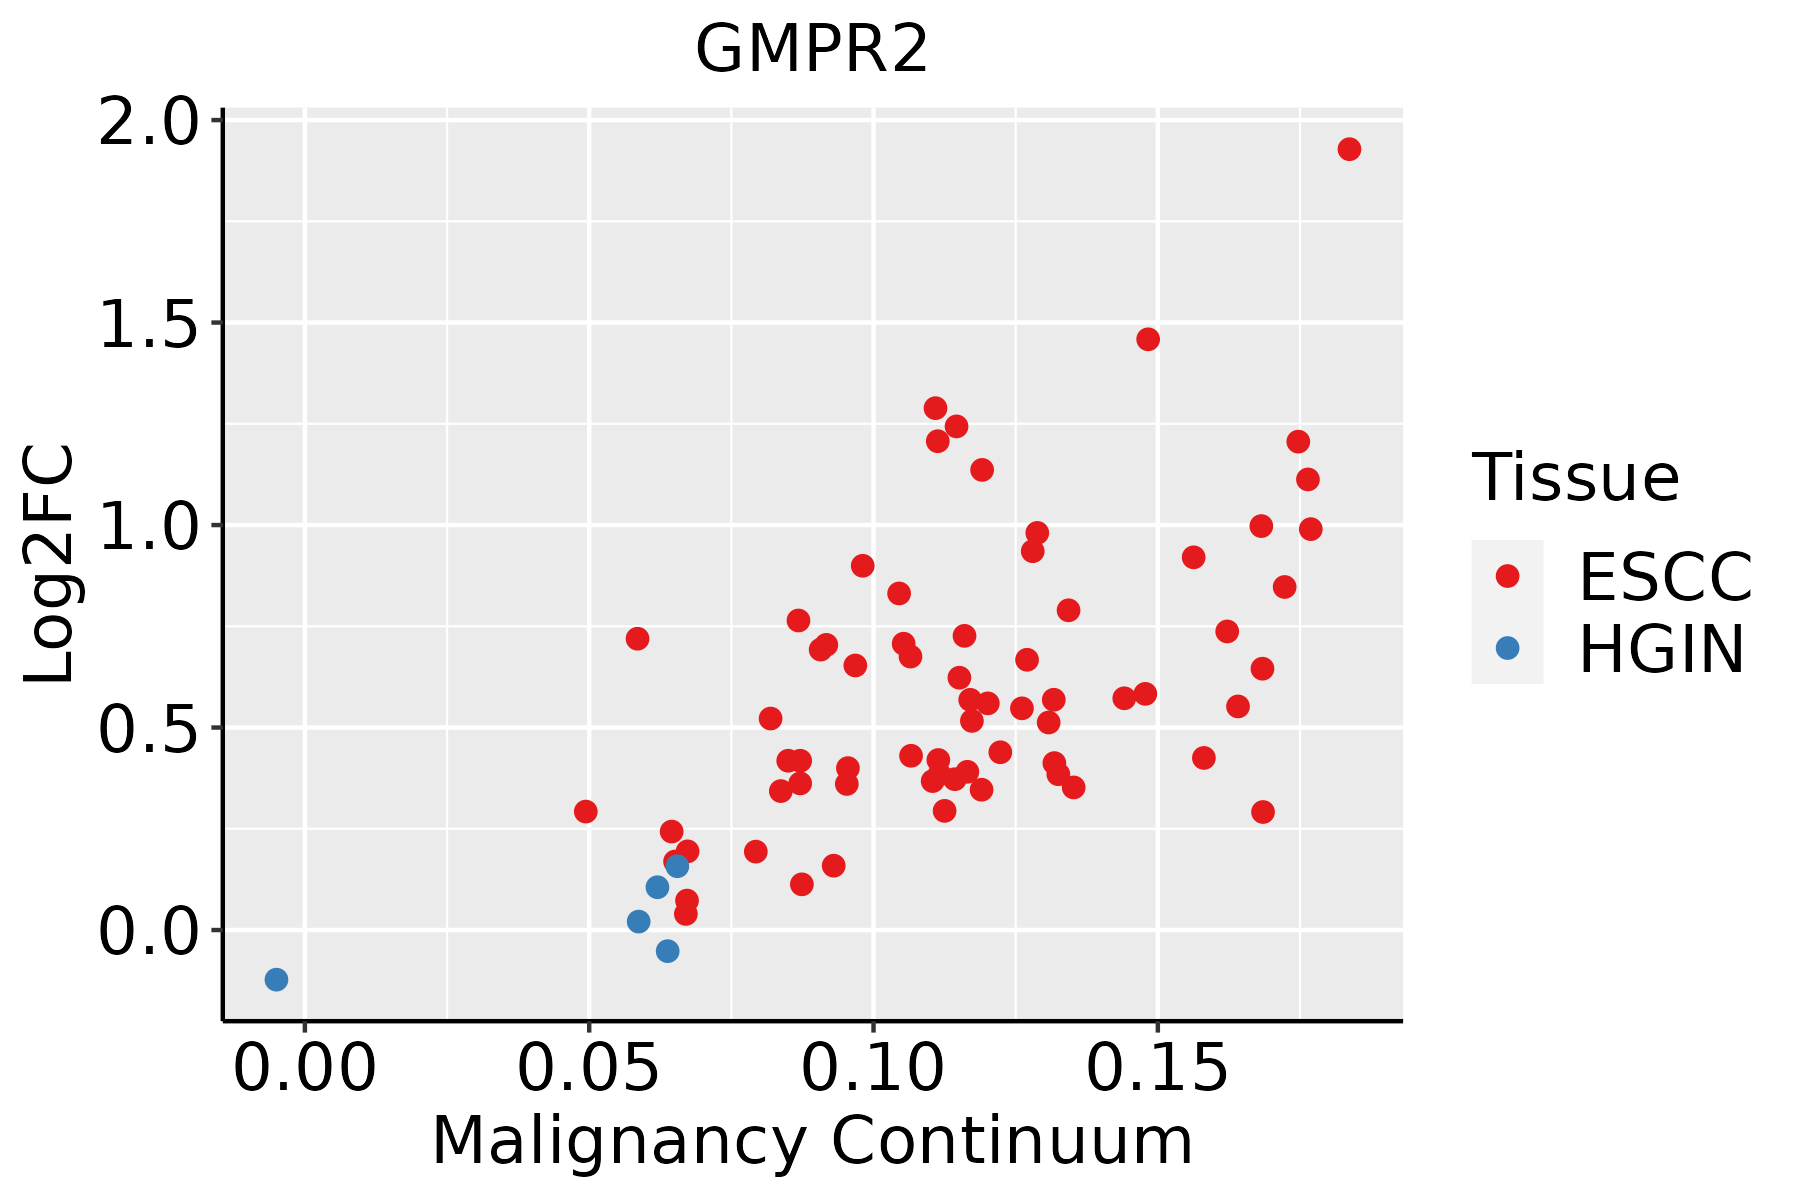 | ESCC: Esophageal squamous cell carcinoma |
| HGIN: High-grade intraepithelial neoplasias | ||
| LGIN: Low-grade intraepithelial neoplasias | ||
| Liver | 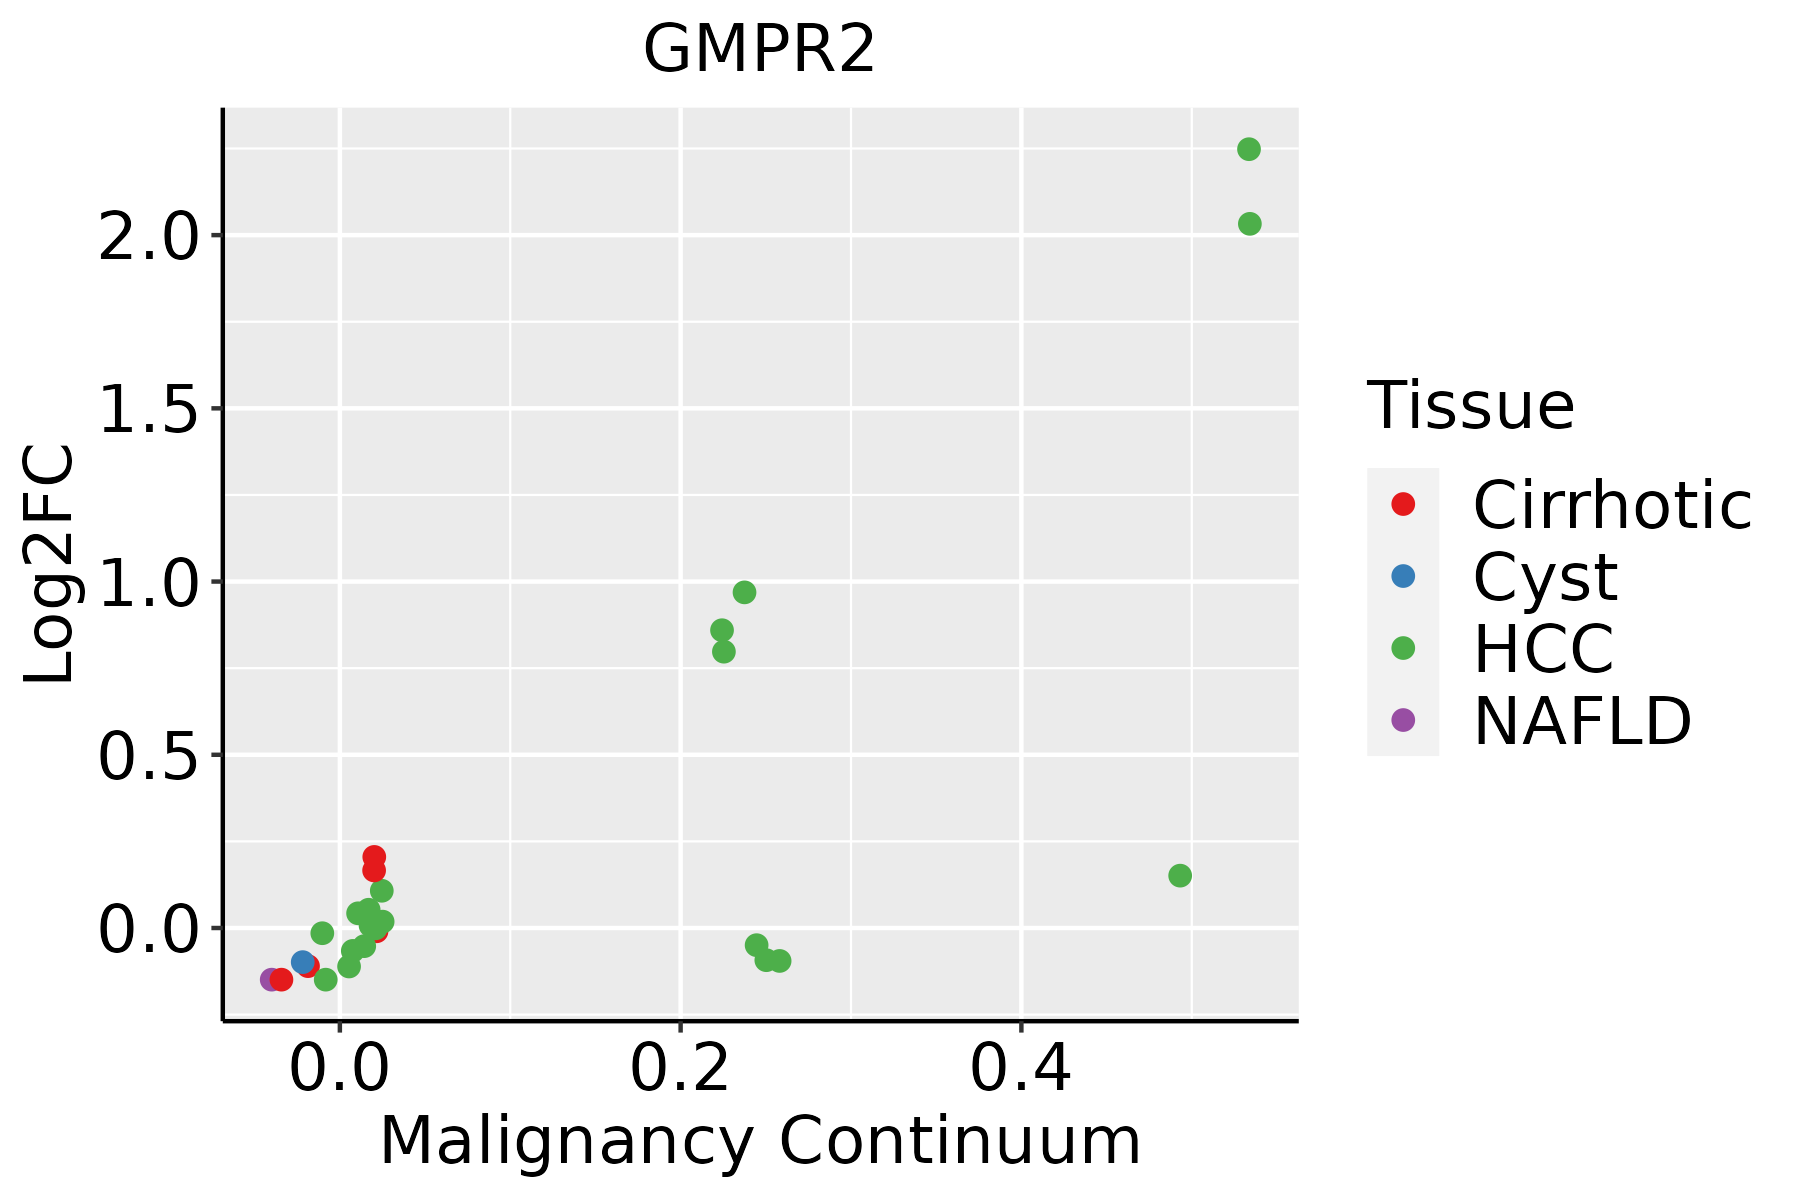 | HCC: Hepatocellular carcinoma |
| NAFLD: Non-alcoholic fatty liver disease | ||
| Oral Cavity | 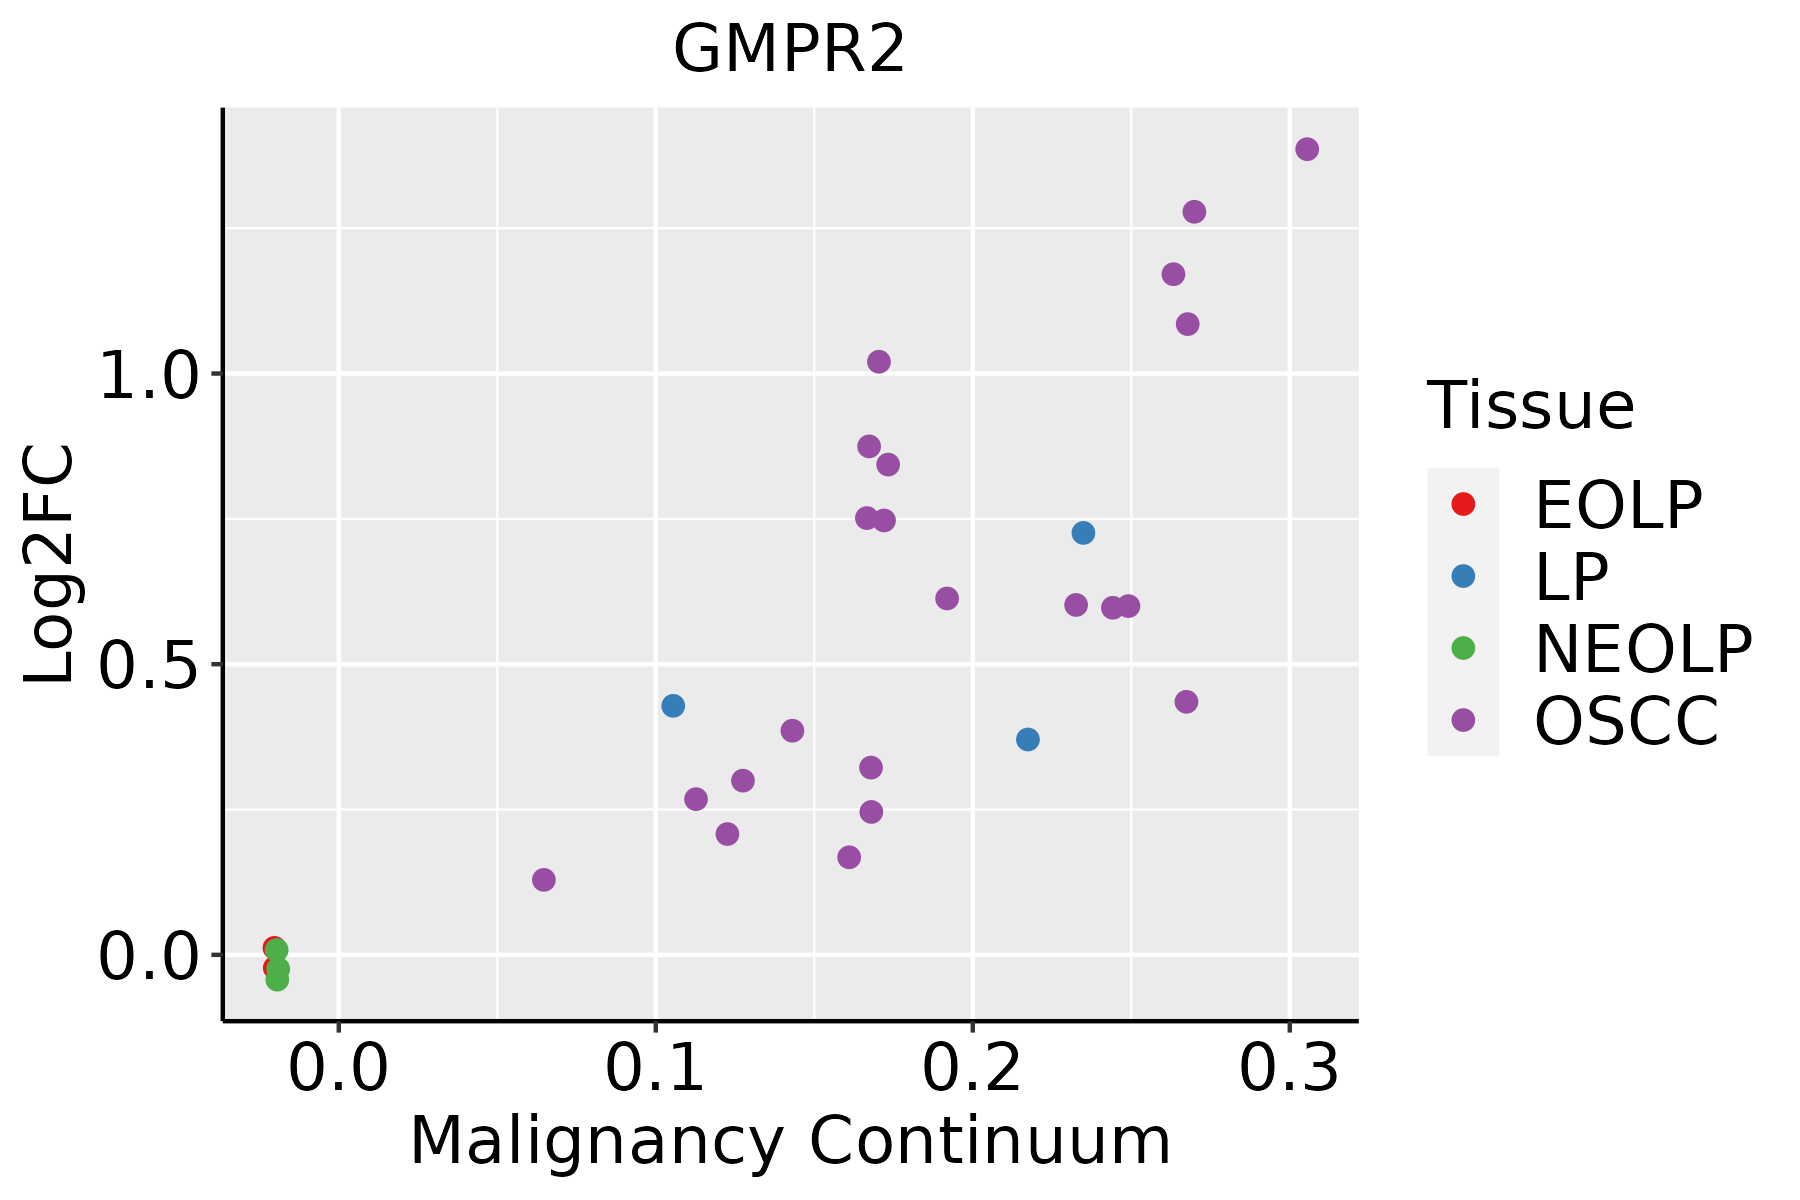 | EOLP: Erosive Oral lichen planus |
| LP: leukoplakia | ||
| NEOLP: Non-erosive oral lichen planus | ||
| OSCC: Oral squamous cell carcinoma | ||
| Skin | 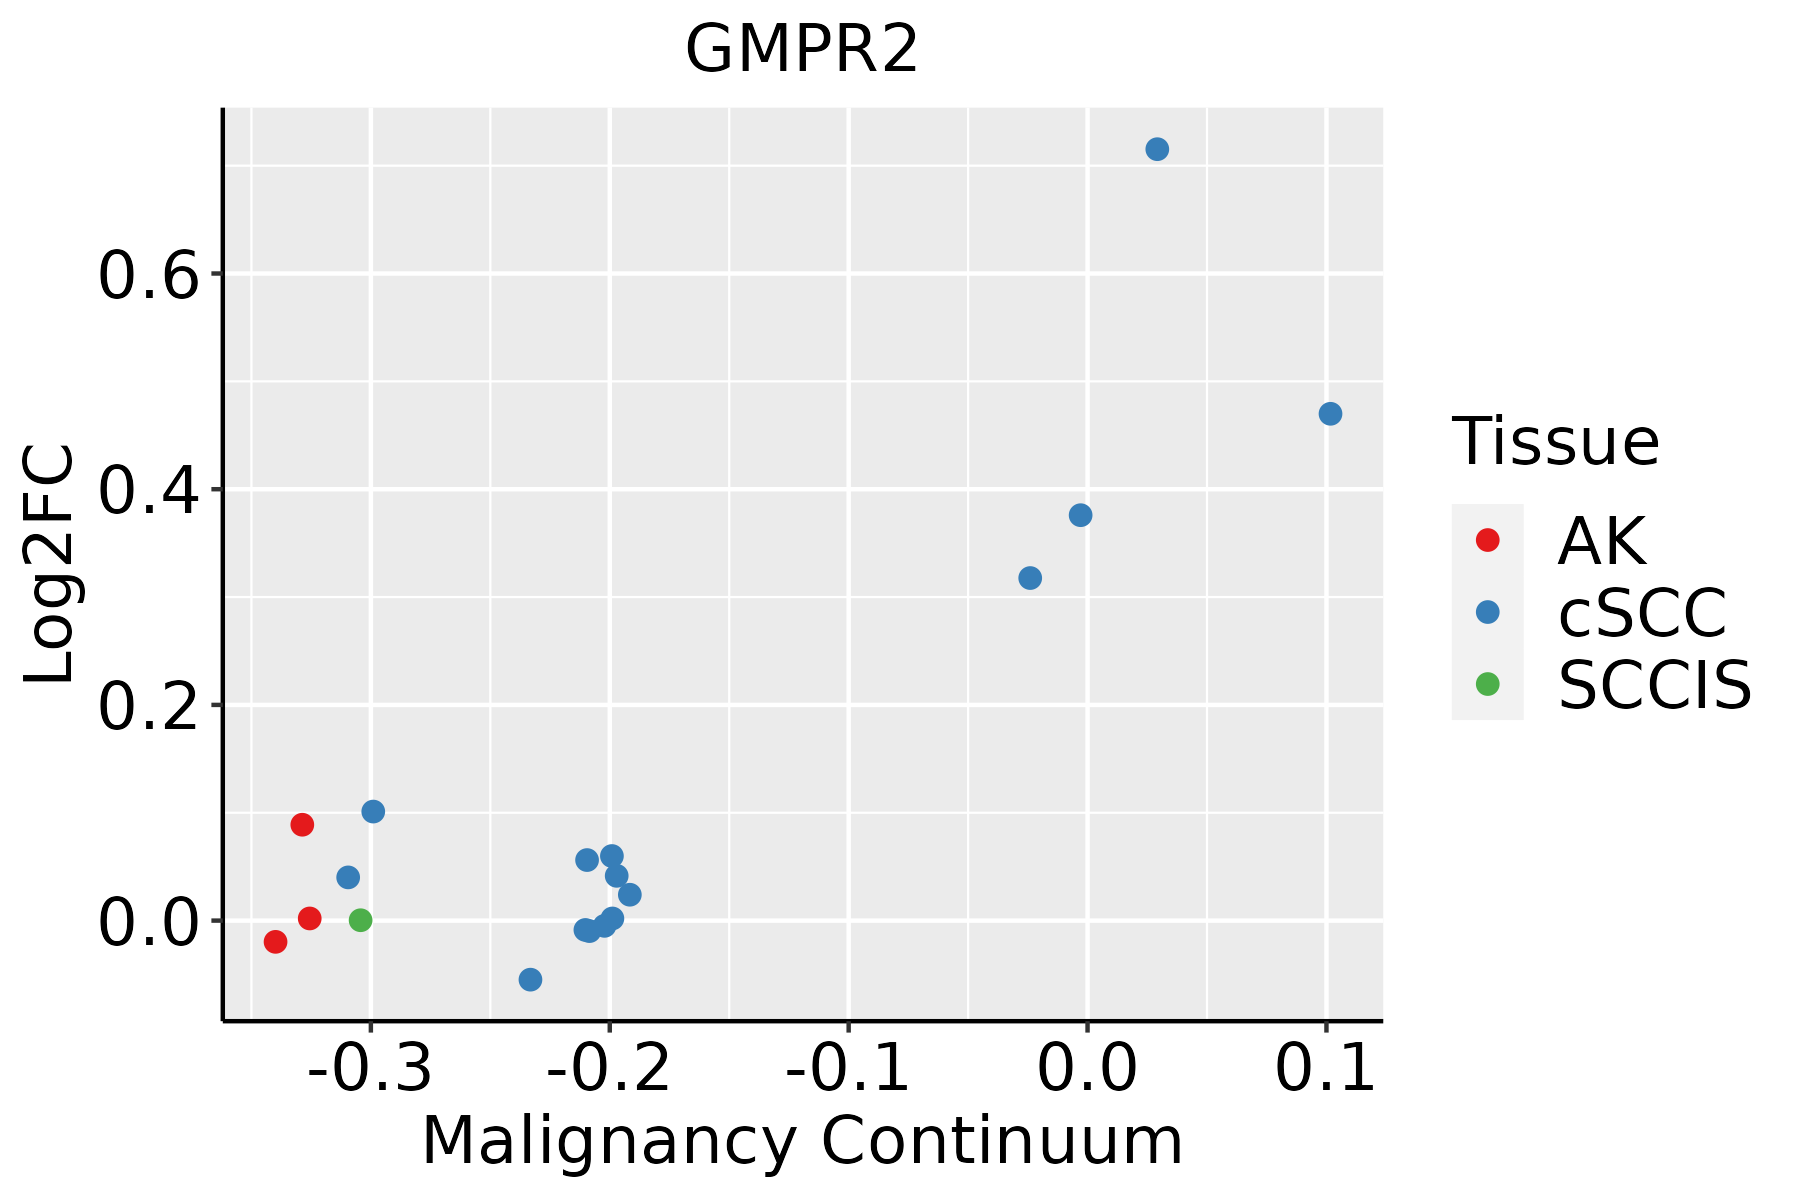 | AK: Actinic keratosis |
| cSCC: Cutaneous squamous cell carcinoma | ||
| SCCIS:squamous cell carcinoma in situ | ||
| Thyroid |  | ATC: Anaplastic thyroid cancer |
| HT: Hashimoto's thyroiditis | ||
| PTC: Papillary thyroid cancer |
| ∗log2FC in expression of this searched gene in stem-like cells from each diseased tissue sample relative to stem-like cells in normal samples in each tissue plotted against the malignancy continuum. Samples are colored based on if they are from different disease stage. |
Top |
Malignant transformation related pathway analysis |
| Find out the enriched GO biological processes and KEGG pathways involved in transition from healthy to precancer to cancer |
| Tissue | Disease Stage | Enriched GO biological Processes |
| Colorectum | AD |  |
| Colorectum | SER |  |
| Colorectum | MSS |  |
| Colorectum | MSI-H |  |
| Colorectum | FAP |  |
| ∗Top 15 enriched GO BP terms are showed in the bar plot of each disease state in each tissue. Each row represents a significant GO biological process which is colored according to the -log10(p.adjust). |
| Page: 1 2 3 4 5 6 7 8 9 |
| GO ID | Tissue | Disease Stage | Description | Gene Ratio | Bg Ratio | pvalue | p.adjust | Count |
| GO:0006753110 | Esophagus | ESCC | nucleoside phosphate metabolic process | 288/8552 | 497/18723 | 1.80e-08 | 3.50e-07 | 288 |
| GO:0019693111 | Esophagus | ESCC | ribose phosphate metabolic process | 234/8552 | 396/18723 | 4.24e-08 | 7.76e-07 | 234 |
| GO:0009117111 | Esophagus | ESCC | nucleotide metabolic process | 282/8552 | 489/18723 | 4.70e-08 | 8.50e-07 | 282 |
| GO:0009259111 | Esophagus | ESCC | ribonucleotide metabolic process | 224/8552 | 385/18723 | 4.41e-07 | 6.00e-06 | 224 |
| GO:0072521111 | Esophagus | ESCC | purine-containing compound metabolic process | 238/8552 | 416/18723 | 1.20e-06 | 1.49e-05 | 238 |
| GO:0009150111 | Esophagus | ESCC | purine ribonucleotide metabolic process | 213/8552 | 368/18723 | 1.40e-06 | 1.69e-05 | 213 |
| GO:0006163111 | Esophagus | ESCC | purine nucleotide metabolic process | 226/8552 | 396/18723 | 2.81e-06 | 3.21e-05 | 226 |
| GO:00091234 | Esophagus | ESCC | nucleoside monophosphate metabolic process | 49/8552 | 76/18723 | 7.30e-04 | 3.80e-03 | 49 |
| GO:00091124 | Esophagus | ESCC | nucleobase metabolic process | 25/8552 | 34/18723 | 9.19e-04 | 4.68e-03 | 25 |
| GO:00091615 | Esophagus | ESCC | ribonucleoside monophosphate metabolic process | 38/8552 | 58/18723 | 1.81e-03 | 8.32e-03 | 38 |
| GO:00091269 | Esophagus | ESCC | purine nucleoside monophosphate metabolic process | 30/8552 | 44/18723 | 2.14e-03 | 9.54e-03 | 30 |
| GO:00091678 | Esophagus | ESCC | purine ribonucleoside monophosphate metabolic process | 27/8552 | 41/18723 | 7.31e-03 | 2.63e-02 | 27 |
| GO:00061444 | Esophagus | ESCC | purine nucleobase metabolic process | 14/8552 | 19/18723 | 1.27e-02 | 4.21e-02 | 14 |
| GO:000675312 | Liver | Cirrhotic | nucleoside phosphate metabolic process | 190/4634 | 497/18723 | 1.10e-11 | 6.96e-10 | 190 |
| GO:000911712 | Liver | Cirrhotic | nucleotide metabolic process | 187/4634 | 489/18723 | 1.55e-11 | 9.63e-10 | 187 |
| GO:001969312 | Liver | Cirrhotic | ribose phosphate metabolic process | 156/4634 | 396/18723 | 5.83e-11 | 3.23e-09 | 156 |
| GO:000925912 | Liver | Cirrhotic | ribonucleotide metabolic process | 151/4634 | 385/18723 | 1.72e-10 | 8.70e-09 | 151 |
| GO:007252112 | Liver | Cirrhotic | purine-containing compound metabolic process | 156/4634 | 416/18723 | 3.74e-09 | 1.52e-07 | 156 |
| GO:000915012 | Liver | Cirrhotic | purine ribonucleotide metabolic process | 141/4634 | 368/18723 | 4.22e-09 | 1.70e-07 | 141 |
| GO:000616312 | Liver | Cirrhotic | purine nucleotide metabolic process | 146/4634 | 396/18723 | 4.12e-08 | 1.34e-06 | 146 |
| Page: 1 2 3 4 5 |
| Pathway ID | Tissue | Disease Stage | Description | Gene Ratio | Bg Ratio | pvalue | p.adjust | qvalue | Count |
| hsa012325 | Esophagus | ESCC | Nucleotide metabolism | 59/4205 | 85/8465 | 1.67e-04 | 6.58e-04 | 3.37e-04 | 59 |
| hsa0123212 | Esophagus | ESCC | Nucleotide metabolism | 59/4205 | 85/8465 | 1.67e-04 | 6.58e-04 | 3.37e-04 | 59 |
| hsa01232 | Liver | Cirrhotic | Nucleotide metabolism | 39/2530 | 85/8465 | 1.27e-03 | 6.73e-03 | 4.15e-03 | 39 |
| hsa012321 | Liver | Cirrhotic | Nucleotide metabolism | 39/2530 | 85/8465 | 1.27e-03 | 6.73e-03 | 4.15e-03 | 39 |
| hsa012322 | Liver | HCC | Nucleotide metabolism | 59/4020 | 85/8465 | 3.30e-05 | 1.88e-04 | 1.04e-04 | 59 |
| hsa012323 | Liver | HCC | Nucleotide metabolism | 59/4020 | 85/8465 | 3.30e-05 | 1.88e-04 | 1.04e-04 | 59 |
| hsa012324 | Oral cavity | OSCC | Nucleotide metabolism | 54/3704 | 85/8465 | 1.78e-04 | 5.95e-04 | 3.03e-04 | 54 |
| hsa0123211 | Oral cavity | OSCC | Nucleotide metabolism | 54/3704 | 85/8465 | 1.78e-04 | 5.95e-04 | 3.03e-04 | 54 |
| hsa0123221 | Oral cavity | LP | Nucleotide metabolism | 42/2418 | 85/8465 | 3.62e-05 | 2.36e-04 | 1.52e-04 | 42 |
| hsa0123231 | Oral cavity | LP | Nucleotide metabolism | 42/2418 | 85/8465 | 3.62e-05 | 2.36e-04 | 1.52e-04 | 42 |
| Page: 1 |
Top |
Cell-cell communication analysis |
| Identification of potential cell-cell interactions between two cell types and their ligand-receptor pairs for different disease states |
| Ligand | Receptor | LRpair | Pathway | Tissue | Disease Stage |
| Page: 1 |
Top |
Single-cell gene regulatory network inference analysis |
| Find out the significant the regulons (TFs) and the target genes of each regulon across cell types for different disease states |
| TF | Cell Type | Tissue | Disease Stage | Target Gene | RSS | Regulon Activity |
| ∗The dot plots of a searched regulon are shown for all cell subpopulations in each disease state of each tissue based on the regulon specific score inferred using pySCENIC and by calculating the average expression. |
| Page: 1 |
Top |
Somatic mutation of malignant transformation related genes |
| Annotation of somatic variants for genes involved in malignant transformation |
| Hugo Symbol | Variant Class | Variant Classification | dbSNP RS | HGVSc | HGVSp | HGVSp Short | SWISSPROT | BIOTYPE | SIFT | PolyPhen | Tumor Sample Barcode | Tissue | Histology | Sex | Age | Stage | Therapy Types | Drugs | Outcome |
| GMPR2 | SNV | Missense_Mutation | c.40N>T | p.Pro14Ser | p.P14S | protein_coding | tolerated_low_confidence(0.1) | benign(0.046) | TCGA-A8-A09D-01 | Breast | breast invasive carcinoma | Female | <65 | I/II | Chemotherapy | doxorubicin | CR | ||
| GMPR2 | SNV | Missense_Mutation | c.868N>C | p.Glu290Gln | p.E290Q | protein_coding | tolerated(0.17) | possibly_damaging(0.825) | TCGA-AC-A23H-01 | Breast | breast invasive carcinoma | Female | >=65 | I/II | Unknown | Unknown | PD | ||
| GMPR2 | SNV | Missense_Mutation | rs537372849 | c.406N>A | p.Glu136Lys | p.E136K | protein_coding | tolerated(0.64) | benign(0.009) | TCGA-JW-A5VL-01 | Cervix | cervical & endocervical cancer | Female | <65 | I/II | Unknown | Unknown | SD | |
| GMPR2 | SNV | Missense_Mutation | c.1076A>C | p.Lys359Thr | p.K359T | protein_coding | tolerated(0.07) | benign(0) | TCGA-A6-6141-01 | Colorectum | colon adenocarcinoma | Male | <65 | I/II | Chemotherapy | 5-fu | SD | ||
| GMPR2 | SNV | Missense_Mutation | c.421G>A | p.Val141Met | p.V141M | protein_coding | tolerated(0.07) | benign(0.08) | TCGA-AA-3715-01 | Colorectum | colon adenocarcinoma | Male | >=65 | I/II | Unknown | Unknown | PD | ||
| GMPR2 | SNV | Missense_Mutation | novel | c.1097N>T | p.Ala366Val | p.A366V | protein_coding | deleterious(0.02) | probably_damaging(0.986) | TCGA-AA-3984-01 | Colorectum | colon adenocarcinoma | Female | <65 | I/II | Unknown | Unknown | SD | |
| GMPR2 | SNV | Missense_Mutation | novel | c.235N>C | p.Phe79Leu | p.F79L | protein_coding | tolerated(0.06) | benign(0.106) | TCGA-AD-6889-01 | Colorectum | colon adenocarcinoma | Male | >=65 | I/II | Chemotherapy | xeloda | PD | |
| GMPR2 | SNV | Missense_Mutation | c.1030N>A | p.Val344Met | p.V344M | protein_coding | tolerated(0.08) | benign(0.015) | TCGA-CK-4951-01 | Colorectum | colon adenocarcinoma | Female | >=65 | I/II | Unknown | Unknown | PD | ||
| GMPR2 | SNV | Missense_Mutation | c.248N>G | p.Lys83Arg | p.K83R | protein_coding | tolerated(0.44) | benign(0.02) | TCGA-NH-A5IV-01 | Colorectum | colon adenocarcinoma | Female | >=65 | I/II | Unknown | Unknown | SD | ||
| GMPR2 | SNV | Missense_Mutation | novel | c.128N>C | p.Lys43Thr | p.K43T | protein_coding | tolerated(0.1) | probably_damaging(0.998) | TCGA-AG-3892-01 | Colorectum | rectum adenocarcinoma | Female | <65 | I/II | Unknown | Unknown | SD |
| Page: 1 2 3 |
Top |
Related drugs of malignant transformation related genes |
| Identification of chemicals and drugs interact with genes involved in malignant transfromation |
| (DGIdb 4.0) |
| Entrez ID | Symbol | Category | Interaction Types | Drug Claim Name | Drug Name | PMIDs |
| Page: 1 |

Copyright 2023-Present -The University of Texas Health Science Center at Houston |