
|
|||||
|
 | |
| |
| |
| |
| |
| |
|
Gene: GMPPB |
Gene summary for GMPPB |
| Gene information | Species | Human | Gene symbol | GMPPB | Gene ID | 29925 |
| Gene name | GDP-mannose pyrophosphorylase B | |
| Gene Alias | LGMDR19 | |
| Cytomap | 3p21.31 | |
| Gene Type | protein-coding | GO ID | GO:0000032 | UniProtAcc | Q9Y5P6 |
Top |
Malignant transformation analysis |
| Identification of the aberrant gene expression in precancerous and cancerous lesions by comparing the gene expression of stem-like cells in diseased tissues with normal stem cells |
| Entrez ID | Symbol | Replicates | Species | Organ | Tissue | Adj P-value | Log2FC | Malignancy |
| 29925 | GMPPB | LZE22T | Human | Esophagus | ESCC | 3.86e-02 | 1.76e-01 | 0.068 |
| 29925 | GMPPB | LZE24T | Human | Esophagus | ESCC | 6.63e-05 | 1.65e-01 | 0.0596 |
| 29925 | GMPPB | P2T-E | Human | Esophagus | ESCC | 1.49e-04 | 1.42e-01 | 0.1177 |
| 29925 | GMPPB | P4T-E | Human | Esophagus | ESCC | 3.34e-15 | 3.63e-01 | 0.1323 |
| 29925 | GMPPB | P5T-E | Human | Esophagus | ESCC | 2.82e-10 | 1.78e-01 | 0.1327 |
| 29925 | GMPPB | P8T-E | Human | Esophagus | ESCC | 8.16e-04 | 1.08e-01 | 0.0889 |
| 29925 | GMPPB | P9T-E | Human | Esophagus | ESCC | 9.41e-09 | 2.06e-01 | 0.1131 |
| 29925 | GMPPB | P10T-E | Human | Esophagus | ESCC | 4.83e-04 | 5.59e-02 | 0.116 |
| 29925 | GMPPB | P11T-E | Human | Esophagus | ESCC | 9.43e-05 | 2.19e-01 | 0.1426 |
| 29925 | GMPPB | P12T-E | Human | Esophagus | ESCC | 4.95e-06 | 5.23e-02 | 0.1122 |
| 29925 | GMPPB | P17T-E | Human | Esophagus | ESCC | 2.60e-03 | 2.07e-01 | 0.1278 |
| 29925 | GMPPB | P19T-E | Human | Esophagus | ESCC | 2.73e-04 | 5.77e-01 | 0.1662 |
| 29925 | GMPPB | P20T-E | Human | Esophagus | ESCC | 3.53e-11 | 1.43e-01 | 0.1124 |
| 29925 | GMPPB | P21T-E | Human | Esophagus | ESCC | 1.12e-12 | 2.94e-01 | 0.1617 |
| 29925 | GMPPB | P22T-E | Human | Esophagus | ESCC | 4.24e-07 | 1.39e-01 | 0.1236 |
| 29925 | GMPPB | P23T-E | Human | Esophagus | ESCC | 6.35e-21 | 4.56e-01 | 0.108 |
| 29925 | GMPPB | P24T-E | Human | Esophagus | ESCC | 6.71e-11 | 2.26e-01 | 0.1287 |
| 29925 | GMPPB | P26T-E | Human | Esophagus | ESCC | 7.44e-03 | 8.02e-02 | 0.1276 |
| 29925 | GMPPB | P30T-E | Human | Esophagus | ESCC | 8.99e-06 | 3.21e-01 | 0.137 |
| 29925 | GMPPB | P31T-E | Human | Esophagus | ESCC | 8.28e-11 | 2.00e-01 | 0.1251 |
| Page: 1 2 3 4 |
| Tissue | Expression Dynamics | Abbreviation |
| Esophagus | 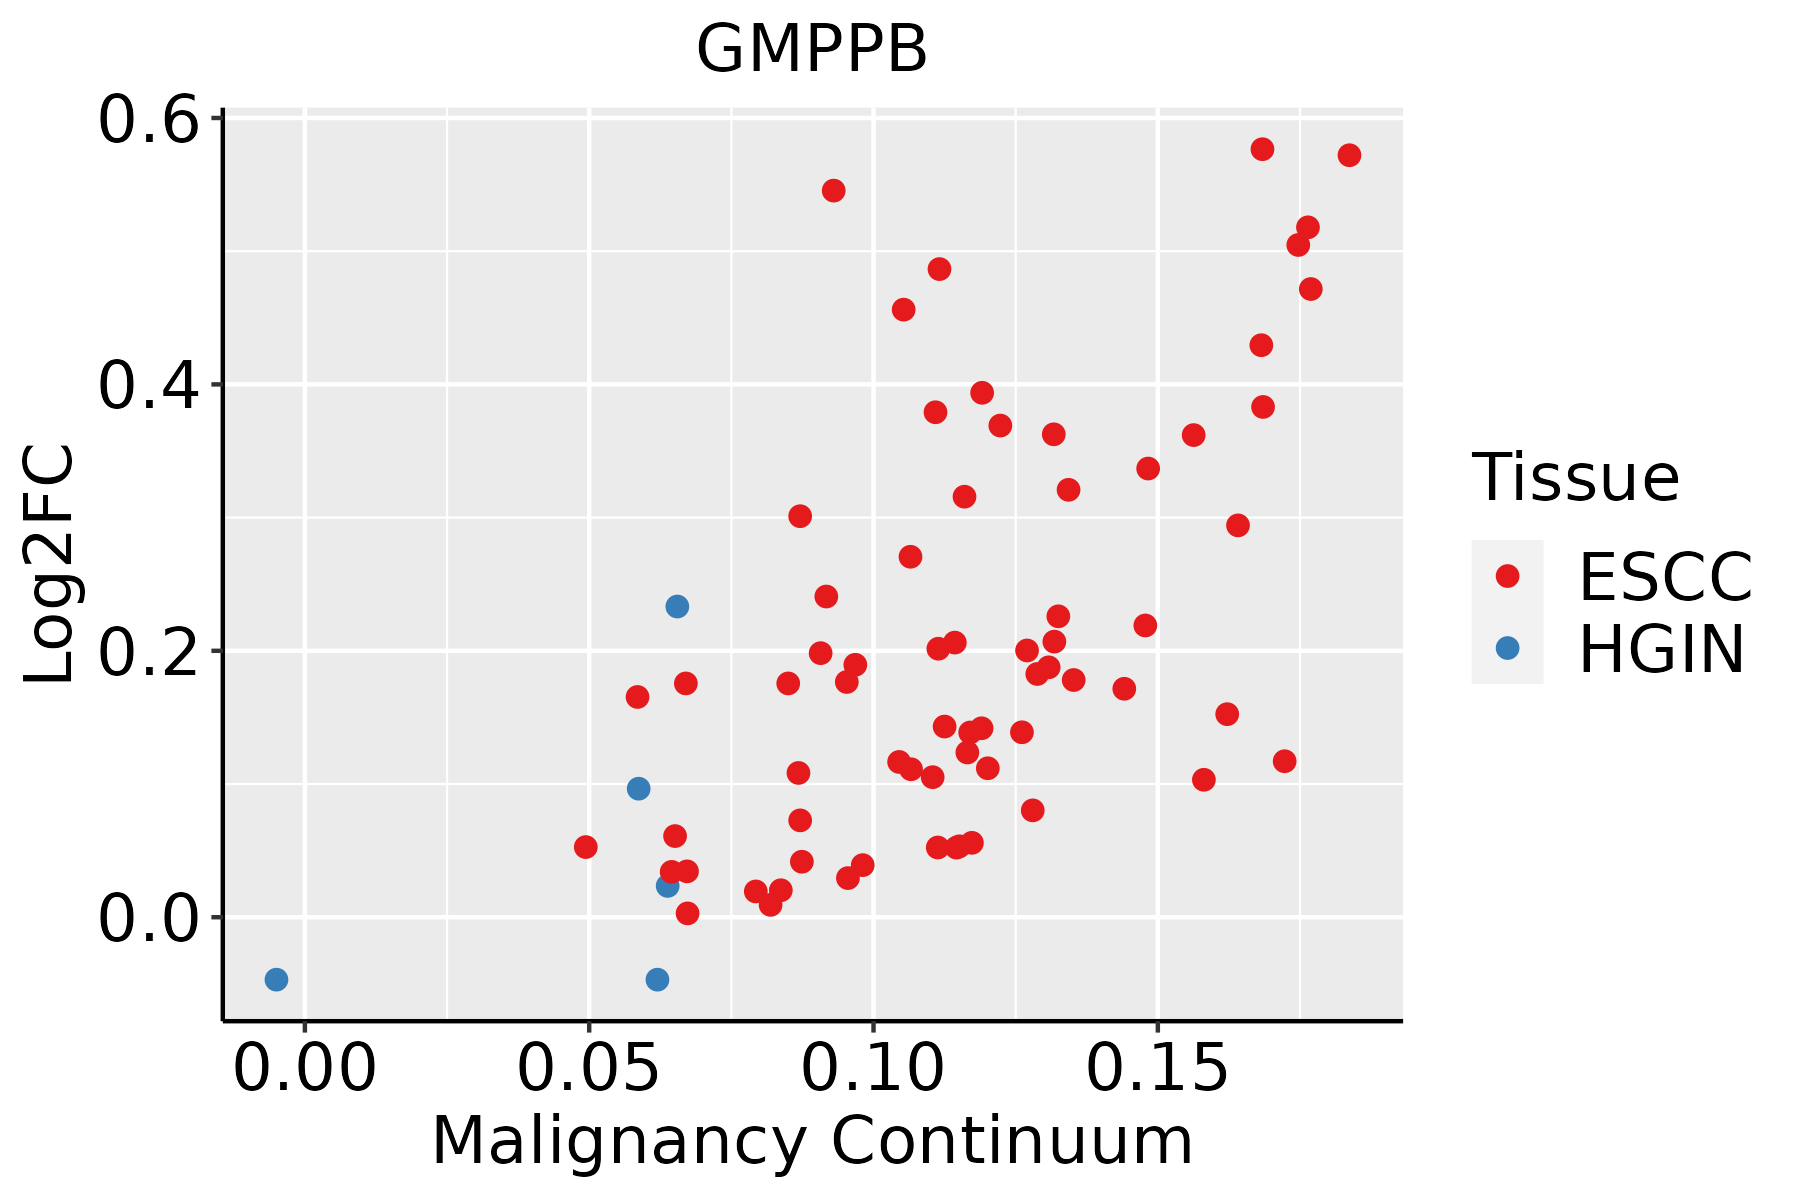 | ESCC: Esophageal squamous cell carcinoma |
| HGIN: High-grade intraepithelial neoplasias | ||
| LGIN: Low-grade intraepithelial neoplasias | ||
| Liver | 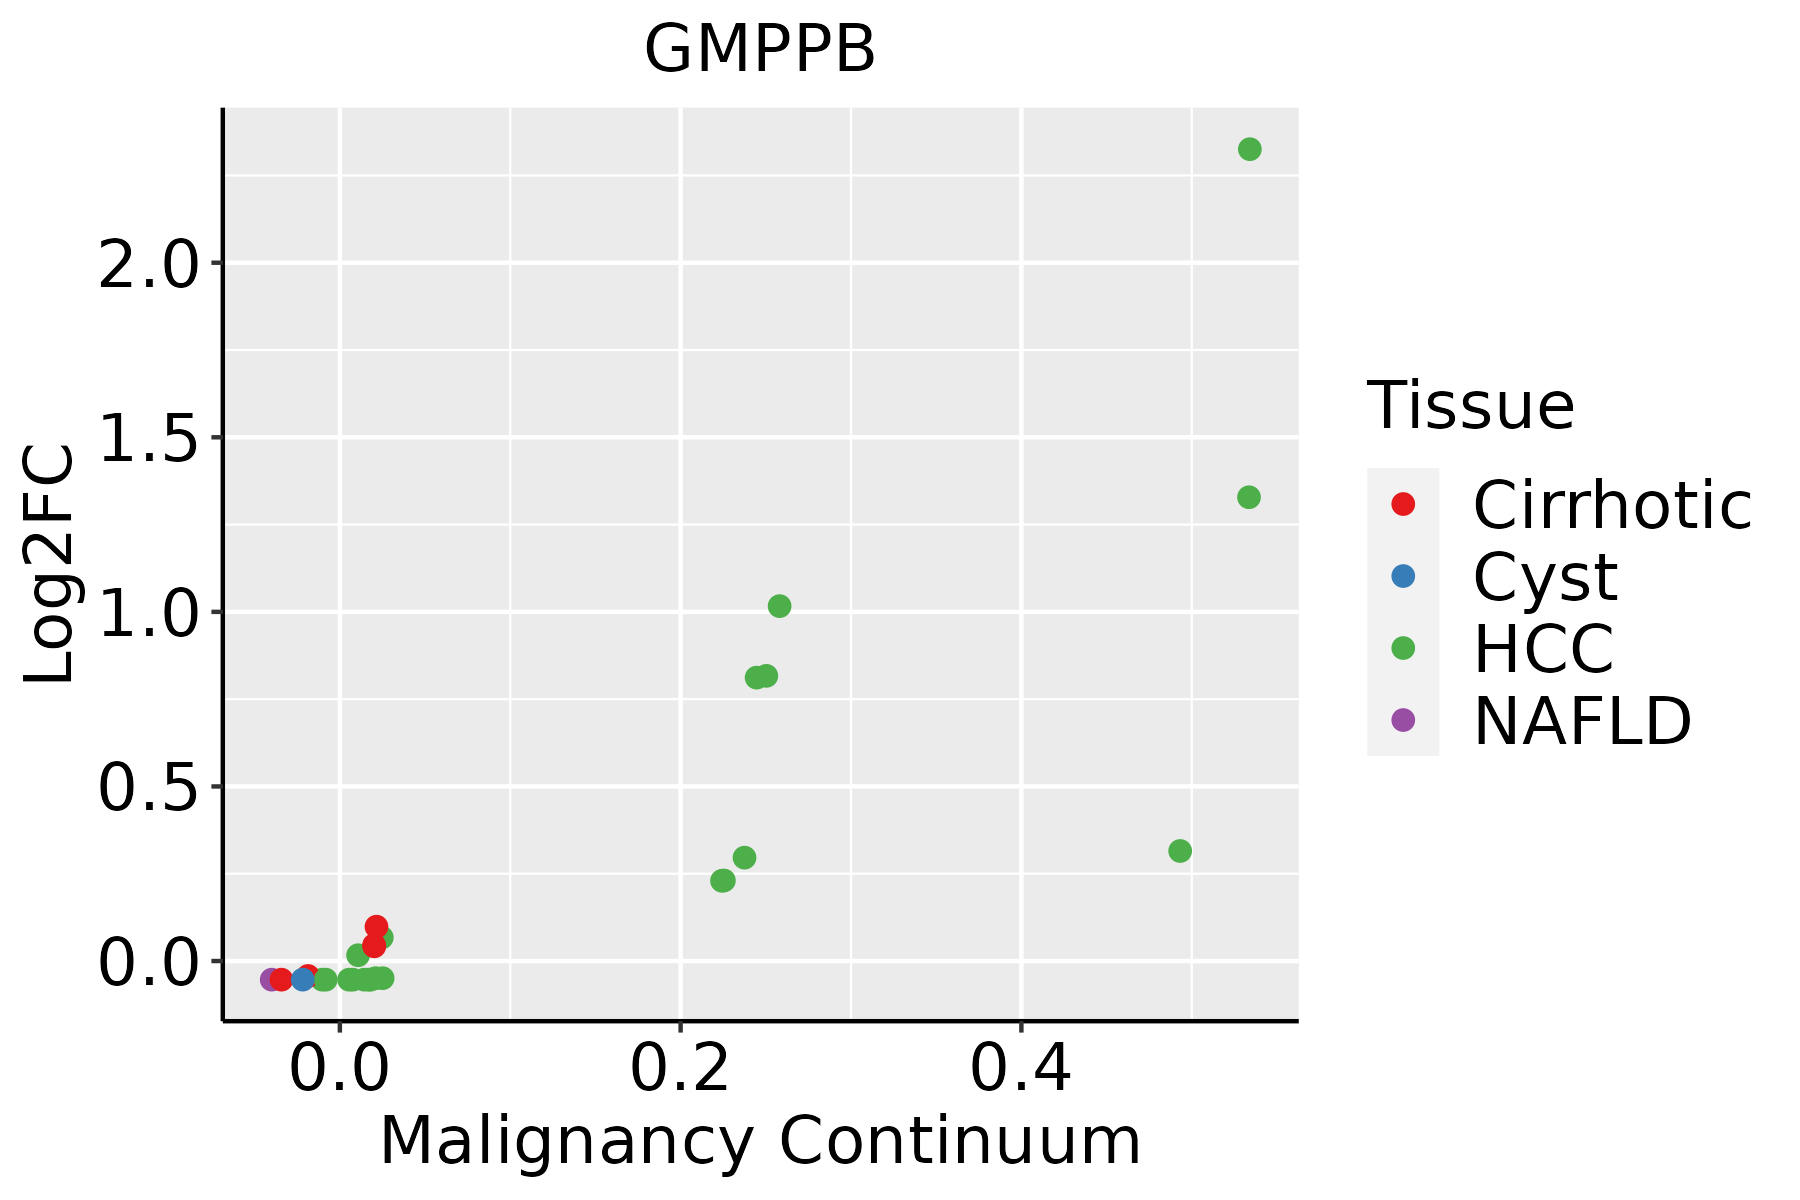 | HCC: Hepatocellular carcinoma |
| NAFLD: Non-alcoholic fatty liver disease | ||
| Oral Cavity | 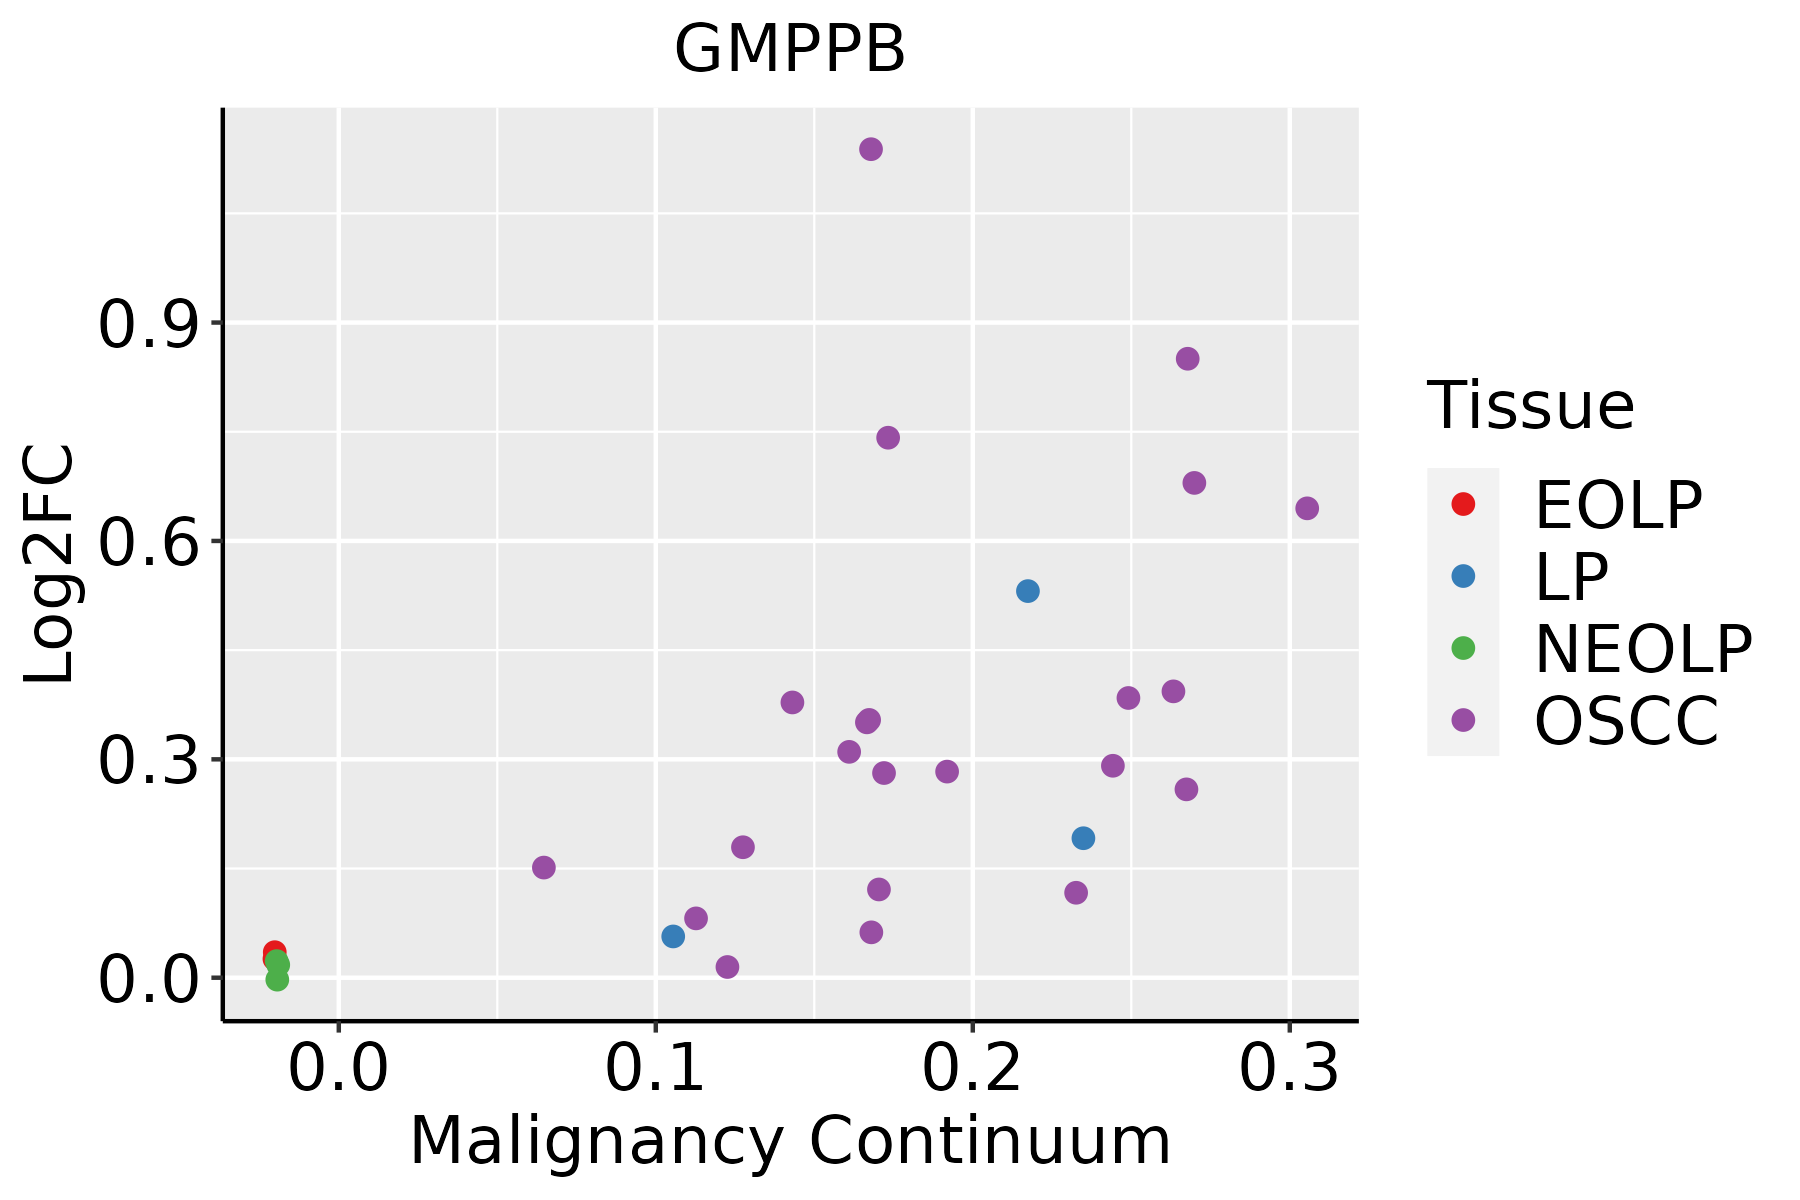 | EOLP: Erosive Oral lichen planus |
| LP: leukoplakia | ||
| NEOLP: Non-erosive oral lichen planus | ||
| OSCC: Oral squamous cell carcinoma |
| ∗log2FC in expression of this searched gene in stem-like cells from each diseased tissue sample relative to stem-like cells in normal samples in each tissue plotted against the malignancy continuum. Samples are colored based on if they are from different disease stage. |
Top |
Malignant transformation related pathway analysis |
| Find out the enriched GO biological processes and KEGG pathways involved in transition from healthy to precancer to cancer |
| Tissue | Disease Stage | Enriched GO biological Processes |
| Colorectum | AD |  |
| Colorectum | SER |  |
| Colorectum | MSS |  |
| Colorectum | MSI-H |  |
| Colorectum | FAP |  |
| ∗Top 15 enriched GO BP terms are showed in the bar plot of each disease state in each tissue. Each row represents a significant GO biological process which is colored according to the -log10(p.adjust). |
| Page: 1 2 3 4 5 6 7 8 9 |
| GO ID | Tissue | Disease Stage | Description | Gene Ratio | Bg Ratio | pvalue | p.adjust | Count |
| GO:00091002 | Esophagus | ESCC | glycoprotein metabolic process | 226/8552 | 387/18723 | 2.64e-07 | 3.94e-06 | 226 |
| GO:00700854 | Esophagus | ESCC | glycosylation | 144/8552 | 240/18723 | 5.12e-06 | 5.38e-05 | 144 |
| GO:00064865 | Esophagus | ESCC | protein glycosylation | 135/8552 | 226/18723 | 1.36e-05 | 1.24e-04 | 135 |
| GO:00434135 | Esophagus | ESCC | macromolecule glycosylation | 135/8552 | 226/18723 | 1.36e-05 | 1.24e-04 | 135 |
| GO:00092256 | Esophagus | ESCC | nucleotide-sugar metabolic process | 29/8552 | 36/18723 | 1.91e-05 | 1.67e-04 | 29 |
| GO:00091012 | Esophagus | ESCC | glycoprotein biosynthetic process | 181/8552 | 317/18723 | 2.54e-05 | 2.15e-04 | 181 |
| GO:00092262 | Esophagus | ESCC | nucleotide-sugar biosynthetic process | 14/8552 | 19/18723 | 1.27e-02 | 4.21e-02 | 14 |
| GO:00064862 | Liver | HCC | protein glycosylation | 122/7958 | 226/18723 | 3.11e-04 | 2.21e-03 | 122 |
| GO:00434132 | Liver | HCC | macromolecule glycosylation | 122/7958 | 226/18723 | 3.11e-04 | 2.21e-03 | 122 |
| GO:00700852 | Liver | HCC | glycosylation | 128/7958 | 240/18723 | 4.35e-04 | 2.92e-03 | 128 |
| GO:00092254 | Liver | HCC | nucleotide-sugar metabolic process | 25/7958 | 36/18723 | 9.87e-04 | 5.71e-03 | 25 |
| GO:0009100 | Liver | HCC | glycoprotein metabolic process | 193/7958 | 387/18723 | 1.89e-03 | 9.62e-03 | 193 |
| GO:00092255 | Oral cavity | OSCC | nucleotide-sugar metabolic process | 26/7305 | 36/18723 | 5.44e-05 | 4.51e-04 | 26 |
| GO:00091001 | Oral cavity | OSCC | glycoprotein metabolic process | 185/7305 | 387/18723 | 2.37e-04 | 1.54e-03 | 185 |
| GO:00091011 | Oral cavity | OSCC | glycoprotein biosynthetic process | 151/7305 | 317/18723 | 1.01e-03 | 5.26e-03 | 151 |
| GO:00064864 | Oral cavity | OSCC | protein glycosylation | 111/7305 | 226/18723 | 1.22e-03 | 6.10e-03 | 111 |
| GO:00434134 | Oral cavity | OSCC | macromolecule glycosylation | 111/7305 | 226/18723 | 1.22e-03 | 6.10e-03 | 111 |
| GO:00700853 | Oral cavity | OSCC | glycosylation | 117/7305 | 240/18723 | 1.29e-03 | 6.42e-03 | 117 |
| GO:00092261 | Oral cavity | OSCC | nucleotide-sugar biosynthetic process | 14/7305 | 19/18723 | 2.31e-03 | 1.02e-02 | 14 |
| Page: 1 |
| Pathway ID | Tissue | Disease Stage | Description | Gene Ratio | Bg Ratio | pvalue | p.adjust | qvalue | Count |
| hsa012405 | Esophagus | ESCC | Biosynthesis of cofactors | 97/4205 | 153/8465 | 3.88e-04 | 1.35e-03 | 6.94e-04 | 97 |
| hsa012505 | Esophagus | ESCC | Biosynthesis of nucleotide sugars | 28/4205 | 37/8465 | 1.10e-03 | 3.42e-03 | 1.75e-03 | 28 |
| hsa005202 | Esophagus | ESCC | Amino sugar and nucleotide sugar metabolism | 35/4205 | 49/8465 | 1.60e-03 | 4.88e-03 | 2.50e-03 | 35 |
| hsa000512 | Esophagus | ESCC | Fructose and mannose metabolism | 24/4205 | 34/8465 | 1.09e-02 | 2.51e-02 | 1.29e-02 | 24 |
| hsa0124012 | Esophagus | ESCC | Biosynthesis of cofactors | 97/4205 | 153/8465 | 3.88e-04 | 1.35e-03 | 6.94e-04 | 97 |
| hsa0125012 | Esophagus | ESCC | Biosynthesis of nucleotide sugars | 28/4205 | 37/8465 | 1.10e-03 | 3.42e-03 | 1.75e-03 | 28 |
| hsa0052011 | Esophagus | ESCC | Amino sugar and nucleotide sugar metabolism | 35/4205 | 49/8465 | 1.60e-03 | 4.88e-03 | 2.50e-03 | 35 |
| hsa0005111 | Esophagus | ESCC | Fructose and mannose metabolism | 24/4205 | 34/8465 | 1.09e-02 | 2.51e-02 | 1.29e-02 | 24 |
| hsa012402 | Liver | HCC | Biosynthesis of cofactors | 103/4020 | 153/8465 | 4.67e-07 | 5.05e-06 | 2.81e-06 | 103 |
| hsa012403 | Liver | HCC | Biosynthesis of cofactors | 103/4020 | 153/8465 | 4.67e-07 | 5.05e-06 | 2.81e-06 | 103 |
| hsa00520 | Oral cavity | OSCC | Amino sugar and nucleotide sugar metabolism | 34/3704 | 49/8465 | 2.48e-04 | 8.08e-04 | 4.11e-04 | 34 |
| hsa012404 | Oral cavity | OSCC | Biosynthesis of cofactors | 88/3704 | 153/8465 | 3.84e-04 | 1.20e-03 | 6.12e-04 | 88 |
| hsa012504 | Oral cavity | OSCC | Biosynthesis of nucleotide sugars | 25/3704 | 37/8465 | 2.93e-03 | 7.49e-03 | 3.81e-03 | 25 |
| hsa005201 | Oral cavity | OSCC | Amino sugar and nucleotide sugar metabolism | 34/3704 | 49/8465 | 2.48e-04 | 8.08e-04 | 4.11e-04 | 34 |
| hsa0124011 | Oral cavity | OSCC | Biosynthesis of cofactors | 88/3704 | 153/8465 | 3.84e-04 | 1.20e-03 | 6.12e-04 | 88 |
| hsa0125011 | Oral cavity | OSCC | Biosynthesis of nucleotide sugars | 25/3704 | 37/8465 | 2.93e-03 | 7.49e-03 | 3.81e-03 | 25 |
| Page: 1 |
Top |
Cell-cell communication analysis |
| Identification of potential cell-cell interactions between two cell types and their ligand-receptor pairs for different disease states |
| Ligand | Receptor | LRpair | Pathway | Tissue | Disease Stage |
| Page: 1 |
Top |
Single-cell gene regulatory network inference analysis |
| Find out the significant the regulons (TFs) and the target genes of each regulon across cell types for different disease states |
| TF | Cell Type | Tissue | Disease Stage | Target Gene | RSS | Regulon Activity |
| ∗The dot plots of a searched regulon are shown for all cell subpopulations in each disease state of each tissue based on the regulon specific score inferred using pySCENIC and by calculating the average expression. |
| Page: 1 |
Top |
Somatic mutation of malignant transformation related genes |
| Annotation of somatic variants for genes involved in malignant transformation |
| Hugo Symbol | Variant Class | Variant Classification | dbSNP RS | HGVSc | HGVSp | HGVSp Short | SWISSPROT | BIOTYPE | SIFT | PolyPhen | Tumor Sample Barcode | Tissue | Histology | Sex | Age | Stage | Therapy Types | Drugs | Outcome |
| GMPPB | SNV | Missense_Mutation | c.1117N>G | p.His373Asp | p.H373D | Q9Y5P6 | protein_coding | deleterious(0) | benign(0.144) | TCGA-D8-A1XM-01 | Breast | breast invasive carcinoma | Female | <65 | I/II | Unknown | Unknown | SD | |
| GMPPB | SNV | Missense_Mutation | novel | c.751N>A | p.Val251Met | p.V251M | Q9Y5P6 | protein_coding | tolerated(0.12) | benign(0.06) | TCGA-C5-A7X5-01 | Cervix | cervical & endocervical cancer | Female | >=65 | I/II | Chemotherapy | carboplatin | PD |
| GMPPB | SNV | Missense_Mutation | novel | c.221N>A | p.Arg74Gln | p.R74Q | Q9Y5P6 | protein_coding | tolerated(0.1) | benign(0.015) | TCGA-C5-A7X5-01 | Cervix | cervical & endocervical cancer | Female | >=65 | I/II | Chemotherapy | carboplatin | PD |
| GMPPB | SNV | Missense_Mutation | rs144421130 | c.937N>T | p.Arg313Cys | p.R313C | Q9Y5P6 | protein_coding | tolerated(0.09) | benign(0.013) | TCGA-A6-4107-01 | Colorectum | colon adenocarcinoma | Female | <65 | III/IV | Chemotherapy | 5 | SD |
| GMPPB | SNV | Missense_Mutation | novel | c.1139N>G | p.Val380Gly | p.V380G | Q9Y5P6 | protein_coding | deleterious(0.01) | possibly_damaging(0.676) | TCGA-AA-3666-01 | Colorectum | colon adenocarcinoma | Male | >=65 | III/IV | Unknown | Unknown | PD |
| GMPPB | SNV | Missense_Mutation | c.266N>A | p.Pro89His | p.P89H | Q9Y5P6 | protein_coding | deleterious(0) | probably_damaging(0.981) | TCGA-AD-5900-01 | Colorectum | colon adenocarcinoma | Male | >=65 | I/II | Unknown | Unknown | SD | |
| GMPPB | SNV | Missense_Mutation | novel | c.612N>T | p.Glu204Asp | p.E204D | Q9Y5P6 | protein_coding | tolerated(1) | benign(0.007) | TCGA-A5-A1OF-01 | Endometrium | uterine corpus endometrioid carcinoma | Female | <65 | I/II | Unknown | Unknown | SD |
| GMPPB | SNV | Missense_Mutation | c.517G>A | p.Ala173Thr | p.A173T | Q9Y5P6 | protein_coding | deleterious(0) | benign(0.393) | TCGA-AX-A0J1-01 | Endometrium | uterine corpus endometrioid carcinoma | Female | >=65 | I/II | Unknown | Unknown | SD | |
| GMPPB | SNV | Missense_Mutation | novel | c.1082N>C | p.Asp361Ala | p.D361A | Q9Y5P6 | protein_coding | deleterious(0) | probably_damaging(0.947) | TCGA-B5-A1MR-01 | Endometrium | uterine corpus endometrioid carcinoma | Female | >=65 | III/IV | Unknown | Unknown | SD |
| GMPPB | SNV | Missense_Mutation | novel | c.346C>A | p.Pro116Thr | p.P116T | Q9Y5P6 | protein_coding | deleterious(0.02) | possibly_damaging(0.864) | TCGA-B5-A1MX-01 | Endometrium | uterine corpus endometrioid carcinoma | Female | <65 | I/II | Hormone Therapy | megace | SD |
| Page: 1 2 3 |
Top |
Related drugs of malignant transformation related genes |
| Identification of chemicals and drugs interact with genes involved in malignant transfromation |
| (DGIdb 4.0) |
| Entrez ID | Symbol | Category | Interaction Types | Drug Claim Name | Drug Name | PMIDs |
| Page: 1 |

Copyright 2023-Present -The University of Texas Health Science Center at Houston |