
|
|||||
|
 | |
| |
| |
| |
| |
| |
|
Gene: GMNN |
Gene summary for GMNN |
| Gene information | Species | Human | Gene symbol | GMNN | Gene ID | 51053 |
| Gene name | geminin DNA replication inhibitor | |
| Gene Alias | Gem | |
| Cytomap | 6p22.3 | |
| Gene Type | protein-coding | GO ID | GO:0006139 | UniProtAcc | A0A024QZY7 |
Top |
Malignant transformation analysis |
| Identification of the aberrant gene expression in precancerous and cancerous lesions by comparing the gene expression of stem-like cells in diseased tissues with normal stem cells |
| Entrez ID | Symbol | Replicates | Species | Organ | Tissue | Adj P-value | Log2FC | Malignancy |
| 51053 | GMNN | LZE4T | Human | Esophagus | ESCC | 2.85e-09 | 4.73e-01 | 0.0811 |
| 51053 | GMNN | LZE5T | Human | Esophagus | ESCC | 2.01e-03 | 6.18e-01 | 0.0514 |
| 51053 | GMNN | LZE7T | Human | Esophagus | ESCC | 3.29e-12 | 5.99e-01 | 0.0667 |
| 51053 | GMNN | LZE8T | Human | Esophagus | ESCC | 1.46e-04 | 2.83e-01 | 0.067 |
| 51053 | GMNN | LZE24T | Human | Esophagus | ESCC | 3.10e-08 | 3.09e-01 | 0.0596 |
| 51053 | GMNN | LZE6T | Human | Esophagus | ESCC | 2.75e-10 | 4.44e-01 | 0.0845 |
| 51053 | GMNN | P2T-E | Human | Esophagus | ESCC | 2.83e-38 | 1.10e+00 | 0.1177 |
| 51053 | GMNN | P4T-E | Human | Esophagus | ESCC | 2.84e-37 | 1.01e+00 | 0.1323 |
| 51053 | GMNN | P5T-E | Human | Esophagus | ESCC | 1.02e-15 | 4.59e-01 | 0.1327 |
| 51053 | GMNN | P8T-E | Human | Esophagus | ESCC | 1.12e-38 | 1.03e+00 | 0.0889 |
| 51053 | GMNN | P9T-E | Human | Esophagus | ESCC | 3.32e-14 | 3.79e-01 | 0.1131 |
| 51053 | GMNN | P10T-E | Human | Esophagus | ESCC | 6.24e-07 | 3.23e-01 | 0.116 |
| 51053 | GMNN | P11T-E | Human | Esophagus | ESCC | 1.36e-10 | 4.32e-01 | 0.1426 |
| 51053 | GMNN | P12T-E | Human | Esophagus | ESCC | 3.65e-11 | 3.30e-01 | 0.1122 |
| 51053 | GMNN | P15T-E | Human | Esophagus | ESCC | 6.60e-12 | 3.07e-01 | 0.1149 |
| 51053 | GMNN | P16T-E | Human | Esophagus | ESCC | 1.12e-11 | 3.85e-01 | 0.1153 |
| 51053 | GMNN | P17T-E | Human | Esophagus | ESCC | 2.05e-10 | 7.03e-01 | 0.1278 |
| 51053 | GMNN | P19T-E | Human | Esophagus | ESCC | 4.61e-08 | 1.02e+00 | 0.1662 |
| 51053 | GMNN | P20T-E | Human | Esophagus | ESCC | 9.74e-14 | 3.67e-01 | 0.1124 |
| 51053 | GMNN | P21T-E | Human | Esophagus | ESCC | 6.03e-21 | 6.08e-01 | 0.1617 |
| Page: 1 2 3 4 5 6 |
| Tissue | Expression Dynamics | Abbreviation |
| Esophagus |  | ESCC: Esophageal squamous cell carcinoma |
| HGIN: High-grade intraepithelial neoplasias | ||
| LGIN: Low-grade intraepithelial neoplasias | ||
| Liver |  | HCC: Hepatocellular carcinoma |
| NAFLD: Non-alcoholic fatty liver disease | ||
| Oral Cavity | 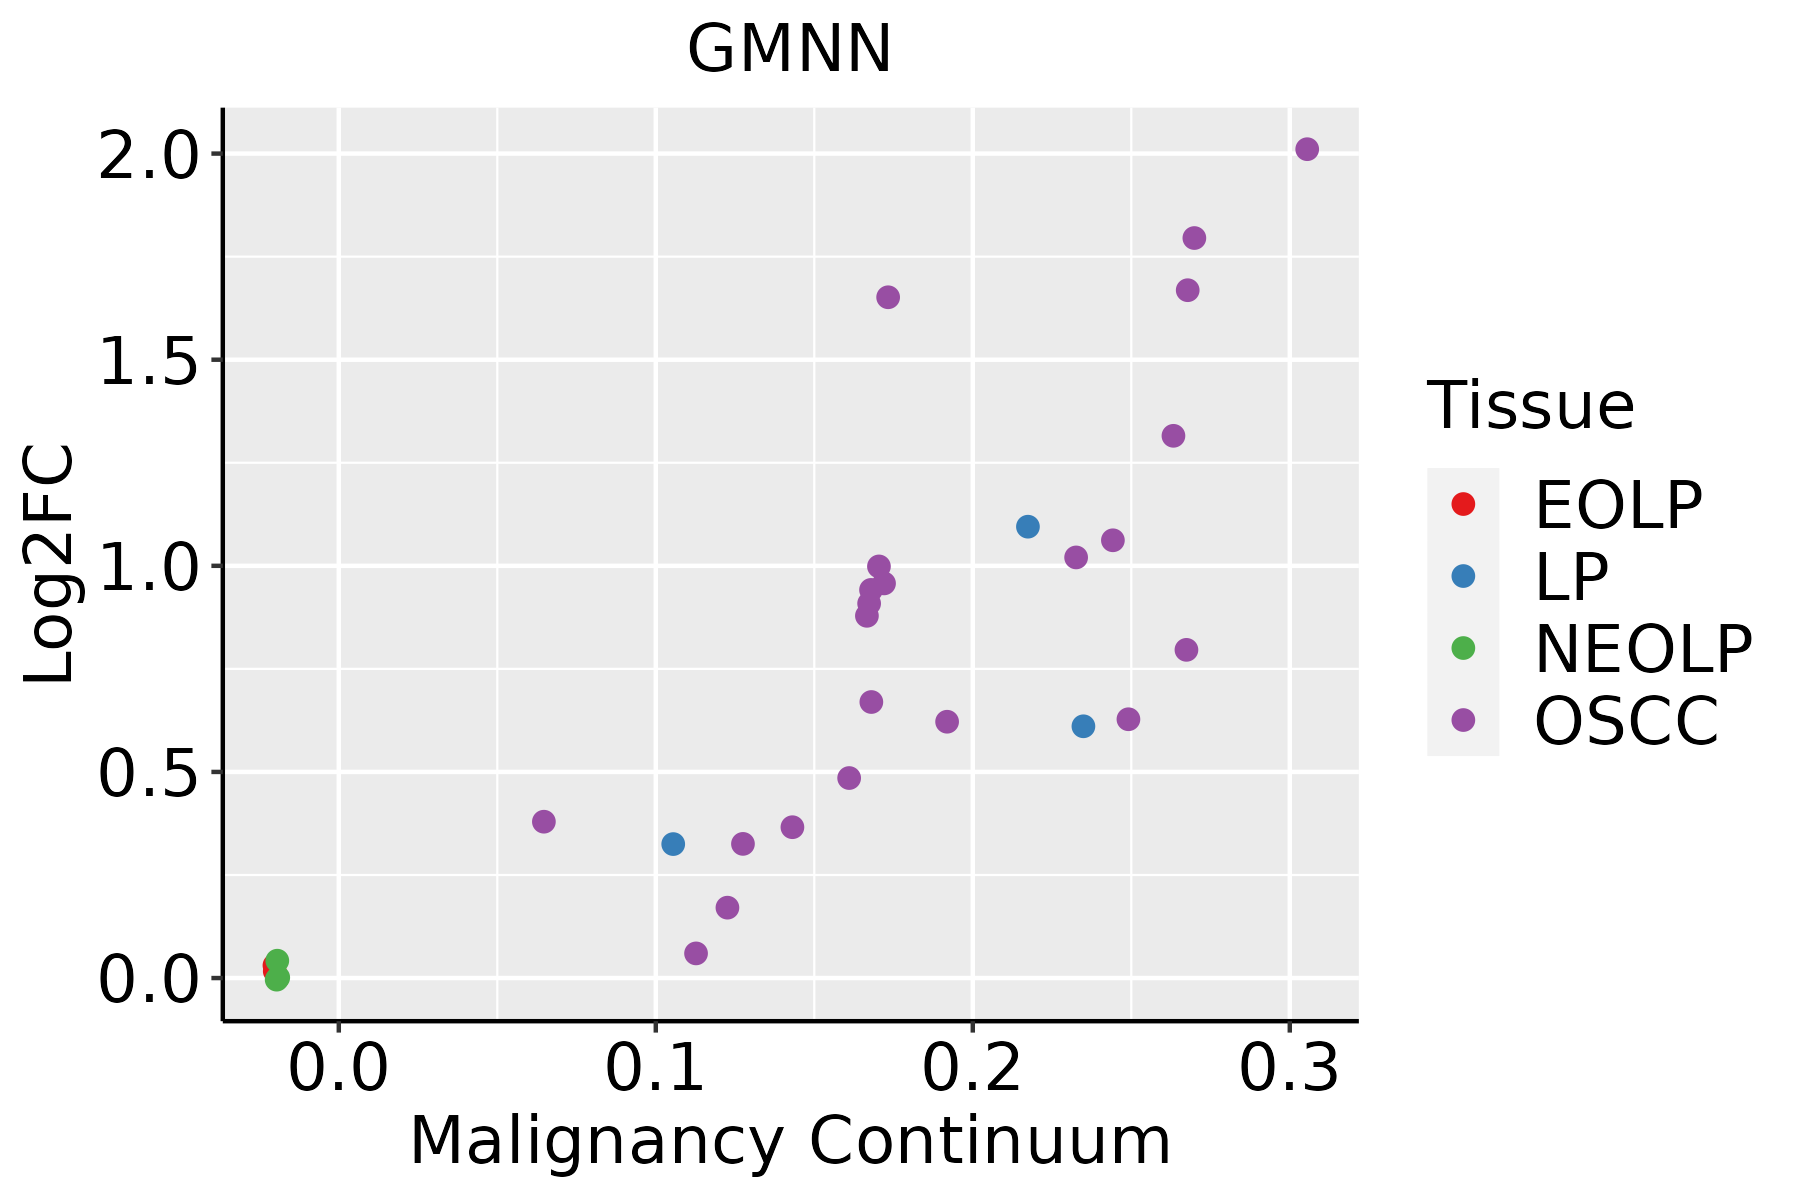 | EOLP: Erosive Oral lichen planus |
| LP: leukoplakia | ||
| NEOLP: Non-erosive oral lichen planus | ||
| OSCC: Oral squamous cell carcinoma | ||
| Skin | 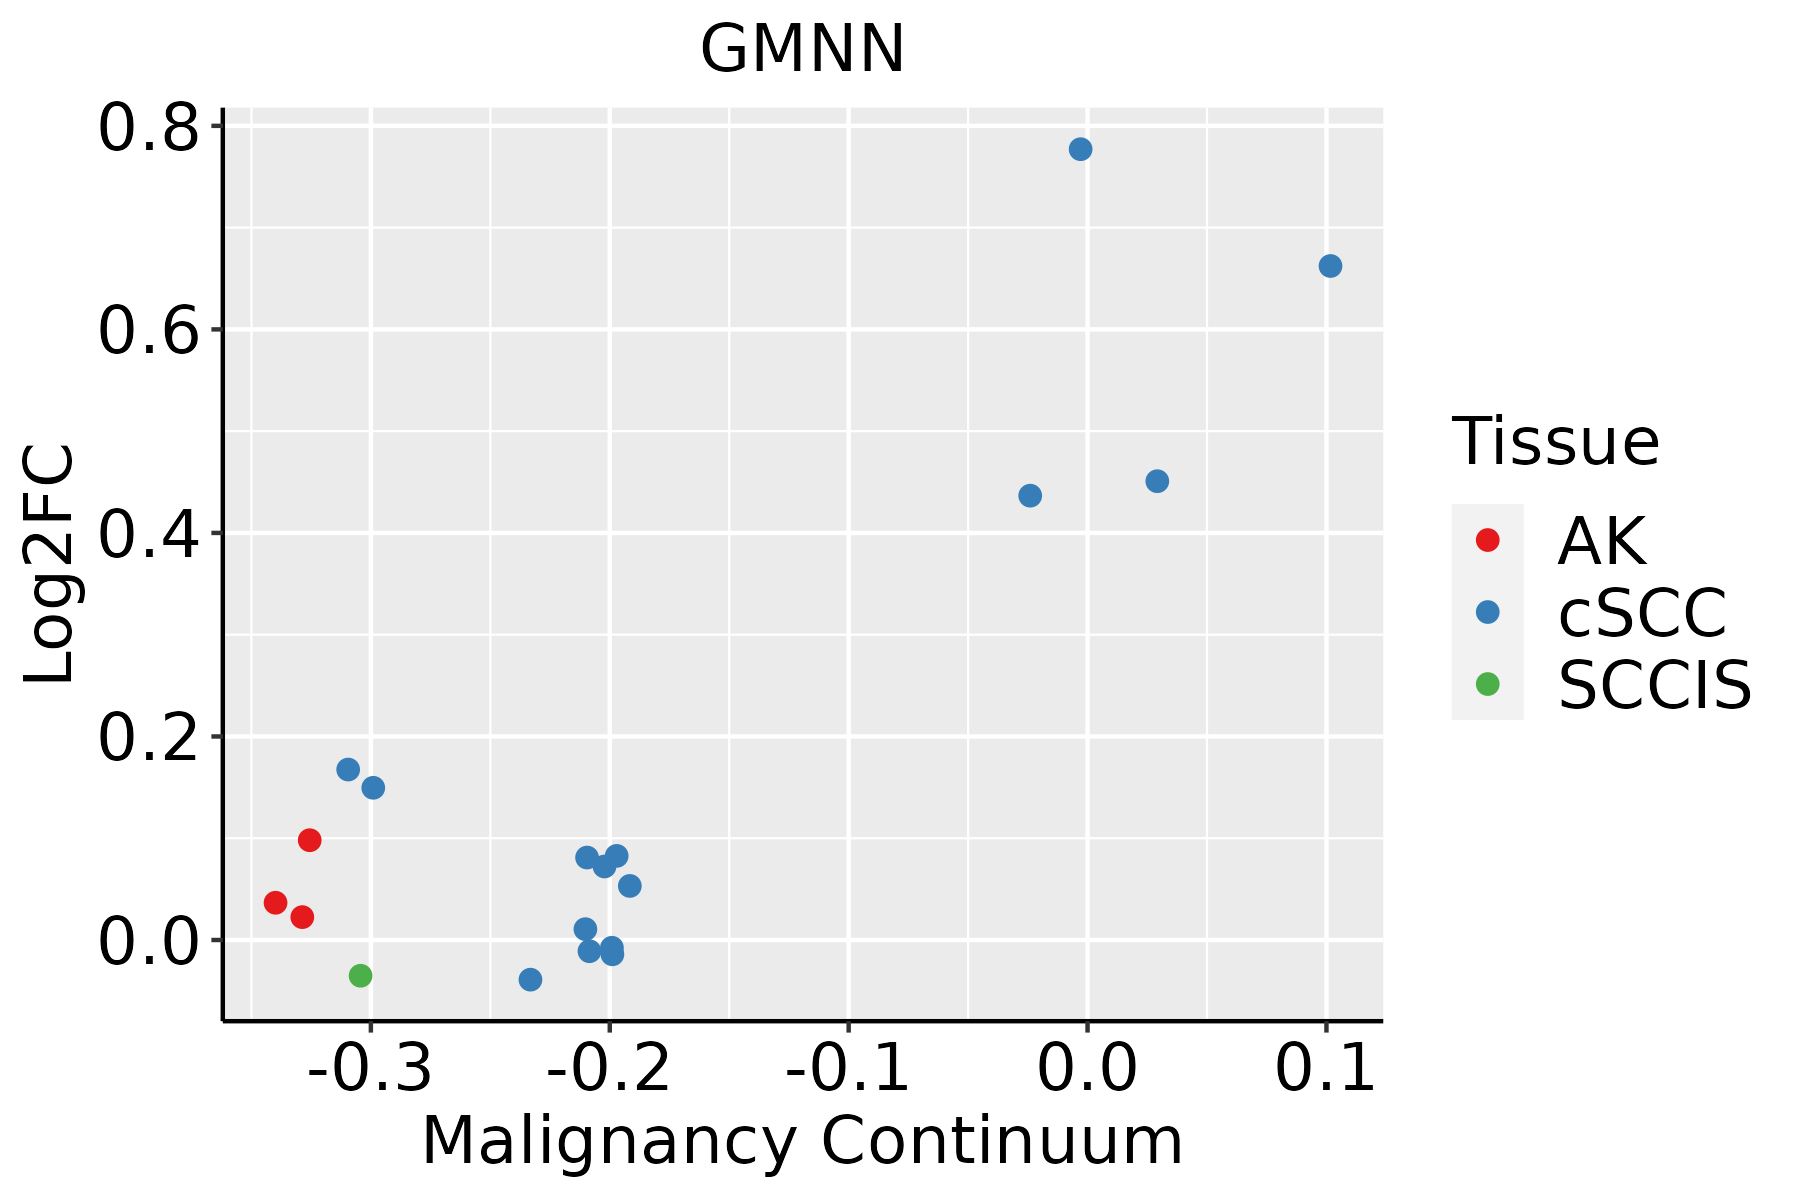 | AK: Actinic keratosis |
| cSCC: Cutaneous squamous cell carcinoma | ||
| SCCIS:squamous cell carcinoma in situ |
| ∗log2FC in expression of this searched gene in stem-like cells from each diseased tissue sample relative to stem-like cells in normal samples in each tissue plotted against the malignancy continuum. Samples are colored based on if they are from different disease stage. |
Top |
Malignant transformation related pathway analysis |
| Find out the enriched GO biological processes and KEGG pathways involved in transition from healthy to precancer to cancer |
| Tissue | Disease Stage | Enriched GO biological Processes |
| Colorectum | AD |  |
| Colorectum | SER |  |
| Colorectum | MSS |  |
| Colorectum | MSI-H |  |
| Colorectum | FAP |  |
| ∗Top 15 enriched GO BP terms are showed in the bar plot of each disease state in each tissue. Each row represents a significant GO biological process which is colored according to the -log10(p.adjust). |
| Page: 1 2 3 4 5 6 7 8 9 |
| GO ID | Tissue | Disease Stage | Description | Gene Ratio | Bg Ratio | pvalue | p.adjust | Count |
| GO:0051098111 | Esophagus | ESCC | regulation of binding | 251/8552 | 363/18723 | 6.73e-20 | 8.46e-18 | 251 |
| GO:00062604 | Esophagus | ESCC | DNA replication | 181/8552 | 260/18723 | 3.55e-15 | 2.05e-13 | 181 |
| GO:0051099111 | Esophagus | ESCC | positive regulation of binding | 122/8552 | 173/18723 | 2.79e-11 | 9.45e-10 | 122 |
| GO:00457865 | Esophagus | ESCC | negative regulation of cell cycle | 236/8552 | 385/18723 | 3.62e-10 | 9.93e-09 | 236 |
| GO:00062612 | Esophagus | ESCC | DNA-dependent DNA replication | 100/8552 | 151/18723 | 2.61e-07 | 3.94e-06 | 100 |
| GO:00062754 | Esophagus | ESCC | regulation of DNA replication | 73/8552 | 107/18723 | 1.97e-06 | 2.28e-05 | 73 |
| GO:0090329 | Esophagus | ESCC | regulation of DNA-dependent DNA replication | 30/8552 | 46/18723 | 5.91e-03 | 2.18e-02 | 30 |
| GO:0035563 | Esophagus | ESCC | positive regulation of chromatin binding | 11/8552 | 14/18723 | 1.30e-02 | 4.27e-02 | 11 |
| GO:005109812 | Liver | Cirrhotic | regulation of binding | 148/4634 | 363/18723 | 9.14e-12 | 5.97e-10 | 148 |
| GO:005109912 | Liver | Cirrhotic | positive regulation of binding | 74/4634 | 173/18723 | 1.44e-07 | 3.87e-06 | 74 |
| GO:005109822 | Liver | HCC | regulation of binding | 225/7958 | 363/18723 | 3.78e-14 | 2.37e-12 | 225 |
| GO:005109922 | Liver | HCC | positive regulation of binding | 108/7958 | 173/18723 | 9.22e-08 | 1.83e-06 | 108 |
| GO:00062601 | Liver | HCC | DNA replication | 146/7958 | 260/18723 | 5.68e-06 | 7.02e-05 | 146 |
| GO:0045786 | Liver | HCC | negative regulation of cell cycle | 204/7958 | 385/18723 | 1.84e-05 | 1.99e-04 | 204 |
| GO:00062751 | Liver | HCC | regulation of DNA replication | 60/7958 | 107/18723 | 3.15e-03 | 1.46e-02 | 60 |
| GO:0006261 | Liver | HCC | DNA-dependent DNA replication | 80/7958 | 151/18723 | 5.91e-03 | 2.44e-02 | 80 |
| GO:005109820 | Oral cavity | OSCC | regulation of binding | 212/7305 | 363/18723 | 3.88e-14 | 2.15e-12 | 212 |
| GO:00062603 | Oral cavity | OSCC | DNA replication | 159/7305 | 260/18723 | 3.25e-13 | 1.59e-11 | 159 |
| GO:00457864 | Oral cavity | OSCC | negative regulation of cell cycle | 206/7305 | 385/18723 | 4.28e-09 | 9.55e-08 | 206 |
| GO:005109920 | Oral cavity | OSCC | positive regulation of binding | 105/7305 | 173/18723 | 5.88e-09 | 1.26e-07 | 105 |
| Page: 1 2 |
| Pathway ID | Tissue | Disease Stage | Description | Gene Ratio | Bg Ratio | pvalue | p.adjust | qvalue | Count |
| Page: 1 |
Top |
Cell-cell communication analysis |
| Identification of potential cell-cell interactions between two cell types and their ligand-receptor pairs for different disease states |
| Ligand | Receptor | LRpair | Pathway | Tissue | Disease Stage |
| Page: 1 |
Top |
Single-cell gene regulatory network inference analysis |
| Find out the significant the regulons (TFs) and the target genes of each regulon across cell types for different disease states |
| TF | Cell Type | Tissue | Disease Stage | Target Gene | RSS | Regulon Activity |
| ∗The dot plots of a searched regulon are shown for all cell subpopulations in each disease state of each tissue based on the regulon specific score inferred using pySCENIC and by calculating the average expression. |
| Page: 1 |
Top |
Somatic mutation of malignant transformation related genes |
| Annotation of somatic variants for genes involved in malignant transformation |
| Hugo Symbol | Variant Class | Variant Classification | dbSNP RS | HGVSc | HGVSp | HGVSp Short | SWISSPROT | BIOTYPE | SIFT | PolyPhen | Tumor Sample Barcode | Tissue | Histology | Sex | Age | Stage | Therapy Types | Drugs | Outcome |
| GMNN | SNV | Missense_Mutation | c.352G>C | p.Glu118Gln | p.E118Q | O75496 | protein_coding | deleterious(0) | probably_damaging(0.999) | TCGA-D8-A1JA-01 | Breast | breast invasive carcinoma | Female | <65 | III/IV | Chemotherapy | adriamycin | PD | |
| GMNN | deletion | Frame_Shift_Del | c.567_568delNN | p.Glu190AsnfsTer6 | p.E190Nfs*6 | O75496 | protein_coding | TCGA-C8-A26Y-01 | Breast | breast invasive carcinoma | Female | >=65 | I/II | Unknown | Unknown | SD | |||
| GMNN | deletion | Frame_Shift_Del | novel | c.359delN | p.His121IlefsTer14 | p.H121Ifs*14 | O75496 | protein_coding | TCGA-D8-A27V-01 | Breast | breast invasive carcinoma | Female | <65 | I/II | Hormone Therapy | tamoxiphen | SD | ||
| GMNN | SNV | Missense_Mutation | novel | c.161G>A | p.Arg54Gln | p.R54Q | O75496 | protein_coding | tolerated(0.1) | benign(0.171) | TCGA-2W-A8YY-01 | Cervix | cervical & endocervical cancer | Female | <65 | I/II | Chemotherapy | cisplatin | CR |
| GMNN | SNV | Missense_Mutation | novel | c.527N>T | p.Ser176Phe | p.S176F | O75496 | protein_coding | tolerated(0.24) | benign(0.054) | TCGA-DS-A1OB-01 | Cervix | cervical & endocervical cancer | Female | <65 | I/II | Chemotherapy | carboplatin | PD |
| GMNN | SNV | Missense_Mutation | c.42N>T | p.Glu14Asp | p.E14D | O75496 | protein_coding | tolerated(0.23) | benign(0.187) | TCGA-FU-A3HZ-01 | Cervix | cervical & endocervical cancer | Female | <65 | I/II | Chemotherapy | cisplatin | CR | |
| GMNN | SNV | Missense_Mutation | c.179C>G | p.Ser60Cys | p.S60C | O75496 | protein_coding | deleterious(0) | possibly_damaging(0.866) | TCGA-JX-A3Q0-01 | Cervix | cervical & endocervical cancer | Female | <65 | III/IV | Unknown | Unknown | SD | |
| GMNN | SNV | Missense_Mutation | novel | c.192C>A | p.Ser64Arg | p.S64R | O75496 | protein_coding | tolerated(0.29) | benign(0.012) | TCGA-VS-A9UR-01 | Cervix | cervical & endocervical cancer | Female | <65 | I/II | Chemotherapy | cisplatin | PD |
| GMNN | SNV | Missense_Mutation | rs757212388 | c.326N>T | p.Ala109Val | p.A109V | O75496 | protein_coding | deleterious(0.02) | benign(0.302) | TCGA-5B-A90C-01 | Endometrium | uterine corpus endometrioid carcinoma | Female | >=65 | I/II | Chemotherapy | carboplatin | SD |
| GMNN | SNV | Missense_Mutation | novel | c.161N>A | p.Arg54Gln | p.R54Q | O75496 | protein_coding | tolerated(0.1) | benign(0.171) | TCGA-A5-A0G2-01 | Endometrium | uterine corpus endometrioid carcinoma | Female | <65 | III/IV | Unknown | Unknown | SD |
| Page: 1 2 3 |
Top |
Related drugs of malignant transformation related genes |
| Identification of chemicals and drugs interact with genes involved in malignant transfromation |
| (DGIdb 4.0) |
| Entrez ID | Symbol | Category | Interaction Types | Drug Claim Name | Drug Name | PMIDs |
| 51053 | GMNN | DRUGGABLE GENOME | IDAZOXAN | IDAZOXAN | ||
| 51053 | GMNN | DRUGGABLE GENOME | DNDI1417601 | CHEMBL1503729 | ||
| 51053 | GMNN | DRUGGABLE GENOME | GNF-PF-3438 | CHEMBL582276 | ||
| 51053 | GMNN | DRUGGABLE GENOME | SJ000293754 | CHEMBL486706 | ||
| 51053 | GMNN | DRUGGABLE GENOME | CINACALCET | CINACALCET | ||
| 51053 | GMNN | DRUGGABLE GENOME | OUABAIN | OUABAIN | ||
| 51053 | GMNN | DRUGGABLE GENOME | DNDI1417973 | CHEMBL1572415 | ||
| 51053 | GMNN | DRUGGABLE GENOME | NISOLDIPINE | NISOLDIPINE | ||
| 51053 | GMNN | DRUGGABLE GENOME | MITONAFIDE | MITONAFIDE | ||
| 51053 | GMNN | DRUGGABLE GENOME | BROQUINALDOL | BROQUINALDOL |
| Page: 1 2 3 4 5 6 7 8 9 10 11 12 13 14 15 16 17 18 19 20 21 22 23 24 25 26 27 28 29 30 31 32 33 34 35 36 37 38 39 40 41 42 43 44 45 46 47 48 49 |

Copyright 2023-Present -The University of Texas Health Science Center at Houston |