
|
|||||
|
 | |
| |
| |
| |
| |
| |
|
Gene: GMFG |
Gene summary for GMFG |
| Gene information | Species | Human | Gene symbol | GMFG | Gene ID | 9535 |
| Gene name | glia maturation factor gamma | |
| Gene Alias | GMF-GAMMA | |
| Cytomap | 19q13.2 | |
| Gene Type | protein-coding | GO ID | GO:0006464 | UniProtAcc | M0R1D2 |
Top |
Malignant transformation analysis |
| Identification of the aberrant gene expression in precancerous and cancerous lesions by comparing the gene expression of stem-like cells in diseased tissues with normal stem cells |
| Entrez ID | Symbol | Replicates | Species | Organ | Tissue | Adj P-value | Log2FC | Malignancy |
| 9535 | GMFG | CCI_1 | Human | Cervix | CC | 6.18e-06 | -6.00e-01 | 0.528 |
| 9535 | GMFG | CCI_2 | Human | Cervix | CC | 3.92e-03 | -5.78e-01 | 0.5249 |
| 9535 | GMFG | CCI_3 | Human | Cervix | CC | 5.91e-05 | -5.69e-01 | 0.516 |
| 9535 | GMFG | CCII_1 | Human | Cervix | CC | 1.66e-09 | -5.89e-01 | 0.3249 |
| 9535 | GMFG | Tumor | Human | Cervix | CC | 5.12e-33 | -5.98e-01 | 0.1241 |
| 9535 | GMFG | sample1 | Human | Cervix | CC | 7.42e-10 | -6.00e-01 | 0.0959 |
| 9535 | GMFG | sample3 | Human | Cervix | CC | 1.24e-26 | -5.93e-01 | 0.1387 |
| 9535 | GMFG | H2 | Human | Cervix | HSIL_HPV | 1.65e-26 | -5.67e-01 | 0.0632 |
| 9535 | GMFG | L1 | Human | Cervix | CC | 1.13e-04 | -4.87e-01 | 0.0802 |
| 9535 | GMFG | T1 | Human | Cervix | CC | 8.21e-16 | -5.66e-01 | 0.0918 |
| 9535 | GMFG | T2 | Human | Cervix | CC | 5.62e-05 | -6.00e-01 | 0.0709 |
| 9535 | GMFG | T3 | Human | Cervix | CC | 9.42e-28 | -5.91e-01 | 0.1389 |
| 9535 | GMFG | LZE7T | Human | Esophagus | ESCC | 1.27e-06 | 6.03e-01 | 0.0667 |
| 9535 | GMFG | LZE6T | Human | Esophagus | ESCC | 3.80e-09 | 5.58e-01 | 0.0845 |
| 9535 | GMFG | C21 | Human | Oral cavity | OSCC | 3.42e-16 | 6.45e-01 | 0.2678 |
| 9535 | GMFG | C30 | Human | Oral cavity | OSCC | 7.77e-04 | 2.30e-01 | 0.3055 |
| 9535 | GMFG | C38 | Human | Oral cavity | OSCC | 1.77e-07 | 8.74e-01 | 0.172 |
| 9535 | GMFG | C06 | Human | Oral cavity | OSCC | 2.17e-04 | 7.87e-01 | 0.2699 |
| 9535 | GMFG | LN22 | Human | Oral cavity | OSCC | 1.99e-02 | 7.99e-01 | 0.1733 |
| 9535 | GMFG | EOLP-1 | Human | Oral cavity | EOLP | 5.84e-10 | 3.47e-01 | -0.0202 |
| Page: 1 2 |
| Tissue | Expression Dynamics | Abbreviation |
| Cervix | 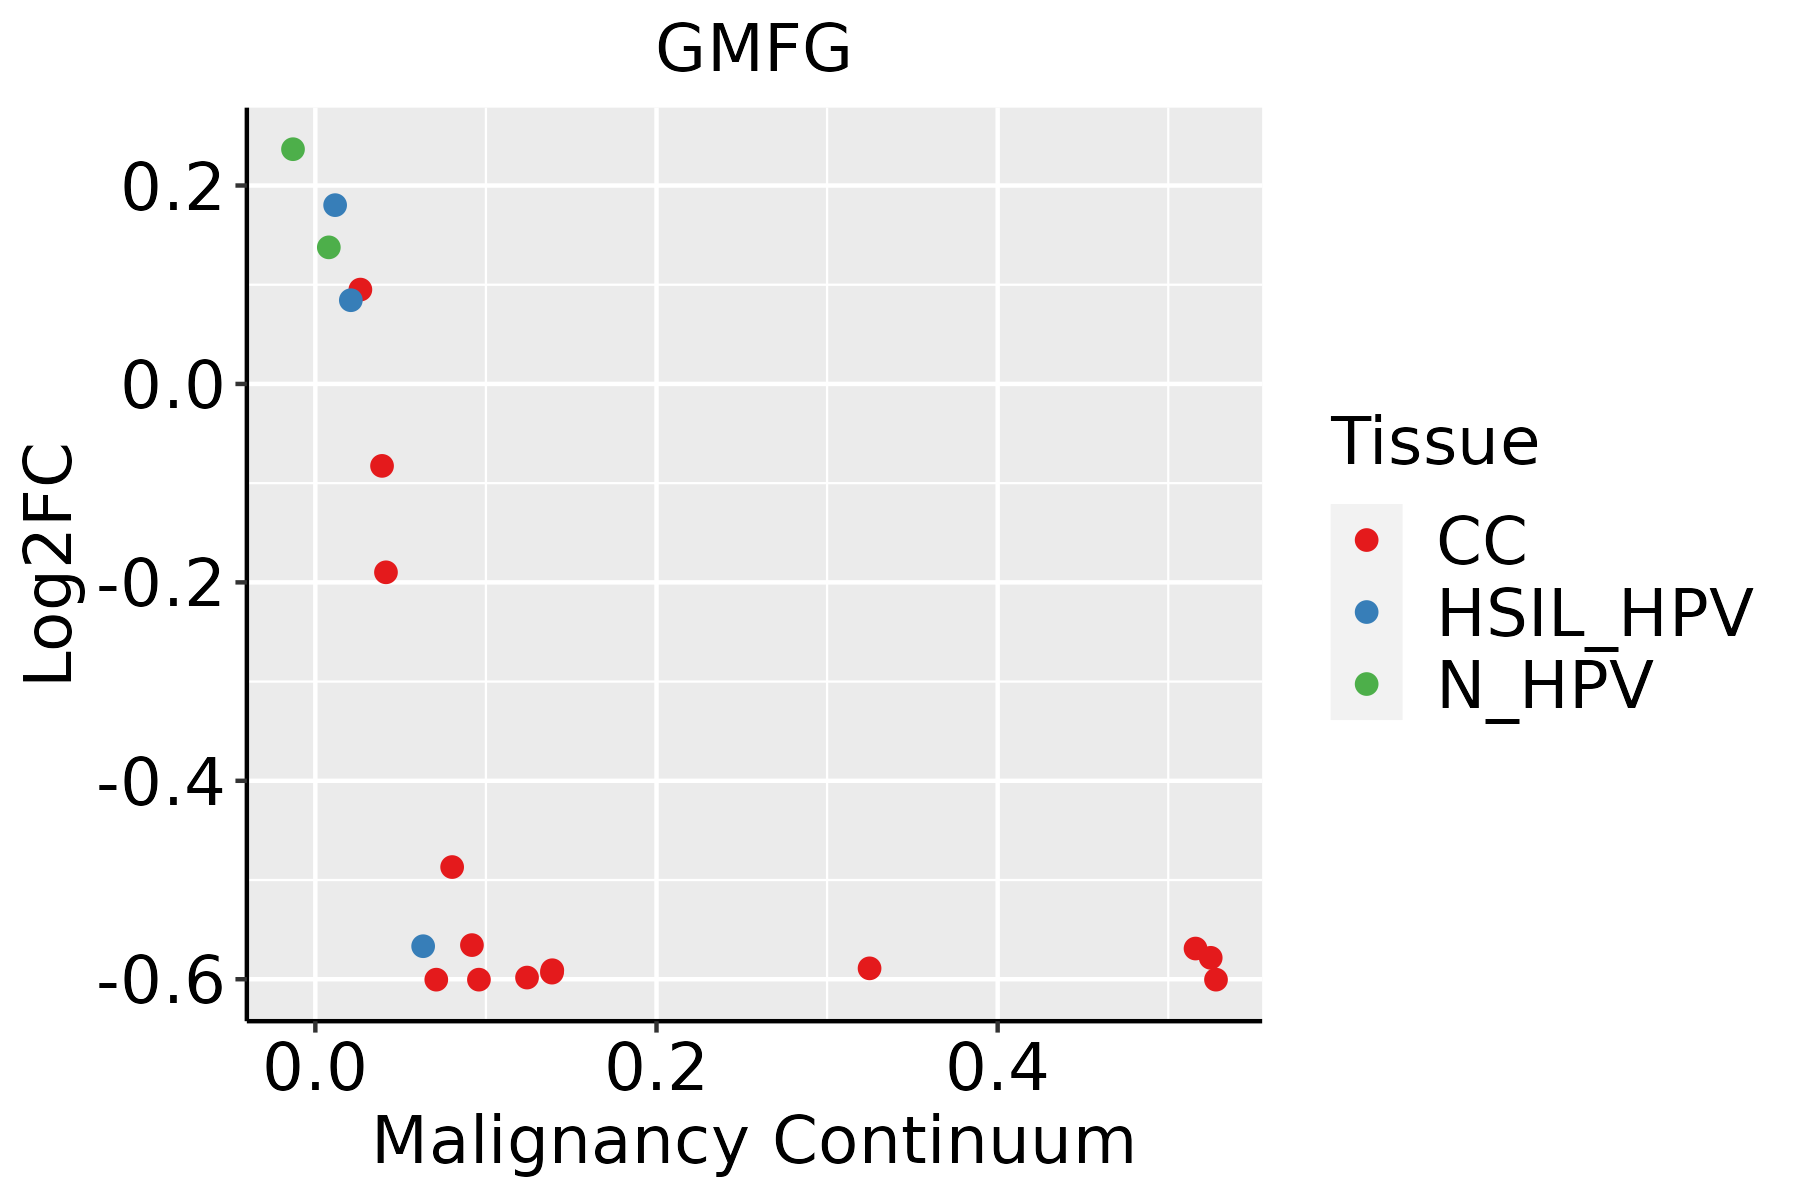 | CC: Cervix cancer |
| HSIL_HPV: HPV-infected high-grade squamous intraepithelial lesions | ||
| N_HPV: HPV-infected normal cervix | ||
| Esophagus | 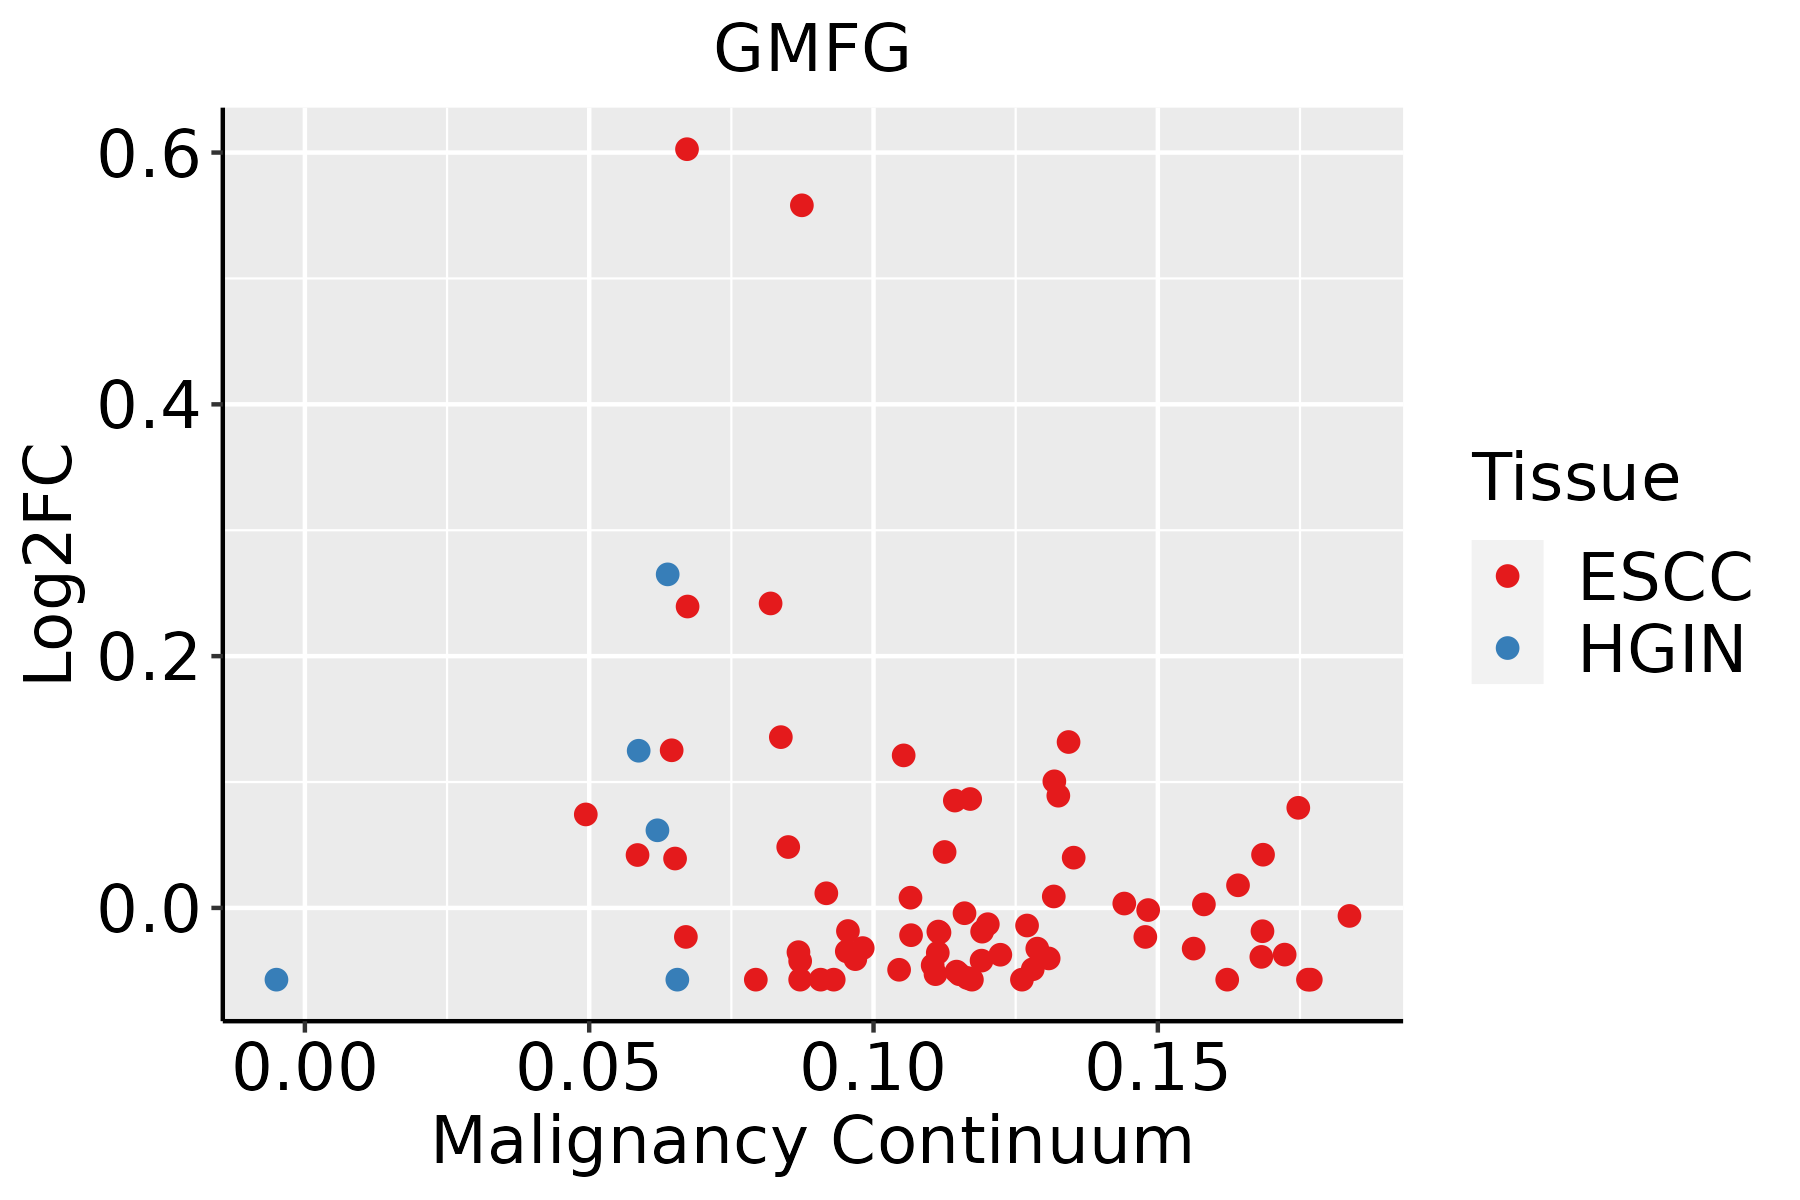 | ESCC: Esophageal squamous cell carcinoma |
| HGIN: High-grade intraepithelial neoplasias | ||
| LGIN: Low-grade intraepithelial neoplasias | ||
| Oral Cavity | 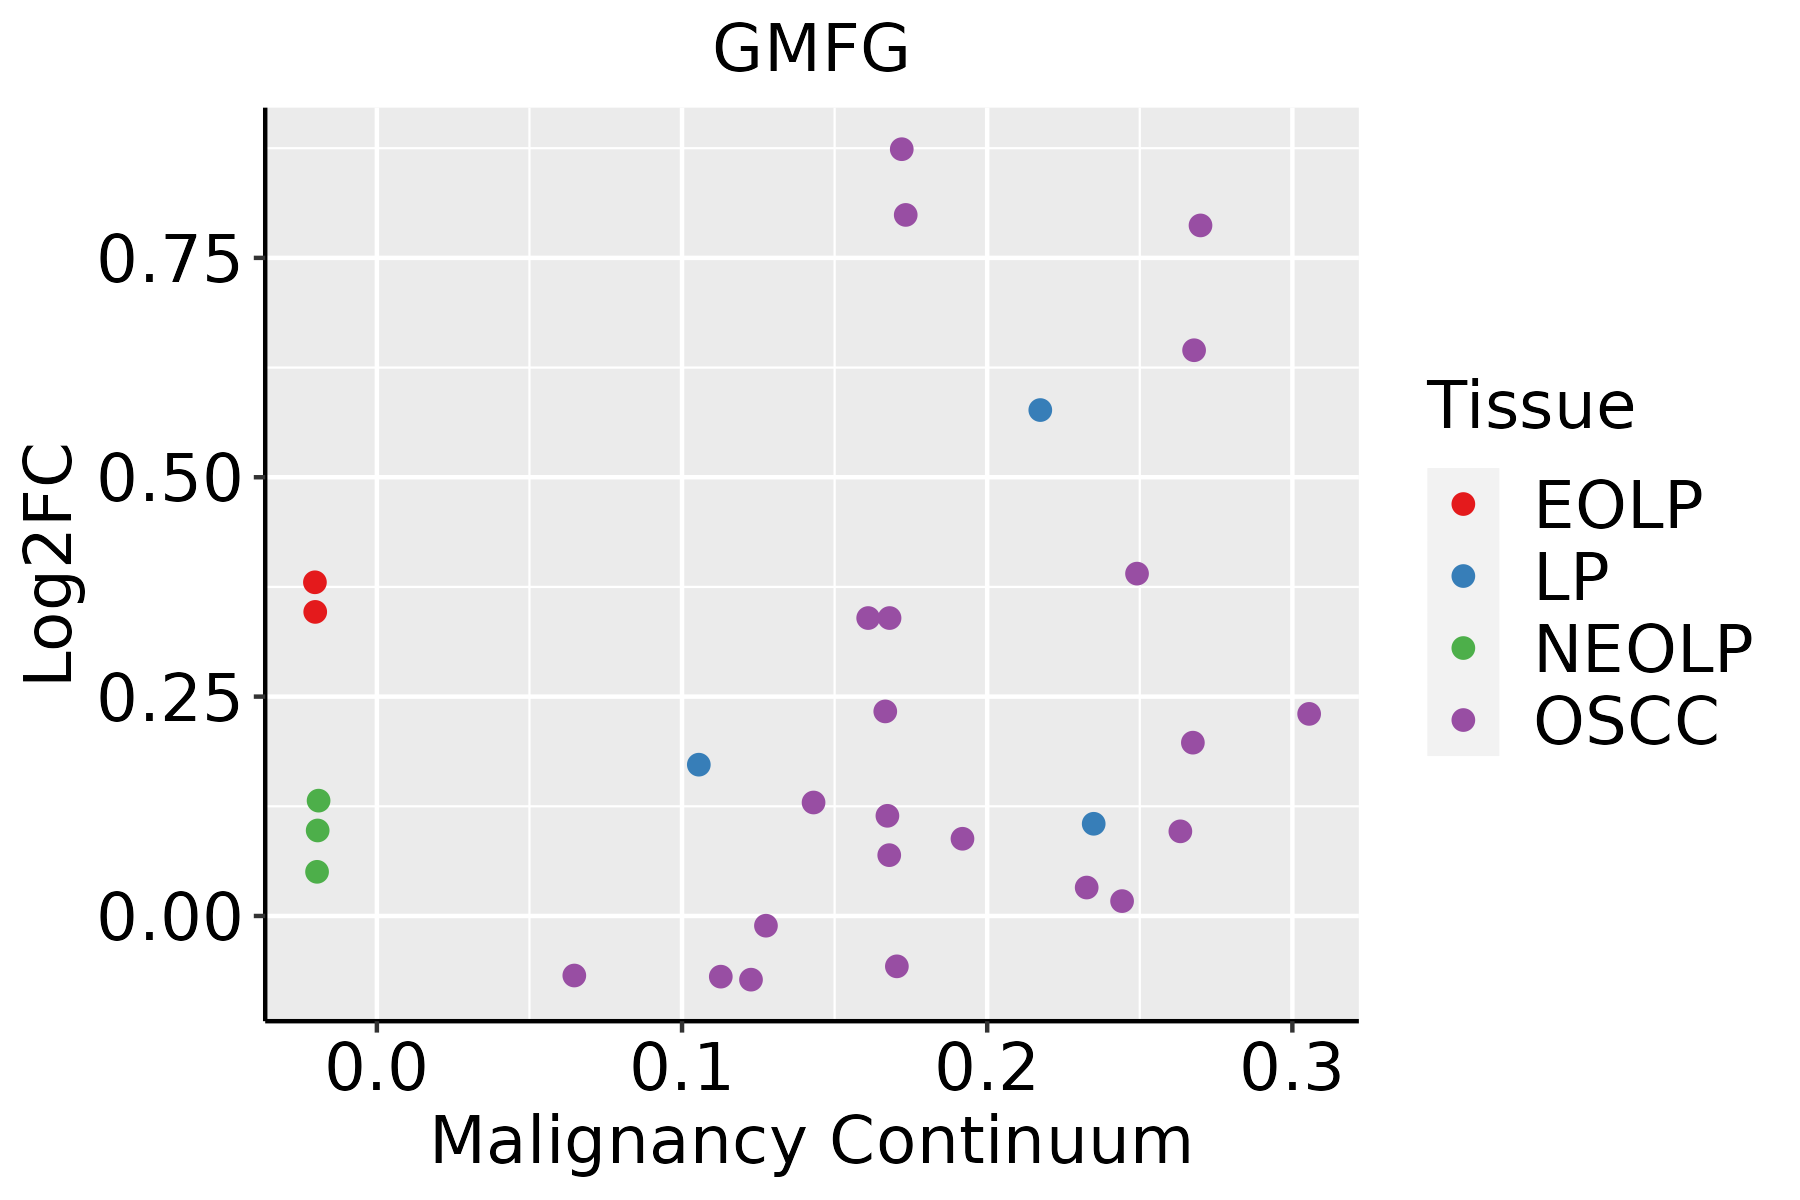 | EOLP: Erosive Oral lichen planus |
| LP: leukoplakia | ||
| NEOLP: Non-erosive oral lichen planus | ||
| OSCC: Oral squamous cell carcinoma |
| ∗log2FC in expression of this searched gene in stem-like cells from each diseased tissue sample relative to stem-like cells in normal samples in each tissue plotted against the malignancy continuum. Samples are colored based on if they are from different disease stage. |
Top |
Malignant transformation related pathway analysis |
| Find out the enriched GO biological processes and KEGG pathways involved in transition from healthy to precancer to cancer |
| Tissue | Disease Stage | Enriched GO biological Processes |
| Colorectum | AD |  |
| Colorectum | SER |  |
| Colorectum | MSS |  |
| Colorectum | MSI-H |  |
| Colorectum | FAP |  |
| ∗Top 15 enriched GO BP terms are showed in the bar plot of each disease state in each tissue. Each row represents a significant GO biological process which is colored according to the -log10(p.adjust). |
| Page: 1 2 3 4 5 6 7 8 9 |
| GO ID | Tissue | Disease Stage | Description | Gene Ratio | Bg Ratio | pvalue | p.adjust | Count |
| GO:000701510 | Cervix | CC | actin filament organization | 109/2311 | 442/18723 | 4.92e-13 | 2.45e-10 | 109 |
| GO:003297010 | Cervix | CC | regulation of actin filament-based process | 96/2311 | 397/18723 | 4.00e-11 | 8.54e-09 | 96 |
| GO:190290310 | Cervix | CC | regulation of supramolecular fiber organization | 92/2311 | 383/18723 | 1.49e-10 | 2.48e-08 | 92 |
| GO:003295610 | Cervix | CC | regulation of actin cytoskeleton organization | 86/2311 | 358/18723 | 5.90e-10 | 7.51e-08 | 86 |
| GO:004325410 | Cervix | CC | regulation of protein-containing complex assembly | 96/2311 | 428/18723 | 2.91e-09 | 3.05e-07 | 96 |
| GO:011005310 | Cervix | CC | regulation of actin filament organization | 67/2311 | 278/18723 | 4.01e-08 | 2.54e-06 | 67 |
| GO:005125810 | Cervix | CC | protein polymerization | 70/2311 | 297/18723 | 5.20e-08 | 3.11e-06 | 70 |
| GO:003227110 | Cervix | CC | regulation of protein polymerization | 57/2311 | 233/18723 | 2.37e-07 | 1.03e-05 | 57 |
| GO:003133410 | Cervix | CC | positive regulation of protein-containing complex assembly | 55/2311 | 237/18723 | 2.25e-06 | 6.73e-05 | 55 |
| GO:190290510 | Cervix | CC | positive regulation of supramolecular fiber organization | 50/2311 | 209/18723 | 2.55e-06 | 7.54e-05 | 50 |
| GO:00315328 | Cervix | CC | actin cytoskeleton reorganization | 31/2311 | 107/18723 | 3.34e-06 | 8.99e-05 | 31 |
| GO:00081549 | Cervix | CC | actin polymerization or depolymerization | 51/2311 | 218/18723 | 4.05e-06 | 1.05e-04 | 51 |
| GO:00300419 | Cervix | CC | actin filament polymerization | 45/2311 | 191/18723 | 1.20e-05 | 2.54e-04 | 45 |
| GO:00325359 | Cervix | CC | regulation of cellular component size | 76/2311 | 383/18723 | 1.66e-05 | 3.21e-04 | 76 |
| GO:19029048 | Cervix | CC | negative regulation of supramolecular fiber organization | 40/2311 | 167/18723 | 2.39e-05 | 4.17e-04 | 40 |
| GO:005149510 | Cervix | CC | positive regulation of cytoskeleton organization | 50/2311 | 226/18723 | 2.53e-05 | 4.29e-04 | 50 |
| GO:00308339 | Cervix | CC | regulation of actin filament polymerization | 40/2311 | 172/18723 | 4.90e-05 | 7.40e-04 | 40 |
| GO:00106399 | Cervix | CC | negative regulation of organelle organization | 68/2311 | 348/18723 | 7.40e-05 | 1.03e-03 | 68 |
| GO:00080649 | Cervix | CC | regulation of actin polymerization or depolymerization | 42/2311 | 188/18723 | 8.60e-05 | 1.15e-03 | 42 |
| GO:00308328 | Cervix | CC | regulation of actin filament length | 42/2311 | 189/18723 | 9.76e-05 | 1.27e-03 | 42 |
| Page: 1 2 3 4 5 6 7 |
| Pathway ID | Tissue | Disease Stage | Description | Gene Ratio | Bg Ratio | pvalue | p.adjust | qvalue | Count |
| Page: 1 |
Top |
Cell-cell communication analysis |
| Identification of potential cell-cell interactions between two cell types and their ligand-receptor pairs for different disease states |
| Ligand | Receptor | LRpair | Pathway | Tissue | Disease Stage |
| Page: 1 |
Top |
Single-cell gene regulatory network inference analysis |
| Find out the significant the regulons (TFs) and the target genes of each regulon across cell types for different disease states |
| TF | Cell Type | Tissue | Disease Stage | Target Gene | RSS | Regulon Activity |
| ∗The dot plots of a searched regulon are shown for all cell subpopulations in each disease state of each tissue based on the regulon specific score inferred using pySCENIC and by calculating the average expression. |
| Page: 1 |
Top |
Somatic mutation of malignant transformation related genes |
| Annotation of somatic variants for genes involved in malignant transformation |
| Hugo Symbol | Variant Class | Variant Classification | dbSNP RS | HGVSc | HGVSp | HGVSp Short | SWISSPROT | BIOTYPE | SIFT | PolyPhen | Tumor Sample Barcode | Tissue | Histology | Sex | Age | Stage | Therapy Types | Drugs | Outcome |
| GMFG | SNV | Missense_Mutation | c.37N>C | p.Glu13Gln | p.E13Q | O60234 | protein_coding | deleterious(0.04) | benign(0.079) | TCGA-B6-A0I2-01 | Breast | breast invasive carcinoma | Female | <65 | I/II | Unknown | Unknown | SD | |
| GMFG | SNV | Missense_Mutation | novel | c.311A>G | p.Tyr104Cys | p.Y104C | O60234 | protein_coding | deleterious(0.02) | probably_damaging(0.999) | TCGA-EA-A3HU-01 | Cervix | cervical & endocervical cancer | Female | <65 | I/II | Unknown | Unknown | SD |
| GMFG | SNV | Missense_Mutation | rs779145008 | c.242N>A | p.Arg81Gln | p.R81Q | O60234 | protein_coding | deleterious(0) | probably_damaging(0.929) | TCGA-EK-A2IP-01 | Cervix | cervical & endocervical cancer | Female | <65 | I/II | Unknown | Unknown | SD |
| GMFG | SNV | Missense_Mutation | c.91G>A | p.Ala31Thr | p.A31T | O60234 | protein_coding | deleterious(0) | probably_damaging(0.981) | TCGA-AA-3833-01 | Colorectum | colon adenocarcinoma | Female | <65 | I/II | Unknown | Unknown | SD | |
| GMFG | SNV | Missense_Mutation | c.195G>T | p.Gln65His | p.Q65H | O60234 | protein_coding | deleterious(0.01) | benign(0) | TCGA-A5-A0G1-01 | Endometrium | uterine corpus endometrioid carcinoma | Female | >=65 | I/II | Unknown | Unknown | SD | |
| GMFG | SNV | Missense_Mutation | novel | c.82G>T | p.Asp28Tyr | p.D28Y | O60234 | protein_coding | deleterious(0) | possibly_damaging(0.557) | TCGA-A5-A2K5-01 | Endometrium | uterine corpus endometrioid carcinoma | Female | >=65 | I/II | Unknown | Unknown | SD |
| GMFG | SNV | Missense_Mutation | novel | c.229N>T | p.His77Tyr | p.H77Y | O60234 | protein_coding | deleterious(0) | probably_damaging(0.949) | TCGA-AX-A2HD-01 | Endometrium | uterine corpus endometrioid carcinoma | Female | >=65 | III/IV | Unknown | Unknown | SD |
| GMFG | SNV | Missense_Mutation | novel | c.371N>A | p.Arg124His | p.R124H | O60234 | protein_coding | deleterious(0) | probably_damaging(0.99) | TCGA-EO-A22R-01 | Endometrium | uterine corpus endometrioid carcinoma | Female | <65 | I/II | Unknown | Unknown | SD |
| GMFG | SNV | Missense_Mutation | rs200778340 | c.65N>A | p.Arg22His | p.R22H | O60234 | protein_coding | deleterious(0) | probably_damaging(0.977) | TCGA-EO-A22R-01 | Endometrium | uterine corpus endometrioid carcinoma | Female | <65 | I/II | Unknown | Unknown | SD |
| GMFG | SNV | Missense_Mutation | rs142875775 | c.118N>T | p.Arg40Trp | p.R40W | O60234 | protein_coding | deleterious(0) | possibly_damaging(0.88) | TCGA-EO-A3AZ-01 | Endometrium | uterine corpus endometrioid carcinoma | Female | >=65 | I/II | Unknown | Unknown | SD |
| Page: 1 2 |
Top |
Related drugs of malignant transformation related genes |
| Identification of chemicals and drugs interact with genes involved in malignant transfromation |
| (DGIdb 4.0) |
| Entrez ID | Symbol | Category | Interaction Types | Drug Claim Name | Drug Name | PMIDs |
| Page: 1 |

Copyright 2023-Present -The University of Texas Health Science Center at Houston |